HDB Market Pulse REAL ESTATE DATA TRENDS AND ANALYTICS Q4 2020 - OrangeTee
←
→
Page content transcription
If your browser does not render page correctly, please read the page content below
HDB Market Pulse
                REAL ESTATE DATA TRENDS AND ANALYTICS Q4 2020

•   The HDB resale market
    performance was
    extraordinary last year as
    demand and prices rose
    strongly despite the
    pandemic and economic
    fallout.

•   Last year, the HDB resale
    volume rose to its highest
    level in eight years; average
    price of resale flats was
    higher in 24 of 26 estates in
    Q4 2020.

•   Despite the recent price
    hike, the HDB market may
    still not be at risk of a
    housing bubble now as
    prices are still 7.6 per cent
    below the peak in Q2 2013.

•   The HDB resale market will
    continue to see a flurry of
    activities this year; prices
    and demand are expected to
    rise further.
                                           Tampines Green Forest/ OrangeTee & Tie Research & Analytics Photo

              Terms of Use: The reproduction or distribution of this publication without the express consent of the author is prohibited. This publication is
              provided for general information only and should not be treated as an invitation or recommendation to buy or sell any specific property or as
              sales material. Users of this report should consider this publication as one of the many factors in making their investment decision and should
              seek specific investment advice. OrangeTee.com Pte Ltd and the authors of this publication shall not accept and hereby disclaim all               1
              responsibilities and liability to all persons and entities for consequences arising out of any use of this publication.
              Copyright © OrangeTee & Tie Pte Ltd. All rights reserved.
HDB resale market remains in good shape despite economic slowdown
  Ample liquidity from massive fiscal stimulus is                           Chart 1 Market summary
  boosting asset values and pushing property
  prices higher in many developed countries. In
  Singapore, the property market has largely held its
  own during the pandemic while other sectors are
  still struggling to recover from the economic
  fallout. For both the private and public housing
  sectors, home prices are pushing new boundaries
  in many locations and buyer demand remains
  buoyant despite the pandemic.

          The HDB resale market was in good
  shape despite the difficult economic conditions.
  Last year, the market performance of the resale
  market was extraordinary as demand and prices
  rose strongly.

          According to the HDB public housing data
                                                                             Chart 2 Overall price index rose by 3.1% q-o-q
  for Q4 2020, prices of HDB resale flats rose a third
  consecutive quarter by 3.1 per cent quarter-on-
  quarter (q-o-q) (Charts 1 and 2). This is also the
  highest quarterly increase since Q3 2011. For the
  whole of 2020, prices rose 5.0 per cent, the
  steepest increase since 2012 when prices rose
  6.5 per cent. It is also more than the 0.1 per cent
  price gain in 2019.

          Last year, resale volume rose to its
  highest level in eight years (Chart 4). According to
  the HDB public housing data for the fourth quarter
  of 2020, 7,642 units were transacted, 1.9 per cent
  lower than the 7,787 units sold in Q3 2020 but
  20.6 per cent higher than the 6,339 units sold in
  Q4 2019 (Chart 5). For the whole of 2020, 24,748
  resale units were transacted, the highest number
  recorded since 2012 when 25,094 units were sold
                                                                            Chart 3 Prices remained resilient across the board
  then.

           Against a backdrop of the worst
  economic crisis in living memory and a growing
  supply of HDB flats, the rapid rise in property
  prices was unexpected. Underpinning the
  resilience of the HDB market is an extensive slew
  of stimulus measures launched by the
  government to support the economy. Large scale
  government support on multiple fronts has
  limited income loss and prevented massive
  unemployment among Singaporeans. Most
  workers were able to keep their earnings with the
  help of various Jobs Support and Wage Credit
  schemes. Some buyers were confident that they
  have the ability to service their housing loans and
  proceeded with their new home purchases.

Terms of Use: The reproduction or distribution of this publication without the express consent of the author is prohibited. This publication is   2
provided for general information only and should not be treated as an invitation or recommendation to buy or sell any specific property or as
sales material. Users of this report should consider this publication as one of the many factors in making their investment decision and should
seek specific investment advice. OrangeTee.com Pte Ltd and the authors of this publication shall not accept and hereby disclaim all
responsibilities and liability to all persons and entities for consequences arising out of any use of this publication.
Copyright © OrangeTee & Tie Pte Ltd. All rights reserved.
Chart 4 Highest volume in eight years                                                  Further, we are now reaping a ‘harvest of
                                                                                 market stability’ as a result of punitive measures
                                                                                 like the Total Debt Servicing Ratio (TDSR),
                                                                                 Mortgage Servicing Ratio (MSR) and Seller’s
                                                                                 Stamp Duty (SSD) that were put in place over the
                                                                                 years. On hindsight, these measures have sown
                                                                                 good seeds of financial prudence and
                                                                                 soundness in the financial system, which have
                                                                                 prevented most buyers from overleveraging and
                                                                                 built a buffer against huge credit losses in times
                                                                                 of market uncertainties.

                                                                                          Various financial assistance schemes
                                                                                 and loan deferment options were also made
                                                                                 available to individuals facing temporary
                                                                                 cashflow difficulties. As a result, potential
                                                                                 indebtedness which could have triggered panic
                                                                                 selling and collapsing property prices were
                                                                                 largely avoided.
     Chart 5 Volume in Q4 2020 was 20.6% higher y-o-y
                                                                                          Other factors that may have contributed
                                                                                 to the market recovery include the slew of policy
                                                                                 measures done to improve the housing
                                                                                 affordability for Singaporeans and increase older
                                                                                 flats' attractiveness. Some of these policies
                                                                                 include the enhancement of housing grants for
                                                                                 first-time buyers and raising the income ceiling
                                                                                 of Singaporeans buying flats. Buyers were also
                                                                                 given greater flexibility in using more Central
                                                                                 Provident Fund monies for their flat purchases.
                                                                                 The cumulative effect of many policy changes
                                                                                 sustained buying interest or have even created
                                                                                 new demand for housing flats.

                                                                                          Despite the price hikes, the HDB market
                                                                                 may still not be at risk of a housing bubble now.
                                                                                 Typical signs of an asset bubble include the
                                                                                 decoupling of prices from housing income,
                                                                                 excessive speculative buying activities and
   Chart 6 Prices are still below the peak                                       many buyers overleveraging in their property
                                                                                 purchase. Many measures have already been put
                                                                                 in place to prevent some of these scenarios from
                                                                                 occurring.

                                                                                          Further, prices have only increased by
                                                                                 5.6 per cent from Q2 2019 to Q4 2020. Last
                                                                                 quarter, prices of HDB resale flats are still 7.6 per
                                                                                 cent below the peak in Q2 2013 (Chart 6).
                                                                                 Previously, prices soared by 17 continuous
                                                                                 quarters from Q1 2009 to Q2 2013 to reach the
                                                                                 peak price. The cumulative price growth was
                                                                                 49.4 per cent over that period. Subsequently,
                                                                                 prices either stagnated or fell quarterly for about
                                                                                 six years. Resale prices have just emerged from
                                                                                 the doldrums last year and are still on a slow
                                                                                 climb up.

Terms of Use: The reproduction or distribution of this publication without the express consent of the author is prohibited. This publication is   3
provided for general information only and should not be treated as an invitation or recommendation to buy or sell any specific property or as
sales material. Users of this report should consider this publication as one of the many factors in making their investment decision and should
seek specific investment advice. OrangeTee.com Pte Ltd and the authors of this publication shall not accept and hereby disclaim all
responsibilities and liability to all persons and entities for consequences arising out of any use of this publication.
Copyright © OrangeTee & Tie Pte Ltd. All rights reserved.
Chart 7 Volume rose further last quarter
MATURE ESTATES
Resale transactions of HDB flats in
mature estates rose further last
quarter. The total number of
transactions increased by 6.6 per cent
from 3,085 units in Q3 2020 to 3,288
units in Q4 2020 (Chart 7).
The most popular estate was
Tampines with 547 units transacted
last quarter. This is followed by Bedok
with 394 transactions and Ang Mo Kio
with 296 transactions in Q4 2020 (Chart
8).
Chart 8 Tampines and Bedok were most popular among buyers
The average price of flats was
highest at Bukit Timah at S$711,181,
followed by Queenstown at S$627,930,
Bishan at S$626,469, and Central Area
at S$626,209 in Q4 2020 (Chart 9).
Average price of flats in 13 of
the 15 estates saw an increase last
quarter (Table 1). Resale flats in Marine
Parade rose the most by 14.8 per cent,
followed by Geylang by 11.1 per cent.
Chart 9 Flats in Bukit Timah fetched the highest price Table 1 Prices rose in 13 of 15 estates
Town Q3 2020 Q4 2020 % change
MARINE PARADE $453,140 $520,372 14.8%
GEYLANG $431,656 $479,556 11.1%
TOA PAYOH $419,783 $458,450 9.2%
ANG MO KIO $396,908 $428,380 7.9%
KALLANG/WHAMPOA $471,836 $502,020 6.4%
PASIR RIS $498,602 $527,761 5.8%
QUEENSTOWN $593,729 $627,930 5.8%
BUKIT MERAH $545,005 $573,687 5.3%
BEDOK $409,281 $429,119 4.8%
CLEMENTI $484,986 $508,172 4.8%
SERANGOON $482,736 $502,875 4.2%
TAMPINES $486,143 $495,933 2.0%
CENTRAL AREA $617,476 $626,209 1.4%
BISHAN $633,326 $626,469 -1.1%
BUKIT TIMAH $731,077 $711,181 -2.7%
Source: Data.gov.sg, OrangeTee & Tie Research & Analytics
Terms of Use: The reproduction or distribution of this publication without the express consent of the author is prohibited. This publication is
4
provided for general information only and should not be treated as an invitation or recommendation to buy or sell any specific property or as
sales material. Users of this report should consider this publication as one of the many factors in making their investment decision and should
seek specific investment advice. OrangeTee.com Pte Ltd and the authors of this publication Source: Data.gov.sg, HDB, OrangeTee
shall not accept & Tie Research
and hereby disclaim& Consultancy
all
Copyright
responsibilities and liability to all persons and entities for consequences arising out of any use of this©publication.
OrangeTee & Tie Pte Ltd. All rights reserved.
Copyright © OrangeTee & Tie Pte Ltd. All rights reserved.
Chart 10 Sales dipped 7.1% q-o-q

      NON-MATURE ESTATES
      Resale transactions of HDB flats dipped
      7.1 per cent last quarter from 4,281 units
      in Q3 2020 to 3,975 units in Q4 2020
      (Chart 10). The decline in sales
      transactions was observed across 9
      estates out of 11 last quarter. Of the 11
      estates, sales volume rose in Sengkang
      and Punggol in Q4 2020.

               The most popular non-mature
      estates were Sengkang (725 units),
      Punggol (646 units), Jurong West (406
      units), Yishun (389 units), and Hougang
      (386 units) (Chart 11).
                                                                          Chart 11 Sengkang and Punggol were most popular
               Transactions declined amid a
      price surge seen across all non-mature
      estates. Last quarter, prices rose
      across the board with all 11 estates
      experiencing a surge in prices (Table
      2). Average prices rose the most in
      Jurong (12.1 per cent), followed by
      Yishun (8.3 per cent) and Woodlands
      (6.5 per cent).

             In terms of price quantum,
      average price of flats was highest at
      Punggol at S$483,126, followed by
      Hougang at S$472,031, and Sengkang
      at S$464,691 in Q4 2020 (Chart 12).

    Table 2 Prices rose across the board in Q4 2020                       Chart 12 Punggol flats fetched the highest price
     Town                       Q3 2020         Q4 2020 % change
     JURONG EAST                $406,146        $455,453 12.1%
     YISHUN                     $377,964        $409,415 8.3%
     WOODLANDS                  $403,769        $429,847 6.5%
     BUKIT PANJANG              $440,325        $463,868 5.3%
     HOUGANG                    $448,206        $472,031 5.3%
     JURONG WEST                $413,095        $433,984 5.1%
     BUKIT BATOK                $412,131        $429,910 4.3%
     CHOA CHU KANG              $411,946        $429,034 4.1%
     PUNGGOL                    $464,901        $483,126 3.9%
     SEMBAWANG                  $402,067        $414,249 3.0%
     SENGKANG                   $453,965        $464,691 2.4%
    Source: Data.gov.sg, OrangeTee & Tie Research & Analytics

Terms of Use: The reproduction or distribution of this publication without the express consent of the author is prohibited. This publication is
    Source: Data.gov.sg, HDB, OrangeTee & Tie Research & Consultancy
provided for general information only and should not be treated as an invitation or recommendation to buy or sell any specific property or as     5
    Copyright © OrangeTee & Tie Pte Ltd. All rights reserved.
sales material. Users of this report should consider this publication as one of the many factors in making their investment decision and should
seek specific investment advice. OrangeTee.com Pte Ltd and the authors of this publication shall not accept and hereby disclaim all
responsibilities and liability to all persons and entities for consequences arising out of any use of this publication.
Copyright © OrangeTee & Tie Pte Ltd. All rights reserved.
“   Harvest of Market Stability

    We are now reaping a ‘harvest of market
    stability’ as a result of many punitive
    measures that were put in place over the
    years.
    On hindsight, these measures have
    sown good seeds of financial prudence
    and soundness in the financial system,
    which have prevented most buyers from
    overleveraging and built a buffer against
    huge credit losses in times of market
    uncertainties.

    -     Christine Sun

                                                                                                      Parkland Residences / OrangeTee & Tie Research & Analytics Photo

Terms of Use: The reproduction or distribution of this publication without the express consent of the author is prohibited. This publication is   6
provided for general information only and should not be treated as an invitation or recommendation to buy or sell any specific property or as
sales material. Users of this report should consider this publication as one of the many factors in making their investment decision and should
seek specific investment advice. OrangeTee.com Pte Ltd and the authors of this publication shall not accept and hereby disclaim all
responsibilities and liability to all persons and entities for consequences arising out of any use of this publication.
Copyright © OrangeTee & Tie Pte Ltd. All rights reserved.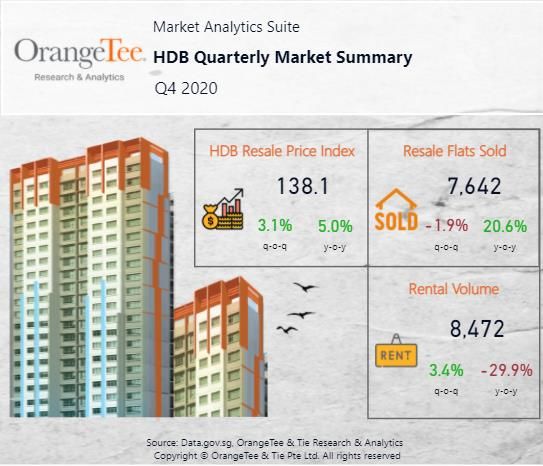
RENTAL
                                                                                                In light of the challenging employment
                                                                                                climate and travel restrictions, the rental
Chart 13 Rental applications rose slightly                                                      market may continue to face some
                                                                                                challenges this year. Nevertheless, flats
                                                                                                in certain locations may still be in high
                                                                                                demand, especially residential homes
                                                                                                located near industrial sites. Many
                                                                                                employers are still scouting for
                                                                                                accommodations to relocate their
                                                                                                workers from dormitories.

                                                                                                         Given that the accommodation
                                                                                                budgets of some foreign expats have
                                                                                                been reduced, some have downgraded
                                                                                                from private home rentals to flats. Some
                                                                                                expats especially singles do not mind
                                                                                                renting newer flats especially those in the
                                                                                                city fringe. The number of overseas
                                                                                                students entering Singapore have also
                                                                                                grown over the past few months,
                                                                                                propping up rental demand for flats that
                                                                                                are located near international schools.

                                                                                                         The approved applications to
                                                                                                rent out HDB flats increased by 3.4 per
  Chart 14 Rental index rose 1.2 per cent in 2020                                               cent from 8,196 units in Q3 2020 to 8,472
                                                                                                units in Q4 2020 according to the HDB
                                                                                                public housing data for the fourth quarter
                                                                                                of 2020. Compared to Q4 2019, the
                                                                                                number of approved applications was
                                                                                                29.9 per cent lower than the 12,079 units
                                                                                                (Chart 13). For the whole of 2020, 38,798
                                                                                                applications were recorded, dipping 19.5
                                                                                                per cent year-on-year. As at the end of Q4
                                                                                                2020, 59,092 flats were rented out.

                                                                                                         Rents rose further last year,
                                                                                                although at a slow pace than the
                                                                                                prevailing year. According to the SRX
                                                                                                Rental Index, rents of HDB resale flats
                                                                                                rose 1.2 per cent for the whole of 2020,
                                                                                                less than the 1.4 per cent increase in
                                                                                                2019 (Chart 14).

                                                                                                        We estimate that overall rents
                                                                                                may increase slightly by up to 3 per cent
                                                                                                this year (Chart 17 and Table 3).
                                                                                                Depending on how fast air travel can fully
                                                                                                resume, the rental volume may hit 42,000
                                                                                                to 44,000 units in 2021.

 Terms of Use: The reproduction or distribution of this publication without the express consent of the author is prohibited. This publication is   7
 provided for general information only and should not be treated as an invitation or recommendation to buy or sell any specific property or as
 sales material. Users of this report should consider this publication as one of the many factors in making their investment decision and should
 seek specific investment advice. OrangeTee.com Pte Ltd and the authors of this publication shall not accept and hereby disclaim all
 responsibilities and liability to all persons and entities for consequences arising out of any use of this publication.
 Copyright © OrangeTee & Tie Pte Ltd. All rights reserved.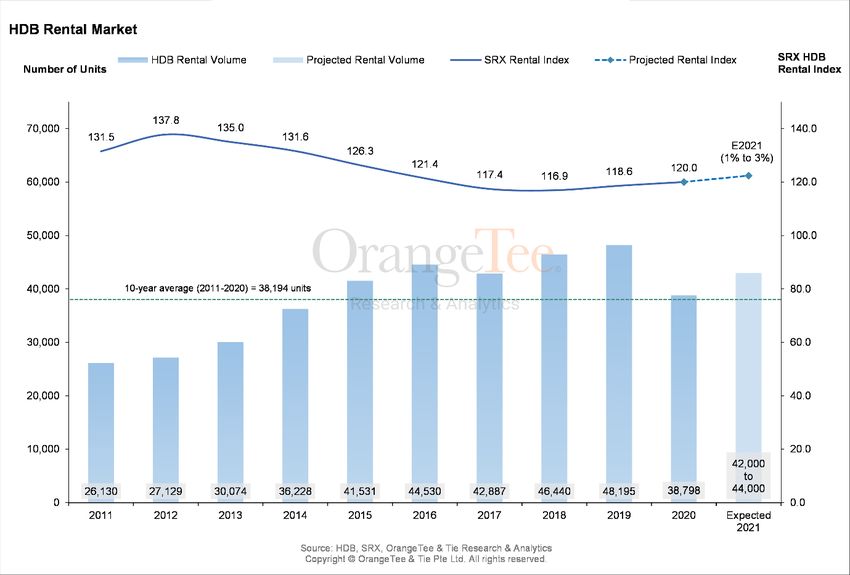
Chart 15 Summary of HDB resale transactions and average resale prices for Q4 2020
                                                                                     North Region
                                                                              Total no.                  Median Resale Price
                                                      Planning
                                                                              of units
                                                        Area
                                                                                sold           3-Room           4-Room        5-Room
                                             Sembawang (SBW)                     101          $309,500          $372,237     $425,479
                                             Woodlands (WDL)                     377          $277,023          $370,361     $444,969
                                             Yishun (YIS)                        389          $297,741          $395,016     $503,987

                                   West Region                                                                                      North-East Region
                               Total no.         Median Resale Price                                                            Total no.
       Planning                                                                                               Planning                              Median Resale Price
                               of units                                                                                         of units
         Area                                                                                                   Area
                                 sold     3-Room      4-Room       5-Room                                                         sold      3-Room       4-Room       5-Room
Bukit Batok (BBT)                 185         $276,239         $383,426         $534,311                Ang Mo Kio (AMK)           296         $309,805         $437,501     $680,157
Bukit Panjang (BPJ)               332         $315,247         $426,061         $532,231                Hougang (HGN)              386         $305,908         $424,686     $550,633
Choa Chu Kang (CCK)               273         $332,886         $395,587         $466,047                Punggol (PGL)              646         $373,111         $477,328     $538,031
Clementi (CLE)                    203         $361,719         $554,949         $751,614                Sengkang (SKG)             725         $354,532         $439,839     $502,947
Jurong East (JUR)                 155         $310,792         $430,452         $519,760                Serangoon (SER)            145         $313,679         $458,870     $587,826
Jurong West (JUW)                 406         $281,739         $393,369         $474,329

                                                                                                                                         East Region
                                        Central Region
                                   Total no.           Median Resale Price                                                   Total no.                 Median Resale Price
          Planning                                                                                          Planning
                                   of units                                                                                  of units
            Area                                                                                              Area
                                     sold      3-Room     4-Room        5-Room                                                 sold           3-Room           4-Room      5-Room
 Bishan (BSH)                        182      $340,417   $540,246      $748,181                        Bedok (BDK)              394          $305,834         $465,726     $595,323
 Bukit Merah (BMH)                   282      $375,191   $663,048      $750,667                        Pasir Ris (PSR)          265          $381,250         $461,884     $527,200
 Bukit Timah (BTH)                    16      $362,000   $700,222      $874,250
                                                                                                       Tampines (TAM)           547          $341,577         $457,062     $571,626
 Central Area (CTA)                   59      $429,572   $702,744      $898,921
 Geylang (GEY)                       196      $307,383   $586,967      $700,941
 Kallang / Whampoa (KAL)             211      $346,310   $558,393      $679,181
 Marine Parade (MPR)                  56      $362,530   $471,591      $799,082
 Queenstown (QUE)                    227      $398,851   $766,613      $893,865
 Toa Payoh (TAP)                     209      $279,756   $559,713      $760,014

                                                               Source: Data.gov.sg, OrangeTee & Tie Research & Analytics

         Terms of Use: The reproduction or distribution of this publication without the express consent of the author is prohibited. This publication is
         provided for general information only and should not       be treated    as an adjoined
                                                                                        invitation  or DBSS<
                                                                                                        recommendation to buy or maisonette,
                                                                                                                                  sell any specific property or as   8
                                                                Standard  flats exclude          flats,      improved-maisonette,
         sales material. Users of this report should consider this publication as one of the many factors in making their investment decision and should
                                                                Model A-Maisonette, New Generation, Premium Apartments and Maisonette,
         seek specific investment advice. OrangeTee.com Pte Ltd and the authors of this publication shall not accept and hereby disclaim all
                                                                Terrence,  Type S1&S2 arising out of any use of this publication.
         responsibilities and liability to all persons and entities  for consequences
         Copyright © OrangeTee & Tie Pte Ltd. All rights reserved.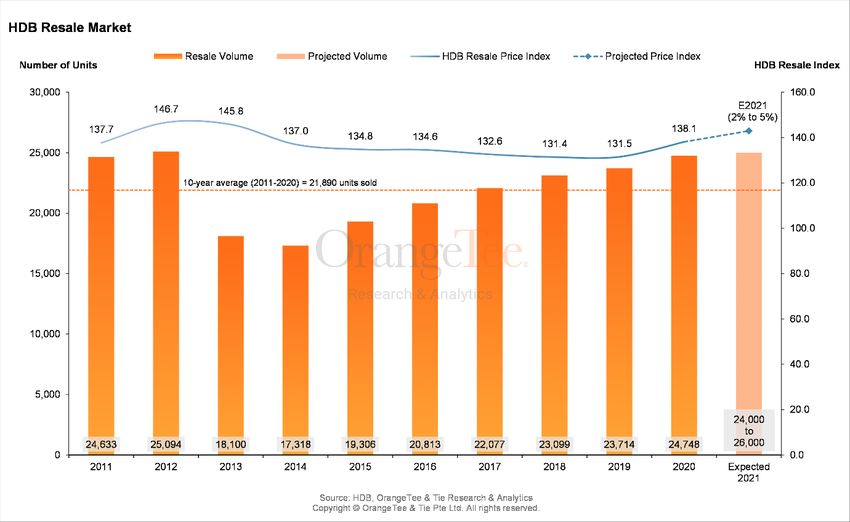
Chart 16 Projection for HDB Resale Price and Volume

     Chart 17 Projection for HDB Rental Price and Volume

Terms of Use: The reproduction or distribution of this publication without the express consent of the author is prohibited. This publication is   9
provided for general information only and should not be treated as an invitation or recommendation to buy or sell any specific property or as
sales material. Users of this report should consider this publication as one of the many factors in making their investment decision and should
seek specific investment advice. OrangeTee.com Pte Ltd and the authors of this publication shall not accept and hereby disclaim all
responsibilities and liability to all persons and entities for consequences arising out of any use of this publication.
Copyright © OrangeTee & Tie Pte Ltd. All rights reserved.
Table 3 HDB Market projection

                                                                                        Q4 2020                             Projection for
                        Indicators                           2018            2019                        2020
                                                                                         Q-o-Q                                  2021
         Resale
         Price Change                                        -0.9%            0.1%       3.1%            5.0%                 2% to 5%
         Sales Volume (units)                               23,099           23,714      7,642          24,748            24,000 to 26,000
         Rental
         Rental Price Change (SRX)                           -0.4%           1.5%        1.4%             1.2%                 1% to 3%
         HDB Rental Applications
                                                            46,440           48,195      8,472          38,798            42,000 to 44,000
         (units)
       Source: Data.gov.sg, HDB, SRX, OrangeTee & Tie Research & Analytics

                  Prices and demand for resale flats are                                       With more flats reaching MOP, we may
     expected         to rise
       Source: Data.gov.sg,       further& Tie
                            HDB, OrangeTee     asResearch
                                                      the global       economic
                                                             & Consultancy            expect more transactions this year. Therefore, we
      .Copyright © is
     outlook           likely to be more favourable this year.
                   OrangeTee & Tie Pte Ltd. All rights reserved.
                                                                                      are optimistic that the HDB resale volume may
     With mass immunization being rolled out globally,                                rise further by up to 5 per cent this year, to around
     the worst of the pandemic could be over this year                                24,000 to 26,000 units (Chart 16 and Table 3).
     and key economies may fare better than last year.                                Prices of resale flats may continue to rise by 2 to
     Moreover, there is still ample liquidity circulating in                          5 per cent for the whole of 2021.
     the system as investment funds have reallocated
     a massive amount of capital from financial
                                                                                      Chart 18 More flats reaching MOP this year
     markets to real estate properties.

              The HDB resale market will continue to
     see a flurry of activities this year. The soft
     employment market may cause more families to
     downgrade from private homes to HDB flats. On
     the other hand, couples who are still thriving in
     their jobs may proceed with their upgrading plans
     which may lead to more flats being put up in the
     market for sale.

             There will also be more flats reaching
     Minimum Occupation Period (MOP) this year.
     According to the latest data released by
     data.gov.sg in January 2021, 25,530 HDB flats will
     be reaching MOP this year, 5.7 per cent more than
     2020 (Chart 18).

Please contact us for further inquiries
OrangeTee & Tie Research and Analytics

  Terms of Use: The reproduction or distribution of this publication without the express consent of the author is prohibited. This publication is
                                                                                                                                                    10
  provided for general information only and should not be treated as an invitation or recommendation to buy or sell any specific property or as
  sales material. Users of this report should consider this publication as one of the many factors in making their investment decision and should
  seek specific investment advice. OrangeTee.com Pte Ltd and the authors of this publication shall not accept and hereby disclaim all
  responsibilities and liability to all persons and entities for consequences arising out of any use of this publication.
  Copyright © OrangeTee & Tie Pte Ltd. All rights reserved.
You can also read


