JP MORGAN HEALTHCARE CONFERENCE 2021 - JANUARY/2021 - MZIQ
←
→
Page content transcription
If your browser does not render page correctly, please read the page content below

JP Morgan Healthcare Conference 2021
January/2021
Disclaimer

    This release contains forward-looking statements that are exclusively related to the prospects of the business, its operating and financial
    results, and prospects for growth. These data are merely projections and, as such, based exclusively on our management's expectations
    for the future of the business and its continued access to capital to fund its business plan. These forward-looking statements
    substantially depend on the market conditions, government regulations, competitive pressures, the performance of the Brazilian
    economy and the industry, among other factors, as well as the risks shown in our filed disclosure documents, and are therefore subject
    to change without prior notice.

    In addition, unaudited information herein reflects management's interpretation of information taken from its financial statements and
    their respective adjustments, which were prepared in accordance with market practices and for the sole purpose of a more detailed and
    specific analysis of our results. Therefore, these additional considerations and data must also be analyzed and interpreted independently
    by shareholders and market agents, who should carry out their own analysis and draw their own conclusions from the information
    reported herein. No data or interpretative analysis provided by our management should be treated as a guarantee of future performance
    or results and are merely illustrative of our directors' vision of our results.

    Our management is not responsible for compliance or accuracy of the data from this report, which must be considered as for
    informational purposes only, and should not override the analysis of our audited consolidated financial statements for purposes of a
    decision to invest in our stock, or for any other purpose.

2
Hypera Pharma: #1 pharmaceutical company in Brazil1

     Fast-growing                        Not-replicable                         Innovation                             Large scale                            Capital
     and resilient                         branded                             supported by                            integrated                            allocation
       pharma                              portfolio                            an state-of-                            business                            focused on
        market                                                                    the-art                                model                              sustainable
                                                                                innovation                                                                  growth and
                                                                                  center                                                                    cash return

     Note: 1in sell-out PPP 2019, according to IQVIA. Includes the sell-out of recent announced acquisitions and the brands acquired from Takeda are still pending
3
     approval from antitrust agencies and other conditions precedent for conclusion.
The fast-growing and resilient pharma market

4

Brazil is the largest pharma market in Latam and should grow
    ahead of the Emerging Markets average until 2023
      Latin American Market (USD)1                                       Real Growth 2020 LTM2                    Forecasted 2019-23 Nominal CAGR3

                                                                                                  8.2%           India                          11%
                                                                                                                Russia                         10%
                                                                           6.4%                                                           8%
                                    Other
                                                                                                                   EM                    7%
          27.7bn                    34.4bn
           45%                       55%                                                                          EUA                    7%
                                                                                                                 China               6%
                                                                                                                Global              6%
                                                                                                                   UK              5%
                                                                            Total                               Outros             5%
                                                                           Latam

5    Source: 1in Sell-out PPP 2019, according to IQVIA; 2in Sell-out PPP LTM 1Q20, according to IQVIA; 3IQVIA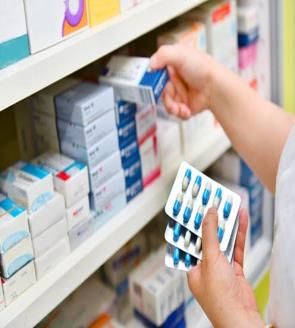
Pharmaceutical retail has consistently grown above GDP,
    even during periods of economic recession
                                            Retail Pharma Market Growth (Volume) vs. GDP Growth

           9.4%                                                                                                    8.7%
                                                      8.7%
                                   7.7%
                                                                     6.1%            6.1%
                                                                                                     4.7%

                    0.5%                                                    1.1%             1.1%           1.1%

                                            -3.6%            -3.3%                                                        -4.4%

                2014                    2015             2016           2017               2018           2019       2020E

                                                 Brazilian pharma retail market (volume)            GDP
6    Source: IQVIA, IPEA Data and Focus Report
The fast ageing of Brazilian population should increase the
    “out of pocket” drug expenditure
                                                                                                            Prescription Drugs Expenditure
                           Population 60+ (mm of               people)1                                        (R$ per month / family)2

    90

                                                                             32%       35%

                                                                                             CAGR
                                                                 28%                                10-19          52.2
    80

                                                                                       30%
                                                                                             2.8%
    70
                                                      24%                                           20-29            67.4
                                                                              73       25%

    60

                                          19%                      66                               30-39              82.2
                               14%
                                                                                       20%

                                                       54
    50

                                                                                                    40-49                   112.1
    40

                   11%                                                                 15%

         8%                                 42
    30

                                                                                                    50-59                       150.7
                                30
                                                                                       10%

    20

                    21                                                                 5%
                                                                                                    60-69                                222.8
         14
    10

     0                                                                                 0%
                                                                                                     70+                                     230.7
         2000      2010        2020       2030        2040       2050        2060

7        Source: 1IBGE (2010), revised and updated; 2IBGE (2010), updated by inflation (IPCA)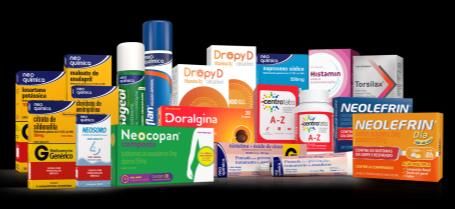
Retail represents 70% of the total Brazilian pharma market,
    with brands accounting for 85% of the total retail market
                       Brazilian Pharma Market (BRL)1                                                              Retail Market per product (BRL)1

                                                                                                                                 Generics
                                                                                                                                  10.4bn
                                                                                                                                   15%
                             Retail                                                                                                       OTC3
                             70bn                                                                                                        13.7bn
                              70%                                                                                    RX/OTX2              20%
                                                                                                                      45.9bn
                                                                                                                       65%

8    Note: ¹Sell-out PPP LTM 1Q20, according to IQVIA ; 2Branded RX, OTX and Dermocosmetics; 3OTC and Sweeteners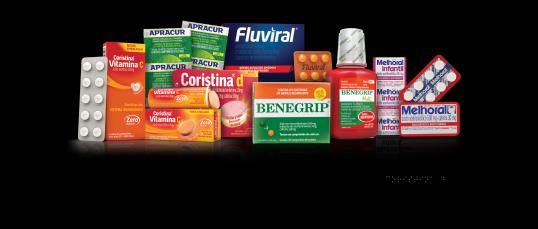
The fast-growing and resilient pharma market

    The not-replicable branded portfolio

9
Hypera Pharma is the only company with relevant participation
 in all segments of the pharma retail market
                                                           RX/OTX              OTC   DERMO   GENERICS

     Note: Excludes companies with less than 3% market-share in the segments
10
     Source: IQVIA
Not-replicable branded portfolio with 11 leading BRL100mi+
Power Brands¹ that accounted for 38% of sales
Sales Breakdown (BRL)²
Pain (Similar) 1st in category
Vitamin D 1st in category
Anti-flu 1st in category
Consumer
RX/OTX 4 Sunscreen 2nd in category
46%
Health Respiratory (Similar) 1st in category
36% 1st in category
Anti-inflammatory
Dermo Pain 3rd in category
OTC3 9%
31% Pain 2nd in category
Generics
14% Gastro 1st in category
Respiratory 1st in category
Sweetener 1st in category
11 Note: 1Brands with more than BRL100 million in Sell-out, according to IQVIA; ²Company Net Revenues in 2019; 3OTC products and sweetenersRecent announced acquisitions will add 4 new Power Brands
and 2 new patented drugs to Hypera Pharma’s portfolio
Power Brand Patented Power Brand
Power Brand Power Brand
Patented
60% OTC Approximately 40% RX/OTX
R$1.3bn 1
(+2pp market-share
in Brazil)
Note: 1Sell-out PPP 2019, according to IQVIA. The conclusion of the acquisition of Takeda's brands is still pending approval by CADE and other precedent
12
conditions.With the recent acquired brands, Hypera Pharma becomes the
largest pharmaceutical player in Brazil, with 9% market-share1
Sell-out1
#1 5.8
#2 5.7
Sell-out1
#1 5.7
#3 4.7
#2 4.7
#3 4.5 #4 4.5
#4 4.5
#5 4.2
#5 4.2
Note: 1Sell-out PPP 2019 R$ billion, according to IQVIA, and excludes infant formula. The conclusion of the acquisition of Takeda's brands is still pending approval by
13
CADE and other precedent conditions.The fast-growing and resilient pharma market
The not-replicable branded portfolio
The innovation model
14Innovation is key for sustainable growth for the main Brazilian
retail pharmaceutical companies
Sell Out PPP Real¹; BRL bn
CAGR -0.3% 7.8% 7.5%
5.6 21.6
• Stability in mature
-0.2
products sales
16.2
• Growth from recent
products launched
2 3 4 2
2014 MATURE LAUNCHES 2018
Note: ¹Deflated; ²LTM (Sep/18); ³Mature: Products launched before the last 5 years; 4Launches: Products launched in the last 5 years
15
Source: IQVIA PMB Retail (Sep/18), includes the main pharmaceutical Brazilian companiesThe company main innovation arms are Hynova, its state-of-
the-art innovation center, Bionovis and partnerships
+ Partnerships
New drugs
Biotechnology
New associations
New technologies
New pharmaceutical
forms
Similar & Generics
Specific and
phytotherapeutics
White spaces Incremental Radical
Moderate risk and Global competition
Low hanging fruits High investment and long
development process
16 processHypera Pharma invested BRL250mi+ in R&D in 2019, more than
any other pharma player in Brazil
86 162
BRL250M+ Conceded
registries Simultaneous projects
Invested
34 130+ 60 41
330+
at ANVISA
Protocols
Drugs Drugs New
Partnerships People
dedicated to
52
innovation
Non-Drugs
70
Non-Drugs
17Hypera Pharma’s increasing commitment to innovation is
supported by its strong balance sheet and operating cash flow
R&D Investments
(% of Net Revenues) 7.7%
+6.0 pp
4.9%
4.0%
2.8%
1.7%
2015 2016 2017 2018 LTM 3Q20
Note: Considers total R&D investments of the year (Expenses and Capitalization) and excludes the “Lei do Bem” incentives
18
Source: Company financialsNew products launchings accelerated in the past years,
supporting the Company’s sell-out growth
95
70
2019
53 52
2016 2017 2018 2019
% of launchings of the
past 2 years over net 9% 9% 10% 13%
revenue:
19A robust pipeline of around 400 projects to be launched in key
retail categories should boost the Company’s growth
RX/OTX OTC
CNS1 VMS2
12bi* 7bi*
Cardio
10bi*
32** Pain
45**
5bi*
23**
17**
Resp. GI3
6bi* 4bi*
19**
25**
Note: 1Central Nervous System; 2Vitamins, Minerals and Supplements; 3Gastrointestinal
20
Source: * 2025 Market size estimated based on IQVIA PMB September´19 – PPP and internal data; **Number of projects in the pipelineThe fast-growing and resilient pharma market
The not-replicable branded portfolio
The innovation model
The large scale integrated business model
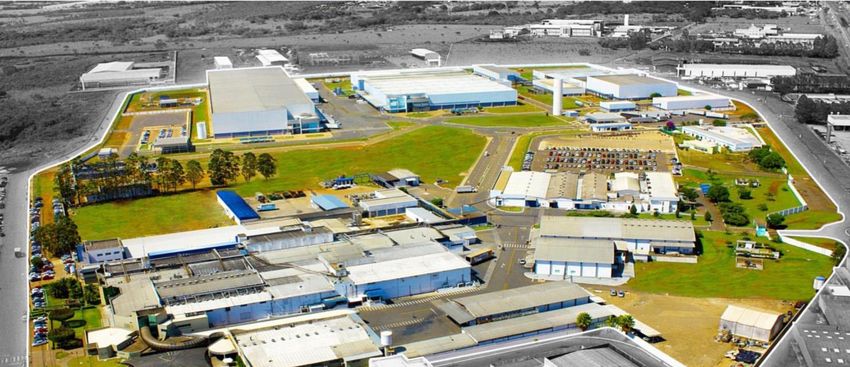
21Large scale manufacturing facilities in Anápolis to support sales
Solids/ Aerosol
Distribution Quality Liquids
Raw Effervescent
Center Control Semisolids
Materials Dermo
Injectables
R&D
Anápolis
Solids Penicillin
Semisolids
Liquids
R&D
~320,000 m2 land ~120,000 m2 constructed area ~3,700 employees
Production Capacity per year:
+ 17 billion units of solids
+ 40 million units of injectable medicines
22
+ 330 million units of liquids, creams, oils and lotionsNew projects in place for production capacity increase in 2021
Capacity
Conclusion Increase
Solids
expansion
4Q20 +75%
New Sterile +100% (ampoules)
plant
4Q21
+70% (eye drops)
VMS plant +650%
expansion
4Q20 (+900M units)
Distribution
Center expansion
3Q21 +50%
23Hypera Pharma counts on a diversified distribution system that
reaches 100% of drugstores in Brazil
Direct Transfer Indirect
Channel Order Channel
invoices & delivers
takes the orders
Distributor
Retailer
Hypera 27%1 Distributor
Warehouse
43%1 30%1
~80k Drugstores
24 Note: 1Percentage of Net Revenues in 2019Hypera Pharma is internally divided into 3 Business Units
based on demand generation
DOCTORS
TRADE & POS MEDIA
25The Business Units positioning reinforces Hypera Pharma’s
strength to capture the demand growth in the Brazilian market
1Q20 Net Revenue (per demand generation) Ranking (Sell-Out)*
Media1 Doctors² Trade/POS³
Media #1
Doctors 30% #2
39%
#3
#4
Trade/POS #5
31% #6
Note: ¹OTC and sweeteners promoted with Media; ²Branded RX, OTX and Dermo promoted to Doctors; ³Pure and Branded Generics promoted in the POS
26
Source: *IQVIA Dec/19 Sell Out in PPP, excludes recent acquisitionsThe brands recent acquired will strengthen Hypera Pharma’s
positioning in two Business Units
MEDIA DOCTORS
Sell-out1 Sell-out1
20%
#1 1.9 market-share2
#1 3.6
#2 1.0 #2 3.3
#3 0.6 #3 2.4
#4 0.6 #4 2.2
#5 0.4 #5 2.0
Note: 1Sell-out PPP 2019 R$ billion according to IQVIA; 2excludes infant formula. The conclusion of the acquisition of Takeda's brands is still pending approval by
27
CADE and other precedent conditions.The fast-growing and resilient pharma market
The not-replicable branded portfolio
The innovation model
The large scale integrated business model
Capital allocation focused on sustainable growth and cash return
28Capital allocation focused on long term sustainable growth
and cash return to shareholders
Operating Cash Flow
1 Organic Growth
• Production capacity
• R&D, Partnerships and Venture Capital
• Investments behind the brands
• Medical Representatives and Trade
2 Cash to Shareholders
Dividends, IOC, Share Buybacks and Capital Reduction
Inorganic Growth
Payment of recent announced acquisitions and new
Cash Position and New Debt 3 partnerships/M&As to boost sell-out growth and
speed up innovation
SELECTED
PORTFOLIO
29Capital allocation focus in pharma since 2015 led to sell-out,
EBITDA and Net Income organic growth
Sell-out PPP EBITDA Net Income
BRL bn BRL mm BRL mm
CAGR CAGR CAGR
10% 5.7% 37%
4.5
4.0 4.1 1,233 1,319 1,206 1,189
3.7
1,092 1,112 1,135
3.3
912 950
2.8
647
338 346
2014 2015 2016 2017 2018 2019 2014 2015 2016 2017 2018 2019 2014 2015 2016 2017 2018 2019
30 Source: Company Financials; Sell-out in PPP, according to QVIAConsistent increase of dividends/IOC in the past years
supported by organic growth and robust free cash flow
CAGR
BRL per share 19% 1.17
1.07
0.97
0.92
0.65
0.50
2016 2017 2018 2019 2020 2021
Dividend Yield: 1.5% 1.9% 2.7% 2.8% 3.1% 3.4%
31 Note: It considers the dividends paid in the respective periods; Dividend Yield calculated based on the price of December 31, 2020Hypera Pharma has several programs that seek to positively impact its stakeholders and the environment 32
Recent results reinforce the Company's commitment to
 sustainability and the well-being of its stakeholders

         +3,000                                 124,600                                  2,000                         81,235
         Employees trained in                    Vegetable seedlings                          Planted                  Families impacted by
           environmental                        donated to community                                                      actions in the
          education actions                        and employees                               trees                       community

                             Start of sending for
                               composting the
                                                                            Reuse of

                                                                     82million
                                                                                                            5%
                                                                                                        reduction in energy
                                                                                                                                         72%
                                                                                                                                         of employees
                                organic waste                        liters of water in the
                                                                                                          consumption in                participated in
                              generated in the                        production process                     Anápolis1                  environmental
                              operation in 2019                                                                                       education lectures
                                                                         between 2017                    2019 vs.2018
                                                                            and 2019

33   Note: * in kWn/unit manufactured; 2in Anápolis, Goiânia and Barueri sites
The Company has social programs that benefit its employees
and the communities with which it relates
MEDICINE DONATION SPONSORSHIP PROGRAM HYPERA PHARMA'S
PROGRAM FOR THE PROJECT “INSTITUTO VOLUNTEERING PROGRAM
HORAS DA VIDA”
;
Project that structures a
volunteer network with doctors,
who work in a humanized way
+400k providing appointments and
exams for free to the low-income
medicines and products
population, focusing on low-
donated in YTD2020
complexity treatments
34Main initiatives during the Covid-19 pandemic to support
employees and the community
• Donation of 20 pulmonary ventilators to the city of Anápolis
• Covid-19 test donation to the Goiás Volunteer Organization
• Promotion of free psychological assistance to professionals working in drugstores
• Provision of telemedicine service and Covid-19 tests to employees and their families
• Home office for risk group employees and administrative and sales teams
3536
You can also read


