A sustainable future for the global power industry - SUMMARY North America Power Reference Case Spring 2020
←
→
Page content transcription
If your browser does not render page correctly, please read the page content below
—
A sustainable future
for the global power
industry
SUMMARY
North America Power Reference Case
Spring 2020
—
“Despite the volatility brought
on by recent unforeseen events,
the North American energy market
– and the world in general – is
expected to continue its march
toward greater integration of
renewable generation, which is
expected to steadily increase
as coal plants are taken offline
and renewables construction
costs drop.”
         – North America Power Reference Case
NORTH AMERIC A POWER REFERENCE C A SE | SPRING 2020 | SUMMARY                                                3

—
A sustainable future for
the global power industry

       There is no frame of reference for the current           coming months and further declines in price are
       economic downturn driven by COVID-19, but we             likely until additional production cuts are made,
       know that it has an extreme impact on healthcare,        likely through a combination of market forces and
       heightened risks of commercial inactivity in many        the potential extension of OPEC+ agreements.
       parts of the economy, along with supply chain
       disruptions. Emergency support packages,                 Despite the volatility brought on by recent
       monetary stimulus, as well as successful measures        unforeseen events, the North American energy
       taken to contain the spread of the virus, should         market – and the world in general – continued its
       reduce the economic impacts.                             march toward greater integration of renewable
                                                                generation, which is expected to steadily increase
       The unprecedented shock driven by COVID-19, as           as coal plants are taken offline and renewables
       well as the extraordinary uncertainty, are stressing     construction costs drop.
       the global energy sector, and particularly the oil and
       gas industry, in ways not seen before. The               This summary is based on the Energy Market
       consequences of social distancing and stay-at-home       Advisors’ (EMA) spring 2020 North America Power
       orders have had enormous impacts on energy               Reference Case (S20) release. The Power Reference
       demand, especially oil.                                  Case is a 25-year forecast (2020 through 2044)
                                                                focused on the North American market. EMA also
       Almost simultaneously, an oil price war erupted          produces Power Reference Case reports that cover
       between Saudi Arabia and Russia in early March,          other regions of the world. Highlights from two of
       which fanned the deep uncertainty and further            those areas, Europe and Japan, are included at the
       complicated the oil market. Saudi Arabia and Russia      end of this document.
       reached a tentative agreement in early April to cut
       OPEC+ production. However, this agreement alone          Jump to highlights for Europe and Japan
       will not be enough to balance the market in the
4 A S U S TA I N A B L E F U T U R E F O R T H E G L O B A L P O W E R I N D U S T R Y
North American market summary Scenario analysis
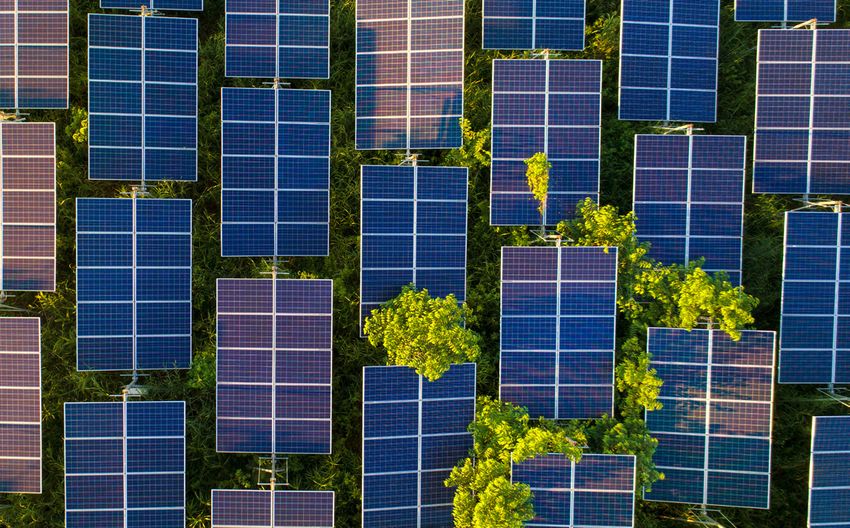
Driven by declining capital costs and a plethora of state, utility, The price of natural gas is the key driver of electricity prices in
and corporate clean-energy goals, solar, wind, natural gas and the United States. The S20 forecast studied four scenarios: a
energy storage are expected to dominate investment in the base case using current natural gas pricing trends, scenarios
power generation space across North America (NAM) over the for low and high natural gas prices, and the carbon tax
next 25 years. Several key factors that currently influence NAM scenario with the influence on power prices if a federal
power markets include: “carbon tax” is introduced. All scenarios considered the
effects of the COVID-19 pandemic. The S20 base forecast for
• the continuing evolution of the resource mix Henry Hub (HH) is for prices to stay under $4/MMBtu until the
• the impact of COVID-19 and oil price shock on electricity early 2030’s, making natural gas an attractive long-term power
demand generation fuel.
• the pipeline of renewable projects, including the growing
competition between wind and solar resources US all hours power prices (2020$/MWh)
• technology improvements
80
• favorable clean energy policies
• the availability of low-cost natural gas
60
Additional market fundamentals are considered including
changes in load growth, state and federal policies, fuel prices, 40
environmental policies, and scheduled plant additions and
closures. 20
Key findings 0 (Source: Energy Market Advisors)
For the short term, electric demand is expected to be
suppressed due to a high penetration of behind-the-meter
2020 2024 2028 2032 2036 2040 2044
distributed solar power resources, energy efficiency gains,
Base Low Gas Price High Gas Price Carbon Tax
and the global economic slowdown. The S20 forecast indicates
an economic rebound that starts modestly in 2021 but doesn’t
S20 release considerations
reach full recovery until 2023.
Significant changes between the fall 2019 (F19) report and the
S20 report include a reduction in solar PV construction costs
The continued closure of coal-fueled power plants, lower
of 5% for fixed and 13% for single-axis tracking technologies
natural gas prices and declining cost of renewable resources
over the study period. For onshore wind, construction costs are
opens the door for continued growth in natural gas, wind, and
anticipated to be 13% lower in 2044 with the assumption that
solar capacity. Over the forecast period, 107 gigawatts (GW) of
costs will decline at 2% year-on-year through 2030 and then 1%
coal generation is anticipated to be shut down. Over 37 GW of
per year thereafter. The following figure compares EMA’s wind
the shutdowns will be based on economics alone, as
and solar capital costs between the F19 and S20 release.
renewable generation becomes more competitive.
NORTH AMERIC A POWER REFERENCE C A SE | SPRING 2020 | SUMMARY                                                                 5

Wind and solar capital costs forecast (2020$/kW)                                   Natural gas is by far the dominant energy resource, accounting
1700                                                                               for about 41% (1,560 TWh) of the energy fuel mix in 2020. With
1600                                                                               unprecedented low gas prices and adequate future supply,
1500                                                                               natural gas is expected to remain the largest power supply
1400                                                                               source in 2044, contributing over 43% (2,089 TWh), while solar,
1300                                                                               wind and other renewable resources more than double from
1200                                                                               517 TWh in 2020 to over 1,221 TWh – that’s an increase in power
1100                                                                               contribution from approximately 14% to over 25%.
1000
900                                                                                Regional dynamics
800                                             (Source: Energy Market Advisors)   The 2020 load growth is expected to be about 5% lower
                                                                                   on average across all regions compared to pre-economic
       2020     2024       2028                  2036       2040         2044
                                                                                   downturn forecasts but is expected to rebound beginning in
                                      2032
                                                                                   2021. Overall, the annual growth rate in the peak-demand is
        Fall 2019- wind
                                                                                   0.86% over the 25-year forecast. The one notable exception
        Spring 2020 - wind
                                                                                   is the ERCOT (Texas) region where load growth, driven by
        Fall 2019- solar PV (single-axis tracking or SAT)
        Spring 2020 - solar PV (single-axis tracking or SAT)                       industrial expansion and population increases, is expected to
                                                                                   be moderate (1.35%) over the period.
The 2020 capital cost estimate for a four-hour, 100 MW lithium-
ion battery storage system is expected to decline by about                         Regionally, the jump in non-hydro renewables, primarily wind
4.5% while efficiency remains the same at 87.4%. With declining                    and solar is significant. Only in the Midwest do we see a marked
capital costs and other operating parameters considered, the                       increase in natural gas generation.
S20 report forecasts battery storage to expand from around 7.9
GW in 2025 to roughly 21 GW in 2040.                                               United States and Canada, operating capacity forecast by
                                                                                   year, by fuel (percentage within region)
Capacity build and generation forecast
Driven primarily by declining cost curves and state, local,
utility, and corporate clean-energy goals, most new capacity
construction (over 60% by 2044) in North America will be
solar and wind. Natural gas, which will continue to dominate
capacity and generation volumes, will account for most of the
rest of the new capacity additions (about 34% by 2044).
Solar capacity is expected to grow more than 4x, from 60 GW
in 2020 to about 250 GW in 2044, with the largest gain in the
Midwest and Western Electricity Coordinating Council (WECC)
regions. Wind is expected to reach 191 GW by 2044; in 2020,
operating wind farms total about 115 GW. Considering the                                                                    (Source: Energy Market Advisors)

decline in coal capacity from about 218 GW operating today
to only 111 GW by 2044, the natural gas fleet is expected to                       Electric Reliability Council of Texas (ERCOT). The fuel mix from
continue to grow, from 499 GW in 2020 to 646 GW in 2044.                           renewables, primarily wind capacity, will grow from about 32%
                                                                                   today to 43% by 2044 – about the same level that natural gas is
Installed generating capacity and demand forecast (GW) -                           expected to contribute (46%).
United States and Canada
                                                                                   Midwest. Over the study period, generating capacity from
                                                                                   renewables will more than double to reach 31% and natural gas
                                                                                   will grow from 42% to 49%.

                                                                                   Northeast. The majority of coal-fueled power plants have
                                                                                   shuttered, and the New York NOx Peaker Rule will result in
                                                                                   closure of up to 650 MW of natural gas and oil burning power
                                                                                   plants by 2025. By 2044, renewable resources are expected to
                                                                                   account for roughly 54% of all operating capacity with natural
                                                                                   gas shrinking to 30%.

                                                (Source: Energy Market Advisors)
                                                                                   Southeast. By 2044, natural gas is expected to expand from
Electricity production has shifted dramatically during the past                    about 51% to 57% while renewables triple in contribution,
decade. As recently as 2010, coal contributed 1,915 terawatt-                      reaching roughly 20% of the capacity portfolio. There are
hours (TWh) accounting for about 44% of all generation. This                       over 12 GW of announced retirements across the Southeast,
year, coal is expected to contribute 646 TWh or about 17% to                       including 9 GW of coal and 2.5 GW of older natural gas units.
the power generation mix.
6 A S U S TA I N A B L E F U T U R E F O R T H E G L O B A L P O W E R I N D U S T R Y
WECC. By 2044, non-hydro renewables will represent about 38% About Energy Market Advisors
of the capacity mix, while natural gas stays level, continuing to Energy Market Advisors (EMA) is part of the Hitachi ABB
represent roughly 39% of generation supply. There are 18 GW of Power Grids Energy Market Intelligence solutions group
announced coal plant capacity expected to retire by 2044. The that provides tools and analysis to support investment
region is expected to build 11.5 GW of battery storage starting decisions. This includes market and transmission modeling,
in 2022, with California accounting for nearly 80% (9 GW) of the price forecasting, regulatory compliance analysis, power
new build out. and gas market trading, operations, and the integration
of new resources.
Conclusion
The long-term impacts of the economic downturn related to Developed using powerful and proven modeling capabilities,
COVID-19 are unknown. While the short- and long-term demand the full North America Power Reference Case provides
impacts will affect the magnitude of future solar, wind, energy an assessment of trends in power, fuels, renewables and
storage and natural gas capacity additions, the economics of environmental markets. Most importantly, the report includes
renewable generation and storage will continue to improve a long-term forecast based on market fundamentals covering
relative to natural gas generation. The gains in battery storage, demand and supply.
solar, wind and natural gas are expected to grow steadily while
coal declines precipitously over the period along with nuclear The forecast is based on data compiled by the widely used
retirements. intelligence service, Velocity Suite, along with modeling from
our proprietary capacity expansion model, and the long-
established PROMOD production cost model.
For more information on Energy Market Advisors,
https://bit.ly/PG-Energy-Market-Advisors.
To purchase the full report, please email us at
info.pges@abb.comNORTH AMERIC A POWER REFERENCE C A SE | SPRING 2020 | SUMMARY
International coverage European highlights
In addition to North America, Energy Markets Group Europe continues to ensure that EU 2030 targets are met in
provides analysis of other regions including Europe and greenhouse gas (GHG) emissions, renewable energy, energy
Japan. Highlights from those regions are shown below. efficiency, reliable energy supply, internal energy market,
research, innovation and competitiveness. Germany is targeting
a complete phase-out of coal by 2038. This represents about
one-third of the coal and lignite plans in Europe. The figure below
highlights some of the countries’ 2030 renewable energy targets.
Europe renewable electricity targets by 2030
(Percent of gross electricity demand)
60-87% (35%)* 85% (68%)
41-55% (33.2%) 25-27% (14%)
∼42% (23%) 65% (43%)
∼78% (37%) 55% (35%)
Source: National Energy and Climate Plans (NECP);
80% (50%) National Grid Future Energy Scenarios (2019), Great Britain
Japan highlights
Japan has multiple energy policy goals. It wants to increase its
energy self-sufficiency ratio from 9.6% in 2017, to over 25% by
2030, while minimizing the impact on electricity rates. This will
be accomplished by a renewable energy target of 24% in 2030,
completing existing and developing new offshore wind farms,
and, if possible, restarting all nuclear reactors. Japan is also For additional detail on international
targeting an emission reduction of 26% of 2013 levels by 2030 markets, please contact us at:
and an emission market is expected to start in 2021. https://software.response.e.abb.com/EPM_Contactus_form
Japan 2019 actual and 2030 targeted energy mix
BIOMAS - 2%
BIOMAS - 4%
GEOTHERMAL - 0% GEOTHERMAL - 1%
WIND - 1%
WIND - 2%
PSH - 0%
PSH - 0%
SOLAR - 7%
SOLAR - 7% COAL - 26%
HYDRO - 9% COAL - 32%
HYDRO - 9%
2030
2019 OIL - 3%
OIL - 5%
Targeted
Energy Mix
Energy Mix
NUCLEAR - 6%
NUCLEAR - 20%
GAS - 27%
GAS - 38%—
Hitachi ABB Power Grids
Energy Markets Group
Market Advisory Services
9AKK107680A7549
Copyright © 2020 Hitachi ABB Power Grids. All rights reserved.
Specifications subject to change without notice.
ABB is a trademark of ABB. Manufactured by Hitachi Ltd under license from ABB Ltd.You can also read


