Application of oxygen enrichment in hot stoves and its potential influences on the energy system at an integrated steel plant
←
→
Page content transcription
If your browser does not render page correctly, please read the page content below
Application of oxygen enrichment in hot stoves and its potential influences
              on the energy system at an integrated steel plant
                  Chuan Wang1,*, Jonny Karlsson2, Lawrence Hooey1,3, Axel Boden1
             1
             Centre for process integration in steelmaking, Swerea MEFOS AB, 971 25 Luleå, Sweden
                                    2
                                      SSAB EMEA, SE-97188 Luleå, Sweden
             3
               University of Oulu, PL 4000, 900014 Oulun Yliopisto, Finland (Adjunct Professor)
     * Corresponding author. Tel: +46 920200223, Fax: +46 920255832, E-mail: chuan.wang@swerea.se

Abstract: The purpose of the presented paper is to investigate oxygen enrichment in hot stoves for an integrated
steel plant. The application of oxygen enrichment in hot stoves will lead to lower coke or PCI rate by increased
blast temperature. With oxygen enrichment, the high calorific value COG, could be saved while keeping the
same blast temperature. Several alternatives of using the saved COG are presented. Furthermore, an analysis of
how oxygen enrichment into hot stoves will have influence on the whole energy system has been carried out by
means of an optimization model. Different strategies have been suggested to minimize the total energy
consumption at the studied steel plant and the nearby CHP plant.

Keywords: Oxygen enrichment, Hot stoves, Blast furnace, Energy system

1. Introduction
In the process of iron-making, hot stoves (HS) are used to preheat air used in the blast furnace
(BF). The preheated air is called hot blast. A higher blast temperature will lead to lower coke
consumption in BF operation, hence, the energy consumption and CO 2 emission from BF will
be reduced. Hot stoves work as counter-current regenerative heat exchangers. Hot stoves
typically use low calorific blast furnace gas (BFG) combined with higher calorific value coke
oven gas (COG). BFG is generated from BF when producing hot metal. COG is a valuable
fuel being high in hydrogen (H 2 ) and methane (CH 4 ). At an integrated steel plant, COG is
often delivered from the coking plant.

Basically, using oxygen enrichment in the air for combustion in the hot stoves offers three
advantages. First, the hot blast temperature may be increased due to higher flame temperature
which reduces the blast furnace reductant consumption. Secondly, the lower volume of flue
gas reduces the loss of sensible heat via the flue gas. Thirdly, COG or other higher value fuels
could be used more effectively elsewhere.

The purpose of this paper is to investigate the application of oxygen enrichment in hot stoves
and its potential influences to the total energy system at an integrated steel plant. This is done
by performing calculations of mass and heat balance for the HS-BF system, and also by
means of an optimization model.

In next section, the HS-BF system is described followed by the description of BF
performance with oxygen enrichment in hot stoves. In section 4, an optimization model has
been applied to present the potential influences on the total energy system of the studied steel
plant and a nearby combined heat and power plant (CHP). Finally, in section 5 concluding
remarks are made based on the presented work including some recommendations.

2. Description of hot stove – blast furnace system
The hot stove often includes two separate parts, a combustion chamber and a check chamber.
They work as a counter-current regenerative heat exchanger. The fuel gas is first combusted

                                                     1537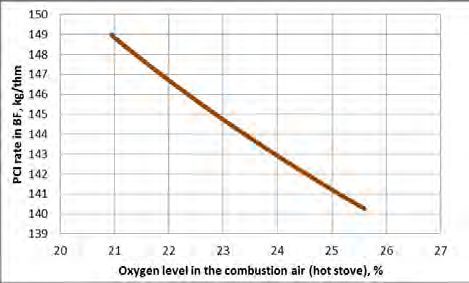
in the combustion chamber. The flue gas passes through the check chamber and heats it up,
then leaves the stack to the ambient. This progress is often called on-gas time. When the
check chamber is fully heated up during on-gas time, the blast time is started. During the blast
time, the cold blast is blown into the system in opposite cycle and is heated by the check
chamber. It then passes through the combustion chamber. Before blowing into the blast
furnace, it is often mixed with cold blast to get the required and stable hot blast temperature.
BFG is a process gas with low calorific value. It has to be blended with COG to get a higher
calorific value before entering the combustion chamber. After blending, the average heating
value is around 4.3 MJ/Nm3.

Traditionally the combustion air is used in hot stoves for fuel combustion. For the studied
plant, the hot blast produced is 254 kNm3 per hour with a temperature of 1104 °C, which is
required by the blast furnace to produce hot metal with a production rate of 275 tonnes per
hour during the reference period.

The combustion air can be enriched with gaseous oxygen, oxygen enrichment. Compared to
traditional combustion, less N 2 will be generated which will absorb less reaction heat from
combustion. This will lead to a higher adiabatic flame temperature (AFT) with the same
amount of fuel gas. As for the hot stove, therefore, a higher blast temperature can be achieved.
On the other hand, the low caloric value fuel gas can also be combusted alone without mixing
with any enrichment gas to get the same flame temperature with the use of oxygen enrichment
instead. The common enrichment gases used at hot stoves are, for example COG, LPG or NG.

3. BF performance with oxygen enrichment in hot stoves
In the studied steel plant, the hot stoves are fuelled with BFG together with some amounts of
COG. The calculations for oxygen enrichment in HS-BF system were carried out by using a
spreadsheet model [1].

                          310
                          309
                          308
Coke rate in BF, kg/thm

                          307
                          306
                          305
                          304
                          303
                          302
                          301
                          300
                          299
                                20   21       22        23        24        25        26   27
                                      Oxygen level in the combustion air (hot stove), %

Fig. 1. The correlation between oxygen level in the air and coke rate (left) and PCI rate (right) in BF.

3.1. Increased blast temperature with oxygen enrichment
For the studied hot stoves, the hot blast temperature is assumed to increase to 1200 °C with
the enriched oxygen in the combustion air. A higher hot blast temperature will lead to a lower
reductant in the blast furnace. In the studied BF blast furnace, coke is used as reductant and
charged from the top with other burden materials such as iron ore pellet and fluxes. Besides
coke, pulverized coal (PCI) is also injection into BF via tuyers as fuel and reductant.
Therefore, it’s interesting to study the potential coke and PCI saving due to a higher hot blast
temperature. Fig. 1 presents potential coke and PCI saving with enriched oxygen in the

                                                                                                1538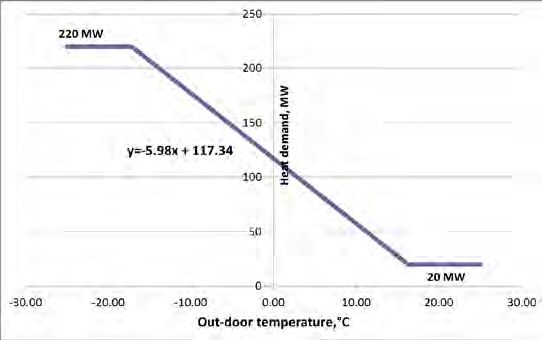
combustion air, which corresponds to 9.01 kg coke or 9.15 kg PCI with per ton hot metal per
increased 100 °C blast temperature, respectively.

3.2. COG saved with oxygen enrichment
At a fixed blast temperature, increased oxygen level in the combustion air will lead to
decreased COG flow in hot stoves, while BFG flow rate has to increase to provide enough
energy, as shown in Fig.2. The high caloric value COG can be saved and used for other
purpose.

                        12                                                                                  160
                                                                                                            140
                        10
                                                                                                            120
 COG into HS, knm3/hr

                                                                              BFG into HS, knm3/hr
                         8
                                                                                                            100
                         6                                                                                   80
                                                                                                             60
                         4
                                                                                                             40
                         2
                                                                                                             20
                         0                                                                                    0
                             20   25              30                35   40                                       20   25              30                35   40
                                       Oxygen level in the air, %                                                           Oxygen level in the air, %

Fig.2. The correlation between oxygen level in the combustion air and COG (left) and BFG (right)
flow in the hot stoves.

Previous studies showed that a lower reducant in BF could be achieved by injecting COG
through tuyers [1-3]. Fig.3 shows the potential coke or PCI saving if saved COG in hot stoves
instead is injected into BF via tuyers.

                                                                                                            150

                                                                                                            148
                                                                              PCI rate via tuyers, kg/thm

                                                                                                            146

                                                                                                            144

                                                                                                            142

                                                                                                            140

                                                                                                            138
                                                                                                                  20   25              30                35   40
                                                                                                                            Oxygen level in the air, %

Fig.3. The correlation between oxygen level in the combustion air and coke and PCI rate in BF.

Table 1 gives a summary of key parameters for all scenarios discussed above. It’s been
noticed that a higher amount of BFG could be generated when COG is injected into BF via
tuyers. At the same time, this will also lead to a higher heating value of BFG.

For the studied steel plant, there is another scenario to utilize the saved COG from the hot
stove. That is to use it at the nearby combined heat and power (CHP) plant, which
corresponds to Scenario 4 in Table 1. This will be presented in Section 4.

                                                                          1539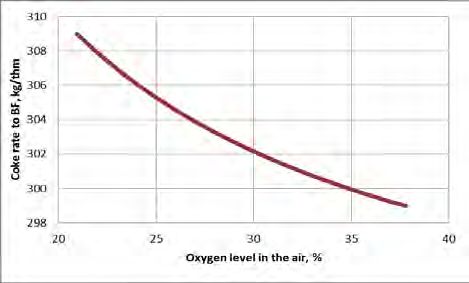
Table 1. Key parameters in hot stove – blast furnace system for different scenarios.
Unit Ref. case Fixed COG_coke saving Fixed COG_PCI saving Fixed BLT_to PP Fixed BLT_coke saving Fixed BLT_PCI saving
Scenarios Scenario 1 Scenario 2 Scenario 3 Scenario 4 Scenario 5 Scenario 6
Coke kg/thm 309.0 300.4 309.0 309.0 299.0 309.0
PCI kg/thm 149.0 149.0 140.3 149.0 149.0 138.9
COG to BF via tuyers MJ/thm 0.0 0.0 0.0 0.0 642.6 642.6
BFG generated knm3/thm 1.47 1.43 1.43 1.47 1.51 1.50
Heating value MJ/Nm3 2.97 2.97 2.96 2.97 3.08 3.07
Blast generated Nm3/thm 924.2 886.5 885.5 924.2 917.7 916.4
Blast temperature °C 1104 1200 1200 1104 1104 1104
BFG consumed in HS nm3/thm 332.9 358.2 358.6 332.9 524.7 525.5
COG consumed in HS MJ/thm 642.6 642.6 642.6 0 0 0
3
O2 in combustion air Nm /thm 0 14.8 15.0 39.0 32.8 33.1
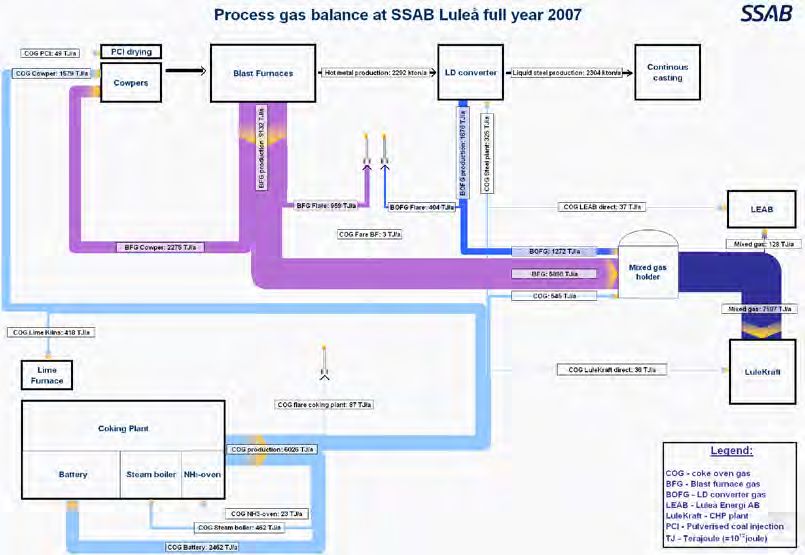
4. System analysis of the energy system in the studied steel plant
The studied integrated steel plant consists of the following main process units: coking plant
(CP) blast furnace (BF) basic oxygen plant (BOF) secondary metallurgy (SM)
continuous casting (CC). The final product is slab from CC. In addition, there are also some
other process units, a lime kiln for lime production, an oxygen plant and a combined heat and
power plant (CHP). All these process units are connected through material flows and a
process gases network. Besides COG and BFG, there is also recovered process gas from the
BOF, called basic oxygen furnace gas (BOFG). Fig. 4 shows the structure of the process gas
network
Fig. 4. The structure of process gas network at the studied plant
An optimization model has been applied to analyze the energy system in the studied steel
plant. More details about the model can be read in previous publications [4-5]. The objective
function set in the model is to minimize energy consumption for the total steel plant. There
are two driving forces to run the model. The first is to produce the final product slabs, at 263
ton/hour as a year average. The second is to produce hot water at the CHP plant to the district
heat network used by the nearby city. The CHP plant also produces electricity which is used
at different process units within the plant. Therefore, it also provides electricity for oxygen
1540
production at the oxygen plant. When there is excess electricity generated from the CHP
plant, the extra electricity is sold externally to the grid.

Before entering the CHP plant, the process gases of BFG, COG and BOFG are blended in the
mix gas holder to get the required heating value and a stable gas flow before entering the
boiler. Oil is used when heat load is higher or when there is lack of mixed gases. The
electricity can be generated from the steam turbine by two different modules, a back pressure
module and a condenser module, mainly depending on the heat demand from the district heat
network. The alpha value of the back pressure module is 0.44 (α = P el /P heat) ), and the
electricity efficiency of the condenser module is 0.32. The boiler efficiency, η , is 0.9. In the
model, the maximum fuel limitation for the boiler is 350MW, which is set by the regulation to
control emissions, e.g. NO x , SO x and CO 2 . The other limitation set for the boiler is the
maximum flow rate of process gas, 90 Nm3/s.

Fig. 5 illustrates the heat demand curve versus the out-door temperature. As shown in the
figure, the maximum heat supply from the CHP plant is 220 MW, and the minimum heat
supply is 20 MW. When the out-door temperature varies in the internal of [-18;16] °C, the
heat demand curve can be linearized.

Fig.5.The correlation between out-door temperature and heat demand in the district heat network.

The optimization model is based on hourly data with a time span of one full year for the
reference period. For example, the average heat demand is 85.7 MW, corresponding to an
average out-door temperature of 5.3 °C. However, to illustrate how heat demand changes will
have influence on the process gas network, the average value cannot be used because it varies
with the seasonal out-door temperature especially in the Nordic region. Therefore, in this
presented work 5 different values of heat demand are chosen: 20, 70, 120, 170 and 220MW
respectively.
The model is set to run for the reference case and the optimized case to minimize the energy
use for the total energy system. The energy content of the used energy carriers are presented
in Table 2.

For the reference case, the model is run based on the operational data during the reference
period to simulate for different heat demand levels. For the optimized case, the model will
choose one scenario and combined scenarios listed in Table 1 (Scenario 1-6). Compared to
the reference case, more freedoms are given in coal blending in the coke plant in the

                                               1541
optimized case. Stable production is assumed, meaning there are no variations in each process
unit, except for the CHP plant.

Table 2. Key parameters in hot stoves, GJ/ton.
Energy carrier                        Value             Energy carrier                  Value
TCMT petcoke coal                     35.9              Bachatsky PCI coal               28.7
Peak downs coal                       29.6              El Cerrejon PCI coal             27.0
Riverside coal                        29.3              External coke                    40.9
Massey powellton coal                 30.2              PCI                              28.2
Rocklick Eagle coal                   30.4              Oil, GJ/MWh                       3.6
Gonyella coal                         29.2              Electricity, GJ/MWh               3.6
Gusare PCI coal                       28.2              Flaring, GJ/unit                  1.0

Fig. 6 shows the specific energy consumption (SEC) both for the reference and the optimized
case. It indicates that a lower SEC will always be achieved in the optimized case. It’s been
found that BF behaviors in the optimized case are changing when heat demand is increasing
at the CHP plant. The model prefers oxygen enrichment for COG saving to get the fixed BLT
the same as the reference into BF. However, the way to use the saved COG varies between
the scenarios of injecting into BF for coke saving (Scenario 5) and delivering to the CHP
plant (Scenario 4) to avoid oil consumption in boiler. As indicated in Fig. 8 (right), before the
heat demand is increased to 153.3 MW which corresponds to an out-door temperature of -
6°C, BF will always be operated as Scenario 5. Scenario 4 starts when heat demand is greater
than 153.3 MW. The percentage of Scenario 4 operation increases to 100% when the heat
demand rises to 183.8 MW, meanwhile, operating of Scenario 5 decrease from 100% to 0%.
The model will keep running Scenario 4 when heat demand is higher than 183.8 MW to get
the minimum energy consumption.

The comparison between reference case and optimized case at a same level of heat demand
may explain why minimum energy consumption could be achieved for the model. The
following factors contribute for this. First in the coke plant, the coal blending is changed. In
principle, the types of coal chosen are with lower volatile energy content. Lower volatile
content coal will lead to a higher coke production rate, which will also lead to a lower amount
of coking coal required in the coke batteries to produce the same amount of coke as the
reference case. Thus, the energy consumption from the coke plant could keep as low as
possible. Lower volatile type coal will generate less COG, consequently there will less COG
to the CHP plant. However, this will compensate when saved COG from hot stoves instead is
injected into BF to have a lower coke rate in BF. This has been proved when comparing the
purchased coke amount between reference case and optimized case for example at the heat
demand level of 20 MW. This solution will be kept the same until the heat demand is up to
153.3 MW at which point the model has to adopt a strategy of mixing Scenario 5 and
Scenario 4 with a varying weighting ratio in order to keep the minimum energy consumption
for the total energy system. At the point of 183.8 MW, the solution is completely switched to
100% of Scenario 4 because at such a high level heat demand it is more energy effective to
use the saved COG in the CHP plant instead of injecting into BF and by that avoiding use of
oil at the CHP plant. However, some amount of oil has to be used even in the optimized case
when the heat demand is over 185.7 MW.

                                                 1542
190
23.0 Reference case
185
22.5 Optimised case
180
Specific energy, GJ/t slag
22.0
Heat demad, MW
175
21.5
21.0 170
20.5 165
20.0 160
19.5 155
19.0
150
18.5 0 20 40 60 80 100
20 70 120 170 220
BF COG saved for BF injection or Power Plant, % PP
District heat demand, MW
Fig.6. Left: Comparison of SEC between reference case and optimized case;
Right: BF behavior in the optimized case.
Fig. 7 illustrates the comparison of heat supply from the CHP between the reference case and
the optimized case. It is found that oil will be replaced by COG in the optimized case at a high
levels of heat demand. However, some amount of oil is still needed when the out-door
temperature is lower than -11 °C.
COG BFG COG BFG
400 400
BOFG Oil BOFG Oil
350 350
300 300
Heat supply, MW
Heat supply, MW
250 250
200 200
150 150
100 100
50 50
0 0
20 70 120 170 220 20 70 120 170 220
Heat demand, MW Heat demand, MW
Fig.7. Left: Heat supply in the reference case; Right: Heat supply in the optimized case.
5. Concluding remarks
The presented work shows that the application of oxygen enrichment into hot stoves could
lead to a lower coke or PCI rate in BF if the blast temperature is allowed to increase. High
calorific value COG can also be saved by use of oxygen enrichment. Therefore, it is possible
to use the saved COG in other process units. For the studied steel plant, the alternatives are,
for example, inject COG into BF via tuyers or deliver it to the nearby CHP plant for district
heat and electricity production. There are also other alternatives to use COG, such as at the
reheating furnace in the rolling mill, or in the electric arc furnaces (EAF) to replace other
fuels such as natural gas, LPG or oil. However, this depends on the site specific and is not
applicable on the studied site.
An analysis of how oxygen enrichment into hot stoves will influence the total energy system
has been carried out by means of an optimization model. Different strategies have been
suggested from the model to achieve the minimum energy consumption for the studied steel
plant and the nearby CHP plant.
The optimization made for the studied plant is to minimize the energy consumption for the
total energy system. However, it does not mean that optimal solutions also are cost effective,
which in fact is interesting to study.
In the current model, the availability of process gases and their flaring are set at a fixed value,
based on hourly average value with a yearly time span. In addition, each process unit is
assumed operating continuously and steadily. However, in reality there is normal varations.
1543Therefore, it might be of importance to take these factors into account for energy system
optimization.
As for the CHP plant, only a few heat demand corresponding to a few out-door temperatures,
are included in this optimization work. The performance of CHP plant, such as heat loads
curve, is therefore limited. Solution space based optimization can provide a better resolution
for the studied energy system [6].
The HS-BF system is a very important part in the optimization model, and it’s also the most
complicated process unit in an integrated steel plant with the BF-BOF route. The mass and
energy balance for HS-BF system are first carried out in a spreadsheet, key operating
parameters generated from the spreadsheet then put into the HS-BF sub-model of the
optimization model. Different operating conditions generate a list of key operating parameters
as input to the model. Thus, the optimal solution from this sub-model can either be one case
or a mixed case. This, however, may lead to less dynamic. For instance, the model only shows
the oxygen amount into hot stoves at which COG will be fully substituted by BFG. What
happen in between oxygen enrichment starting and maximum level cannot be predicted in
model. Therefore, it could not show the results if the optimum level of oxygen enrichment is
in between when modeling the total energy system although it may not be the case. Further
model improvement in HS-BF system is needed towards a dynamic response.
Acknowledgements
We would like to thank the Centre for Process Integration in Steelmaking (PRISMA) and
SSAB EMEA for the possibility to present this work. PRISMA is an Institute Excellence
Centre supported by the Swedish Agency for Innovation Systems, the Knowledge
Foundation, and eight industrial partners within the iron- and steel industry.
References
[1] P. Hooey, A. Boden, C. Wang, C. Grip and B. Jansson. Design and application of a
spreadsheet-based model of the blast furnace factory, ISIJ International 50(7), 2010, pp.
924-930.
[2] A. Babich, S. Yaroshevskii, A. Formoso, A. Cores, L. Garcia and V. Nozdrachev. Co-
injection of Noncoking Coal and Natural Gas in Blast furnace. ISIJ International 39 (3),
1999, pp. 229-238.
[3] J.C. Agarwal, F.C.Brown, D.L. Chin and G.S. Stevens, Results of Ultra High Rates of
Natural Gas Injection into the Blast Furnace at Acme Steel Company, ISCTI/Ironmaking
Conference Proceedings 57, 1998, 443-461.
[4] M. Larsson and J. Dahl, Reduction of the specific energy use in an integrated steel plant –
the effect of an optimization model, ISIJ International 43, 2003, pp. 1664-1673.
[5] C. Wang, C. Ryman, Larsson M, Wikström J-O and Grip C-E. A model on CO 2 emission
reduction in integrated steelmaking by optimization methods. International Journal of
Energy Research 32, 2008, pp.1092-1106.
[6] J. Sandberg, M. Larsson, C. Wang, S. Lahti and J. Dahl. Solution space based
optimization for increased resolution in energy system modeling, 2010, Manuscript to be
submitted.
1544You can also read