Future Energy Scenarios in five minutes
←
→
Page content transcription
If your browser does not render page correctly, please read the page content below
Future Energy
   Scenarios in
   five minutes
   System Operator

JULY 2018

Welcome to our Future Energy Scenarios

These scenarios, which stimulate debate and help
inform the decisions that will shape our energy future,
have never been more important – especially when
you consider the extent to which the energy landscape
is being transformed.

             Factors include ambitious                 We’ve refreshed our scenario
             environmental policy and legislation,     framework to reflect the increasing
             a dramatic growth in local generation,    importance of decentralisation and
             and the development of technologies       decarbonisation in our industry.
             that are allowing consumers to            We’ve also included, for the first
             break away from the more traditional      time, the early results from our
             models of energy supply.                  project to cost the scenarios. Our
                                                       key messages highlight the insights
             The pace of change was starkly            from the scenarios and act as a call
             highlighted this year when Britain        to action. They will help the industry
             had three consecutive days free           to focus on how we could efficiently
             of coal-fired power generation.           transition to a low carbon economy.
             And solar generation continues
             to set new records.                       Another development is happening
                                                       within our own business. National
             Against this backdrop, it’s impossible    Grid’s Electricity System Operator
             to accurately forecast a single energy    (ESO) will separate from our
             future over the long term. However,       electricity transmission business in
             creating a range of credible futures      April 2019. Although the ESO will
             allows us to continue supporting the      soon start to look and feel different,
             development of an energy system that’s    our Future Energy Scenarios will
             robust against different outcomes.        remain a whole system publication.
                                                       It will also play an important role
             And it’s not just based on our own        for the RIIO-2 process, providing
             input – we’ve gathered the views of       valuable analysis and insight.
             430 organisations through meetings,
             workshops, webinars and our               Of course, this publication is only
             conference, so we could learn more        the start of our work. Our expert
             about what our stakeholders thought       analysts will be working on what
             the future of energy could look like.     the scenarios mean for network
                                                       development, system operability
             Our new scenarios highlight some          and security of supply. Their findings
             important themes and future               will appear in our other System
             developments. For example, gas            Operator publications.
             will remain crucial for both heating
             and electricity generation in all         Thank you for your valuable insight
             scenarios for the coming decades.         over the past year. Please continue
             There will be a significant increase      to share your views with us. Details
             in electricity infrastructure, from new   about how to contact us are on our
             renewable generation to electric          website: fes.nationalgrid.com.
             vehicle charging networks. And the
             decarbonisation of heating will be        Fintan Slye
             challenging, with multiple ways to        Director, UK System Operator
             achieve it – requiring both electricity
             and different types of gas.

July 2018                                                                                    01
What are the Future Energy
Scenarios (FES)?

Our scenarios outline different credible pathways for the
future of energy for the next 30 years and beyond. These
consider how much energy we might need and where
it could come from. They look at what the changes might
mean for the industry, our customers and consumers.

Why do we create them?
We use the scenarios for planning
how we develop and operate the gas
and electricity systems and for other
key activities like charging projections.
Our scenarios are also used widely
across the energy industry and beyond,
driving debate and decision-making.         FES is the product
                                            of in-depth analysis
How do we create them?                      informed by industry
FES is the product of in-depth analysis     experts and National
by our team of experienced analysts.        Grid’s own insights.
Stakeholder feedback is fundamental
to the development of these scenarios.
Combining the expertise of industry
specialists with our own insights
gives us the depth of knowledge we
need to produce scenarios that are
independent, well informed and
up-to-date.

Future Energy Scenarios in five minutes                           02
Scenario overview

We have created a new framework for our 2018 scenarios.
It retains a 2 x 2 matrix with four scenarios but these are
now aligned to axes of ‘speed of decarbonisation’ and
‘level of decentralisation’.

The speed of decarbonisation axis is driven                               Two Degrees, meet the UK’s 2050 carbon
by policy, economics and consumer attitudes.                              reduction target. The table below shows
The level of decentralisation axis shows how                              some of the key characteristics of the four
close the production and management of                                    scenarios. It is a selective summary for
energy is to the end consumer. Two scenarios,                             illustrative purposes and the full details
Community Renewables and                                                  can be found in the main FES document.

                               2050 carbon reduction target is not met        2050 carbon reduction target is met
                            Consumer Evolution                              Community Renewables
                            Electricity Moderate-high demand: high          Electricity Highest demand: high for
                            demand for electric vehicles (EVs) and          demand EVs, high for heating and good
                                        moderate efficiency gains                       efficiency gains
                            Transport Most cars are EVs by 2040;            Transport Most cars are EVs by 2033;
                                        some gas used in commercial                     greatest use of gas in commercial
                                        vehicles                                        vehicles but superseded from
                            Heat        Gas boilers dominate; moderate                  mid 2040s by hydrogen
                                        levels of thermal efficiency                    (from electrolysis)
                            Electricity Small scale renewables and          Heat        Heat pumps dominate; high
                            supply      gas; small modular reactors                     levels of thermal efficiency
                                        from 2030s                          Electricity Highest solar and onshore wind
Level of decentralisation

                            Gas         Highest shale gas, developing       supply
                            supply      strongly from 2020s                 Gas         Highest green gas development
                                                                            supply      from 2030s

                            Steady Progression                              Two Degrees
                            Electricity Moderate-high demand:               Electricity Lowest demand: high for
                            demand high for EVs and moderate                demand EVs, low for heating and
                                        efficiency gains                                good efficiency gains
                            Transport Most cars are EVs by 2040;            Transport Most cars are EVs by 2033; high
                                        some gas used in commercial                     level of gas used for commercial
                                        vehicles                                        vehicles but superseded from
                                                                                        mid 2040s by hydrogen
                            Heat        Gas boilers dominate; moderate
                                        levels of thermal efficiency        Heat        Hydrogen from steam methane
                                                                                        reforming from 2030s, and
                            Electricity Offshore wind, nuclear and gas;                 some district heat; high levels
                            supply      carbon capture utilisation and                  of thermal efficiency
                                        storage (CCUS) gas generation
                                        from late 2030s                     Electricity Offshore wind, nuclear, large scale
                                                                            supply      storage and interconnectors;
                            Gas         UK Continental Shelf still                      CCUS gas generation from 2030
                            supply      producing in 2050; some
                                        shale gas                           Gas         Some green gas, incl.
                                                                            supply      biomethane and BioSNG;
                                                                                        highest import dependency

                                                          Speed of decarbonisation

July 2018                                                                                                              03
Key messages

1.	We are entering a new world of energy.
   The expected growth of low carbon and
   decentralised generation means the
   electricity system will need to change.

What this means
•	The market will need              •	Balancing security of
  to adapt to the changing                supply, affordability
  plant mix. Key industry                 and efficiency in a           Increase in capacity
  processes are likely to                 decarbonised world            from 103 GW today
  need reviewing, bringing                presents new challenges.      to between 189 GW
  with them opportunities                 We will work with industry,
  for new services.                                                     and 268 GW by 2050.
                                          Ofgem and the Government
                                          to meet these challenges
                                          to deliver a reliable,
                                          efficient and operable
                                          low carbon system.

                                                                        Up to   65%
                                                                        Percentage of
                                                                        generation capacity
                                                                        which could be
                                                                        local by 2050.

Future Energy Scenarios in five minutes                                                       04
Key messages

2.	Electric vehicle growth goes hand in hand
   with electricity decarbonisation. Smart charging
   and vehicle-to-grid can actively support the
   decarbonisation of electricity.

What this means
•	Balancing demand and      •	This presents opportunities
  supply and power flows       for developers and suppliers,
  will become increasingly     but data and information
  complex and need a           flows will become               Electricity demand
  coordinated approach         increasingly critical.          is expected to
  across the whole industry.                                   grow significantly
                                                               by 2050.

                                                               36m
                                                               Potential number
                                                               of electric vehicles
                                                               (EVs) by 2040.

July 2018                                                                            05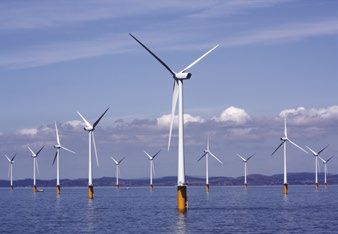
Key messages

3.	Action on heat is essential and needs
   to gather pace in the 2020s to meet carbon
   reduction targets. A mix of low carbon
   heating solutions and better thermal
   efficiency of buildings is needed.

What this means
•	Decarbonising heat is              •	Development of hydrogen     There are different ways
  crucial but needs to                     and the rollout of heat   to decarbonise heating.
  address significant                      pumps need to be
  technical and commercial                 driven by clear policy
  challenges. A balance of
  technologies is needed to
                                           and supportive market
                                           arrangements.             Up to   60%
                                                                     of homes could be using
  meet the heat challenge.
                                                                     heat pumps by 2050.

                                                                     Or hydrogen could heat

                                                                     one third
                                                                     of homes by 2050.

Future Energy Scenarios in five minutes                                                      06
Key messages

4.	Gas will play a role in providing reliable,
   flexible energy supplies for the foreseeable
   future. New technologies and sources of
   low carbon gas can decarbonise the whole
   energy sector.

What this means
•	Gas networks and        •	The development of
                                                          Gas
  markets will need to       hydrogen and carbon
  adapt to accommodate       capture utilisation
  changing gas flows and     and storage (CCUS)           continues to provide
  reduced annual demand      needs innovation and         more energy
  with more pronounced       demonstration projects
  winter peaks.              to help overcome the
                                                          than electricity
                             technical, commercial        by 2050 in three of
                                                          our four scenarios.
                             and implementation
                             challenges and to enable
                             commercial rollout of
                             CCUS and hydrogen
                             in the 2030s.

                                                        Gas usage patterns
                                                        are changing,
                                                        providing flexibility
                                                        for heat and generation.

July 2018                                                                         07
Key comparison chart

                                                                                                                                        Community         Two          Steady            Consumer
                                                                                                                                        Renewables        Degrees      Progression       Evolution

                                                       2017 2020 2021 2022 2023 2024 2025 2026 2027 2028   2029 2030 2031 2032 2033 2034 2035 2036 2037 2038 2039 2040 >2040   Maximum potential
                                                                                                                                                                                    by 2050

                                 Exceeds 2 million
                                 electric vehicles     95k
                                                                                                                                                                                     38.5m

                                 Exceeds 1 GW
Transport                        of vehicle-to-grid    N/A
                                 capacity                                                                                                                                            20.6 GW

                                 Reaches
                                 50,000 natural         3k
                                 gas vehicles                                                                                                                                         243k

                                 10% of homes
Heating                          using low             2%
                                 carbon heating                                                                                                                                       84%

                                 25% electricity
                                 output from         17%
                                 distributed sources                                                                                                                                  43%
                                 Hits 60%
Electricity                      renewable
generation                                             26%
                                 generation
                                 output                                                                                                                                               76%
                                 Carbon intensity 266g
                                 of electricity
                                 generation below CO2
                                 100g CO2/kWh     kWh                                                                                                                            20g CO2/kWh

Electricity                      Exceeds 6 GW          2.9
storage                          electricity storage   GW
                                 technologies                                                                                                                                        28.8 GW

Electricity                      10 GW of               4
interconnection                  electricity import    GW
                                 capacity                                                                                                                                            19.8 GW
                                 10% of supplies
Gas                              from onshore
supplies                         production (shale     0.3%
                                 and green gas)                                                                                                                                       54%

                                                       2017 2020 2021 2022 2023 2024 2025 2026 2027 2028   2029 2030 2031 2032 2033 2034 2035 2036 2037 2038 2039 2040 >2040

Future Energy Scenarios in five minutes                                                     08                     July 2018                                                                     09
Decarbonisation
Two of our four scenarios, Two Degrees and
Community Renewables, meet the 2050 carbon
reduction target but in different ways.
Community Renewables shows a
more decentralised approach. In this world,
factors like the large growth of renewables,
supported by storage and smart appliances,
enable a large reduction in the carbon
intensity of electricity. Transport is almost
completely decarbonised, thanks to a very
high number of EVs and some vehicles
that use hydrogen created by electrolysis
using excess renewable power. Significant
progress is made in the decarbonisation
of heat due to factors such as the improved
thermal efficiency of homes and the rollout
of electric and hybrid (gas and electric)
heat pumps.
2022: All unabated 2024: Half of EV owners Mid 2030s: Growth in 2050: Carbon intensity
coal power stations use smart charging for production of hydrogen of electricity falls to
cease to generate. their vehicles. from electrolysis. 32g CO2/kWh.
2031: 30% of 2040: Government ban
2020: 136,000 households have on sale of conventional
600 residential heat smart wet appliances. 2038: 33m vehicles achieved.
pumps installed. EVs on the
Carbon dioxide equivalent (Mt)
2030: Over 70% road. 2046: 10 bcm of green
of homes meet gas being produced.
500
class C efficiency
standard or higher.
2041: 12 million
400 2036: 50 GW of solar residential heat
generation installed. pumps installed.
300
200
100
0
2015 2020 2025 2030 2035 2040 2045 2050
Year
Electricity Heat Road transport Other (inc aviation & shipping)
Future Energy Scenarios in five minutes 10Decarbonisation
Two Degrees meets the 2050 carbon
reduction target through a more centralised
approach. In this world, factors like large
growth of renewables, nuclear and gas-fired
generation using carbon capture utilisation
and storage (CCUS) bring about a very
large reduction in the carbon intensity of
electricity. Transport is almost completely
decarbonised, thanks to a very high
number of EVs, and some vehicles that
use hydrogen created by steam methane
reforming paired with CCUS. Significant
progress is made in the decarbonisation
of heat due to factors such as the improved
thermal efficiency of homes and the rollout
of low carbon district heating and hydrogen
networks for heating in a number of
city regions.
2022: 10 GW 2026: First new nuclear 2035: 2 million 2050: Carbon intensity
of electricity plant complete. homes on district of electricity falls to
interconnection. heat schemes. 20g CO2/kWh.
2026: A third of EV
owners use smart
600 charging for their vehicles. 2041: More than
2030: CCUS starts to 2038: 33m 100,000 hydrogen
fuel cell vehicles.
Carbon dioxide equivalent (Mt)
be used to produce EVs on
500 electricity and hydrogen. the road.
2030: Over 70%
of homes meet
400 class C efficiency 2045: 8 million
standard or higher. buildings heated
by hydrogen.
300
200
100
0
2015 2020 2025 2030 2035 2040 2045 2050
Year
Electricity Heat Road transport Other (inc aviation & shipping)
July 2018 11Decentralisation
In all our scenarios, the level of decentralised energy
increases. In terms of electricity supply, there is a
significant increase in smaller scale generators, such as
solar and wind turbines, which are not connected directly
to the transmission network. Decentralised gas supplies
will increase from a low base in all the scenarios. On the
demand side, data exchange technologies and business
models are developing and these allow consumers to
move away from traditional models of energy trading.
The figure below illustrates changes
in electricity generation capacity.
In the decentralised scenarios,
Community Renewables and
Consumer Evolution, there are
more small scale electricity generators.
Consumer Evolution Consumer Evolution Community Renewables Community Renewables
300 300 300
Location of electricity capacity/
Location of electricity capacity/
Location of electricity capacity/
250 250 250
peak demand (GW)
peak demand (GW)
peak demand (GW)
15% 31% 15%
200 200 200
6% 6%
150 15% 15% 150 150
34%
36% 36% 30% 30%
31% 100 31% 100 100
50 50 50
63% 49% 63% 49% 55% 35% 55%
0 0 0
0 2025 2030 2035 2040
2015 2045
2020 2050
2025 2030 2035 2040 2045 2050 2015 2020 2025 2030 2035 2040
2015 2045
2020 2050
2025 2030 2035 2
Steady Progression Steady Progression Two Degrees Two Degrees
300 300 300
Location of electricity capacity/
Location of electricity capacity/
Location of electricity capacity/
250 250 250
peak demand (GW)
peak demand (GW)
peak demand (GW)
5% 5%
200 200 200 17%
6% 6%
14% 14%
150 150 150 28%
23% 23% 26% 26%
22% 22%
100 100 100
50 63% 63% 50 50 56%
72% 72% 69% 69%
0 0 0
0 2025 2030 2035 2040
2015 2045
2020 2050
2025 2030 2035 2040 2045 2050 2015 2020 2025 2030 2035 2040
2015 2045
2020 2050
2025 2030 2035 2
Distributed Micro Transmission
Peak demand Distributed Micro Peak demand
Future Energy Scenarios in five minutes 12Energy demand overview
The current annual demand for gas in GB is 810 TWh and
for electricity 297 TWh. In all our scenarios, the total energy
demand reduces by 2050. A major component is the decline
in the use of gas for electricity generation, although gas
continues to provide the majority of energy in all but one
of the scenarios by 2050. In the more centralised scenarios,
the use of CCUS leads to an increase in gas use from
the 2030s.
The demand for electricity increases in all We have included production of hydrogen
our scenarios. This is brought about mainly in our models this year. Hydrogen can
by the increase in EVs and the resulting be used as a fuel, for example for heating
demand will become one of the dominant or transport, and as a flexible resource
features in the overall energy demand mix. to store excess renewable electricity.
However, opportunities exist to harness the
battery storage ability of EVs and supply
electricity back to the system to support
the rollout of renewables.
GW
In Two Degrees Steady Progression
Peak electricity hydrogen could provide sees the highest
demand reaches 265 TWh annual gas demand at
83 GW by 2050 in of energy annually 638 TWh
Community
Renewables
(59 GW in 2017)
by 2050 in 2050
(0 TWh in 2017) (810 TWh in 2017)
July 2018 13Gas supply overview
Gas continues to be an important fuel for the whole
energy system, although total supply is falling in all
scenarios. This reflects lower gas demand but, as
sources of gas change, we will still need to manage
a wide range of gas supply patterns.
green gas
makes up 39%
of total GB gas demand in
Community Renewables
in 2050
(Electricity supply overview
Local and low carbon generation is becoming an
increasing feature of electricity supply in GB. While
subsidy support for most renewable generation is
now reducing, growth will continue at pace for most
low carbon technologies.
Decentralised generation reaches
65% of overall
generation capacity
This is thanks to factors such as
continued reductions in cost, technology
developments and co-location with storage in Community Renewables
allowing access to new revenue streams. (27% in 2017)
Consequently, there is high growth
of electricity storage in all scenarios, In all scenarios, thermal plant will
particularly in the more decarbonised increasingly be reliant on providing flexibility
ones, where storage is increasingly and key network services to remain
important in balancing renewable output. economic. However, particularly in the
less decarbonised scenarios, gas will
Electricity interconnector capacity increases also provide some baseload power.
in all scenarios. From 2030, particularly
in the more decarbonised scenarios,
we anticipate times where there may be
43 GW
an excess of electricity. This is because
electricity output from inflexible and
intermittent generation will outstrip demand Amount of offshore
and at times it will not be possible to export wind capacity by
this electricity, as connected markets will 2050 in Two Degrees
have the same excess as GB. Market (6 GW in 2017)
development, new technologies and new
ways of designing and operating networks
will be needed to address the operational
challenges that arise as a result.
66 GW
Amount of solar
capacity by 2050
in Community
Renewables
(12 GW in 2017)
July 2018 15Key statistics in 2030 and 2050
2017 2030
CR TD SP CE
Electricity
Annual demand (TWh)* 297 302 293 304 308
Peak demand (GW) 59 62 64 62 64
Total installed capacity (GW) 103 158 161 134 131
Low carbon and renewable
capacity (GW) 47 99 100 70 70
Interconnector capacity (GW) 4 17 20 15 10
Total storage capacity (GW)** 3 10 10 6 7
Vehicle-to-grid total capacity (GW) 0 1.1 1.0 0.2 0.2
2017 2030
Gas CR TD SP CE
Annual demand (TWh) 810 487 506 671 700
1-in-20 peak demand (GWh/day) 5,522 3,925 4,013 5,083 5,068
Residential demand (TWh) 332 239 244 310 302
Gas imports (%) 51% 81% 69% 57% 51%
Shale production (bcm/yr) 0 0 0 10 22
Hydrogen production (TWh) 0 1 3 0 0
Green gas production (bcm/yr) 0.3 2 1.3 0.3 0.8
*Excludes losses
**Includes vehicle-to-grid
Future Energy Scenarios in five minutes 16Key statistics in 2030 and 2050
2050
CR TD SP CE
Electricity
441 373 386 392 Annual demand (TWh)*
83 79 87 87 Peak demand (GW)
268 224 189 199 Total installed capacity (GW)
Low carbon and renewable
178 160 110 116 capacity (GW)
17 20 15 10 Interconnector capacity (GW)
50 35 27 34 Total storage capacity (GW)**
20.6 17.9 15.5 17.7 Vehicle-to-grid total capacity (GW)
2050
CR TD SP CE Gas
244 565 638 548 Annual demand (TWh)
2,047 2,992 4,817 4,147 1-in-20 peak demand (GWh/day)
77 68 281 255 Residential demand (TWh)
61% 89% 75% 46% Gas imports (%)
0 0 16 32 Shale production (bcm/yr)
33 265 2 2 Hydrogen production (TWh)
11.9 6.7 0.3 3.6 Green gas production (bcm/yr)
July 2018 17Continuing the conversation
Email us with your views
on FES or any of our future
of energy documents at:
fes@nationalgrid.com and one
of our experts will get in touch.
Access our current and fes.nationalgrid.com
past FES documents, data
and multimedia at:
fes.nationalgrid.com
Get involved in the debate
on the future of energy and
join our LinkedIn group
Future of Energy by National Grid.
Keep up to date on key issues
relating to National Grid via
our Connecting website:
nationalgridconnecting.com
Write to us at:
Energy Insights
National Grid House
Warwick Technology Park
Gallows Hill
Warwick
Future of Energy
CV34 6DA
National Grid plc
National Grid House,
Warwick Technology Park,
Gallows Hill, Warwick.
@
fes@nationalgrid.com
CV34 6DA United Kingdom
Registered in England and Wales
No. 4031152
www.nationalgrid.comYou can also read