INVESTOR PRESENTATION - PT Perusahaan Gas Negara (Persero) Tbk 9M-2017 Update - Perusahaan Gas Negara Persero Tbk PT
←
→
Page content transcription
If your browser does not render page correctly, please read the page content below
PT Perusahaan Gas Negara (Persero) Tbk
INVESTOR PRESENTATION
9M-2017 Update

www.pgn.co.id
DISCLAIMER
The information contained in our presentation is intended solely for your personal
reference. In addition, such information contains projections and forward-looking
statements that reflect the Company’s current views with respect to future events and
financial performance. These views are based on assumptions subject to various risk. No
assurance can be given that further events will occur, that projections will be achieved,
or that the Company’s assumptions are correct. Actual results may differ materially from
those projected.

                                                                                            2
Company Vision and Mission

 To Become the World-Class                 MISSION
  Energy Company in Gas
      Business in 2020       To increase the Company’s added values for stakeholders
                             through:
                             • Customers: Energy needs fulfillment solution that is safe,
                                value-added, economic, and increase the competitiveness;
                             • Society: The improvement of welfare and sustainable
                               economic growth through energy independence and
                               environmental conservation efforts;

       VISION                • Shareholders /Investors: The creation of the optimal and
                               sustainable Company’s values through internal and external
                               synergies.

                                                                                       3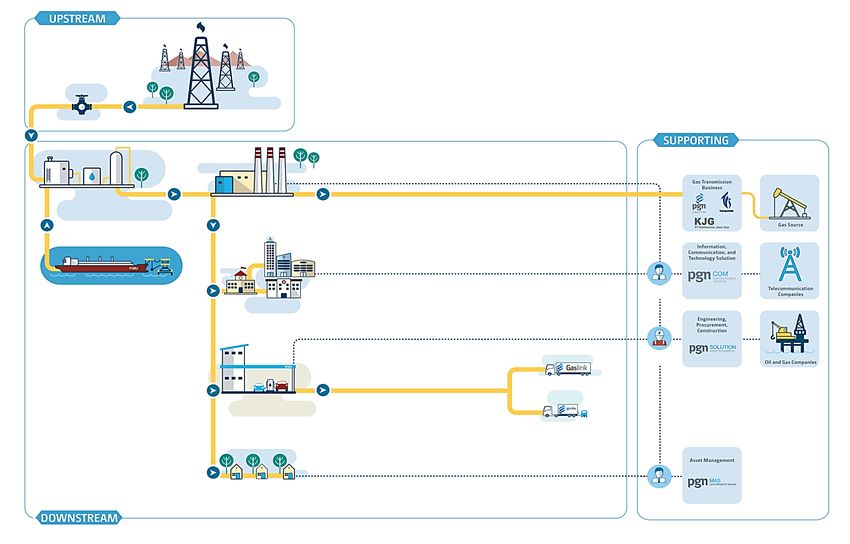
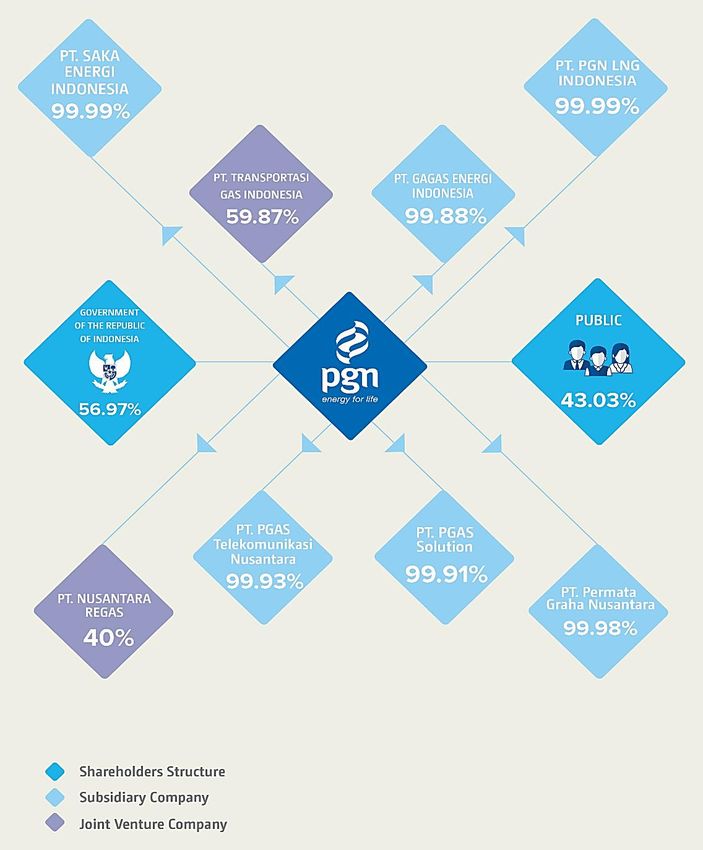
Company Structures

                     PGN is an SOE with main business in natural gas.
                     Currently, the Government of Indonesia holds
                     57% of shares while the remaining 43% is
                     freefloat.

                     In line with its effort to strengthen the core
                     business and expand further, PGN has
                     transformed into a synergized company
                     comprising     upstream,    downstream     and
                     supporting business.

                     It has six subsidiaries and two joint ventures,
                     namely :

                     PGN’s Subsidiary                       Business

                     PT Saka Energi Indonesia                Upstream

                     PT PGN LNG Indonesia                  Downstream

                     PT Gagas Energi Indonesia             Downstream

                     PT Nusantara Regas                    Downstream

                     PT Transportasi Gas Indonesia         Downstream

                     PT PGAS Telekomunikasi Nusantara       Supporting

                     PT PGAS Solution                       Supporting

                     PT Permata Graha Nusantara             Supporting

                                                                         4
Existing Business Coverage

                           Distribution           Transmission
                           Business               Business
                                                  Transporting gas of
                           Buying and selling
                                                  customers; suppliers
                           gas to customers by
                                                  or off-takers through
                           virtue of pipeline
                                                  pipeline. The
                           infrastructure in
                                                  pipeline can also be
                           three main areas in
                                                  function as the
                           West Java, East Java
                                                  backbone to
                           and North Sumatera.
                                                  distribution pipeline.

Upstream                                                                   Other Supporting
Business                                                                   Business
Investing participating                                                    Taking business
interest in PSC and                                                        opportunities along the
operating oil and gas                                                      natural gas value chain;
blocks to support                                                          LNG, CNG, related gas
Indonesia production and                                                   business services, fiber optic
lifting and to hedge the                                                   for telecommunication,
downstream business                                                        management of asset &
                                                                           facilities

                                                                                                    5
Business Model

                                      The existing business model allows PGN to integrate its gas block in upstream to
  Gas Supply                          transmission pipeline for offtaker and integrate its LNG FSRU and conventional
                                      gas to distribution pipeline for customers.
                                      At the same time, the supporting businesses provide excellent service in the form
                                      of infrastructures integrity and reliability as well as safety for customers
                                      satisfaction.

  Compressor Station    Power Plant

  Floating Storage
  Regasification Unit   Commercial
                        Customers

                                                                      Gas Transport Module
                        Gas Filling
                        Station
                                                                       Mobile Refueling Unit

                        Household
                        Customers

                                                                                                                          6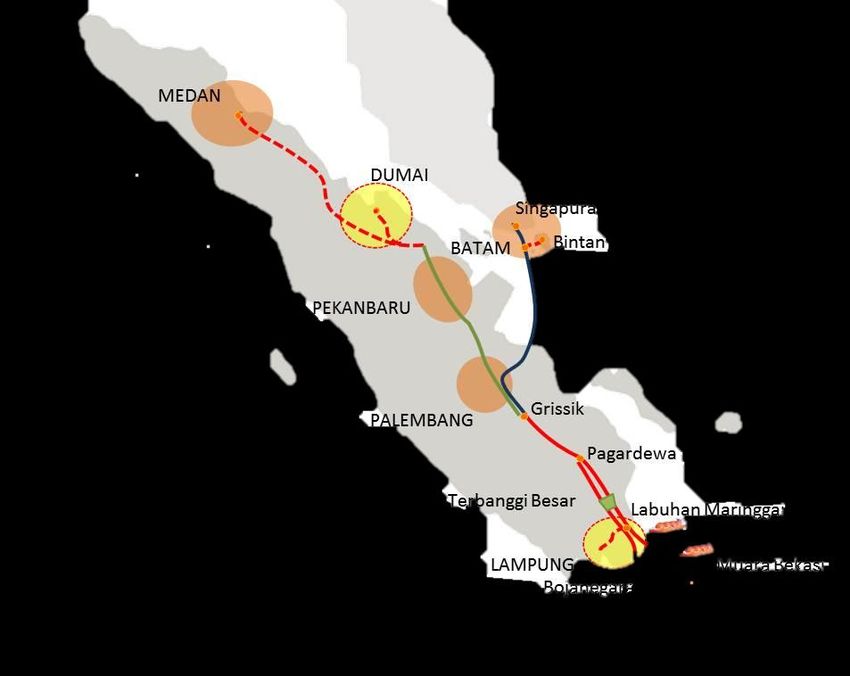
Existing Gas Infrastructure

                                                                                                Non-Pipe Gas Infrastructure

         III
     Medan

               Duri
                                   Batam
                      1      2                                          -    2 FSRU (Lampung dan Jawa Barat)
                                                                        -    4 MRU (DKI, Gresik, Bandung)
                                   Palembang                            -    1 Cluster CNG (Jateng)
                                                                        -    10 Gas Fueling Station (DKI, Bogor, Sukabumi,
                                                                             Purwakarta, Surabaya, Batam, Lampung)
                              3
                          Lampung
                                          Jakarta   4
                                      I
                                           Semarang II Surabaya
Pipeline Network 7.390 km:
       Distribution 5.106 km
     Transmission 2.284 km

1   Transmission Pipeline Grissik – Duri                 I    Distribution West Java, Lampung, Palembang                     Operation
2   Transmission Pipeline Grissik – Batam – Singapore    II   Distribusi East Java and Central Java                          Plan
3   Transmission Pipeline SSWJ                          III   Distribution North Sumatra, Riau and Kepulauan Riau
4   Transmission Pipeline Kalija

                                                                                                                                         7
Business Achievements
Downstream Gas Upstream
Business Infrastructure Business
Operating in 3 Major Coverage Developing ±7,390 km length Total assets 11 blocks (8 blocks
Area, 19 cities and 12 provinces pipeline network, 2 unit FSRU, in operation, 3 blocks in
in Indonesia 10 Gas Fueling Station, 4 MRU exploration)
Transporting and Distributing Increasing oil and gas
Gas 1,502 MMScfd production and lifting to
±36,905 boepd
8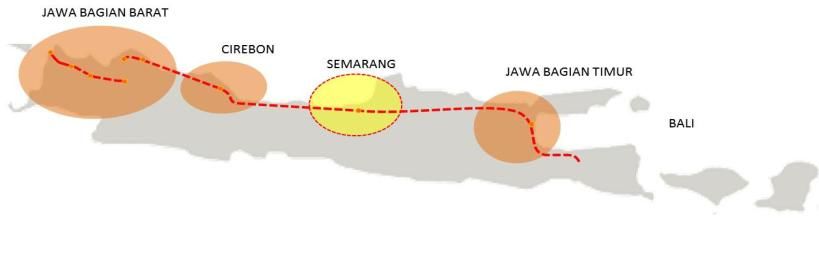
9M-2017 Highlights
DOWNSTREAM INFRASTRUCTURE UPSTREAM
Distribution volume was Duri – Dumai Transmission Overall net lifting ±36,905
802 MMScfd in Q3-2017 - JV with Pertagas boepd
(up 17% QoQ) or 767 - Plan of Operation end • Oil 9,338 bpd
MMScfd for 9M-2017. 2018 • Gas 128 MMScfd
Average sales price USD Duri – Dumai Distribution • LNG 26 MMScfd
8.56/MMBtu - Plan of Operation end • LPG 158 MTPD
Average cost of gas USD 2018
6.04/Mmbtu (incl. LNG)
REVENUES EBITDA OPERATING & NET INCOME
Consolidated revenues of EBITDA USD 632 Million Operating income USD 268
USD 2,165 Million • D&T 69% Million
• D&T 83% • Upstream 31% Net income USD 98 Million
• Upstream 15 %
• Others 2%
CAPEX CAPITAL STRUCTURE WEIGHTED INTEREST RATE CASH FLOW
Revised from USD 500 Million PGN maintain a capital Weighted cost of debt 5.51% Cash and cash equivalent at
to ± USD 300 Million structure within the covenant end of period September 2017
• D&T 36% from its creditors. USD 956 million
• Upstream 56% • Debt to Equity ratio 0.76x
• Others 8% • Debt Service ratio 5.9x
9
Financial Performance
9M-2017 and 9M-2016

                       3,000                                   Consolidated Statement of Comprehensive Income
                                                                                                                                             9M-2016
                                             2,165
                                                                                                                                             9M-2017
                       2,000
       Million USD

                                    2,156                      1,605

                                                       1,491
                       1,000
                                                                                                                                                   632
                                                                                        290                 268                              642
                                                                                                      394                       98
                                                                               263                                     242
                            -
                                      Revenues       Cost of Revenues          Operating              Operating        Net Income             EBITDA
                                                                               Expense                 Income

                                                               Consolidated Statements of Financial Position
                           8,000
                                                                                                                                              9M-2016
                                                                                6,307
                                                                       6,834
                                                                                                                                              9M-2017
                           6,000
             Million USD

                                                             4,503
                           4,000                     4,709
                                                                                                                                     3,161             3,146
                                                                                                                    2,614    3,664
                                             1,804                                                                                             3,170
                           2,000                                                                            2,849
                                     2,125
                                                                                                     547
                                                                                           815
                                -
                                    Current Assets Non Current         Total Assets            Current      Non Current Total Liabilities Total Equity
                                                     Assets                                   Liabilities    Liabilities

                                                                                                                                                               10
Financial Performance
Comprehensive Income 30 Sept 30 Sept Cash Flow
Statement 2017 2016 30 Sept 2017 30 Sept 2016
In Million USD
In Million USD
Revenues 2,165 2,156
Cost of Revenues (1,605) (1,491) Cash flow from operating 546 437
Gross Profit 560 665 Cash flow from investment (232) (388)
Operating Income 268 394
Cash flow from financing (662) (8)
EBITDA 632 642
Tax Expense (88) (50)
Net Income 98 242 Wtd Avg (after
tax)
5.51%
83% 15% 2%
Fixed Float
98% 2%
Total Loan USD
2.41 billion
Distribution Oil and Gas Other Operations
contributes 83% to the total contributes 15% to the total Supporting and joint venture
consolidated revenues consolidated revenues businesses contribute 2%.
The businesses included LNG USD JPY
regasification, finance lease, 85% 15%
technical and maintenance
service, office & building
management serivice
11Financial Performance
30 Sept 30 Sept
2017 2016
Impact of Macroeconomy Financial Ratios
EBITDA Margin (%) 29.2 29.8
Unfavorable market conditions has
had a profound impact on Indonesia Net Debt / EBITDA (x) 2.2 2.5
industry, not least on the national
gas industry EBITDA / Interest Expense (x) 5.9 7.6
The contraction in demand of Debt / Equity (%) 76.1 93.5
commodities including natural gas
ROA (%) 10.0 9.6
Government’s incentives to maintain
competitiveness for national ROE (%) 3.2 8.4
industries and gas users such as
fertilizer, petrochemicals and steel ROCE (%) 5.1 6.9
Credit Rating Rating Outlook
Moody’s Baa3 Positive
Standar & Poor’s BBB- Stable
Fitch Ratings BBB- Positive
Pefindo idAAA Stable
12Downstream - Distribution Business
Distribution 900 865
Year-on-Year Basis
850 807 824 802 803 -3%
793
• In 9M-2017, PGN delivered 767 MMscfd, lower 767
800
by 27 MMScfd from the corresponding period
750
(MMscfd)
2016
700
• Regional Distribution I contributed 70%,
Regional Distribution II contributed 17% and 650
Regional Distribution III 13% to the total sales 600
• YoY declining was impacted by lowering 550
consumption in second quarter mainly from 500
power sector and industries 2012 2013 2014 2015 2016 9M-16 9M-17
Wood 0.0% 180,893
Lifting Oil 0.3% Industrial & Commercial 168,973
Diversification
Cement 0.5%
Customers
incl. Power Sector
CNG 1.1%
763 MMScfd
Textile 2.1%
96,049 111,076
Others 3.2% 91,590
Basic Metal 3.5%
Glass 4.8%
2013 2014 2015 2016 2017
Paper 4.8%
Fabricated Metal 6.3% Five Biggest Industries and Power Plants Commercial & SME Households
Ceramic 10.7% Segments
Food 10.9% 97.1% 2.5% 0.4%
of total sales volume of total sales volume of total sales volume
Chemical 14.0%
Power Plant 37.9% 1,739 1,984 177,170
Customers* Customers* Customers*
*Number of customers as of 30 September 2017
13Downstream – Gas Sales Price
Natural Gas - avg PGN 8.56 PGN Average
Selling Price
LPG - 3 kg (Subsidized) 7.07 • In nine month period, PGN’s average selling
-17% price was USD 8.56/MMBtu
MFO 180 12.41
+45%
• Price of gas remained competitive than other
LPG - 50 kg 19.98 energy sources. However, amid market
+133%
competition, PGN offers special and incentive
Kerosene 18.13 price which can benefitting the customers
+111%
from using larger gas volume. The aims is to
IDO/MDF/MDO 17.07
+116% maintain PGN’s market share
Gasoline 88 18.61
+1167% • PGN has been diligently approaching other
LPG - 12 kg 20.11 SOE and private sectors to form a synergy of
+135% business in which PGN can provide gas and
HSD 18.82 related services.
+119%
USD/MMBTU
Based on :
Price of Pertamina Depot as of Sept 2017
Exchange Rate IDR 13,492
14Downstream - Transmission Business
Transmission
In 9M-2017, PGN, KJG, TGI delivered 8 MMscfd, 76
MMScfd, 651 MMScfd respectively. The transmission
Year-on-Year Basis
volume decreased by 8% yoy from the corresponding
period 2016 900 877
Gas transported from Kepodang field operated by 854 852
Petronas through Kalimantan – Java pipeline 850
decreased by 19 MMScfd from 95 to 76 MMScfd due 795 802
to declining reserve from supplier 789 -8%
800
Gas transported by TGI, the joint venture, to off-taker
(MMscfd)
in Central Sumatera and Singapore decreased by 39
750 736
MMScfd from 690 to 651 MMScfd. This was due to
lower absorption of TGI’s customer in Central Sumatra
and Singapore. 700
650
600
550
500
2012 2013 2014 2015 2016 9M-16 9M-17
15Upstream Business – Saka Energi Indonesia
• At present, PGN’s subsidiary Saka
Energi Indonesia has acquired 11 oil Acquired Oil and Gas Blocks
and gas blocks where most of them are
in producing stage and located in Aset %Wi Operator Area (Km2) Status PSC Expiry
Indonesia
Pangkah 100 SEI 784 Production 2026
• It operates oil and gas blocks, Pangkah
Ketapang 20 Petronas 885 Production 2028
in East Java while hold participating
interest for the remaining blocks Bangkanai 30 Salamander 1,395 Production 2033
• Muara Bakau block starts producing by South Sesulu 100 SEI 625 Exploration 2039
first half 2017. Current production 467
MMScfd Fasken (Texas) 36 Swift Energy 8,300 acres Production 2050
• Saka Energi has received approval from SES 8.9 CNOOC 6,082 Production 2018
SKK Migas for POD of Sidayu 4 well of
Muriah 20 Petronas 2,823 Production 2021
Pangkah block
West Bangkanai 30 Salamander 5,463 Exploration 2043
Muara Bakau 11.7 Eni 1,082 Production 2032
Wokam 100 SEI 3,714 Exploration 2040
Sanga-Sanga 37.81 SEI & Vico 1,075 Production 2018
16Upstream Performance
Oil and Gas Lifting Crude Oil & Condensate (MMBBL) Gas (BBTU)
27,832 boepd 36,905 boepd
Pangkah
Sep-16 Sep-16 10,651
Pangkah
1.07
+33% Sep-17 13,198
4,405 Sep-17 0.89
Sep-16 1,229
SES
Sep-16 0.60
- Sep-17 1,075
SES
21,334 Sep-17 0.46
Muriah Ketapang
Sep-16 137
17,398
Sanga-Sanga Ketapang
Sep-16 0.81 Sep-17 1,670
LNG
Sep-17 0.76 Sep-16 4,661
Gas 1,828
1,364 Sep-17 3,844
LPG Sep-16 -
9,070 9,338 Sep-16 11,792
Sanga Bangkanai Fasken
Oil Sep-17 0.44
Sep-17 10,709
9M-2016 9M-2017 Sep-16 27
9M-16 9M-17
Sep-17 1,118
Total Crude Oil Lifting 2.49 2.55
Sep-16 -
Sanga-
Sep-17 3,331
9M-16 9M-17
LNG (BBTU) LPG (MT)
Total Gas Lifting 28,498 34,946
Sanga Pangkah
Sanga-Muara
Sep-16
Sanga Bakau
- Sep-16 32,236
Sep-17 2,429 Sep-17 41,131
Sep-16 -
Sanga-
Sep-16 -
Sep-17 4,786
Sep-17 1,903
9M-16 9M-17 9M-16 9M-17
Total LNG Lifting 0 7,215 Total LPG Lifting 32,236 43,034
17Strategy & Plan
Optimization Customer Intimacy
Designing the plan, development, • Providing customers the gas and
operational , trading by related service as reliable energy
optimising available asets and • Sales force as marketing agency
human capital
• Fostering relationship with customers
Focused & Maximizing Value
Integrated Creation
• Integrated gas business • Encouraging subsidiaries to
based on economic zone create further business
develoment opportunity
• Focus on strengthenning • Priority of investment and
the core business development that gives beneficial
impact for long term
PGN GROUP
18Infrastructure & Market Development 2020
• Development of market by construction of
distribution backbone
Customer Attachment RD III • Delivering gas to RD by developing pipeline
Potential of 0.70 MMscfd Development of Transmission Pipeline or modifying system in station
Plan of operation: 2017 &2018 WNTS-Pemping
16”-5 km; reserved capacity of 40 MMscfd • Customer attachment to build acccess until
Plan of operation : 2018 last mile
Development of Gas Infrastructure in
West Java
6-12" : 39 km;
Development of Gas Infrastructure
Reserved capacity of 14.30 MMscfd
in East Java
Plan of Operation: 2017
6-10" : 14 km
Potential of 4.30 MMscfd;
Customer Attachment RD I Plan of operation: 2017
Potential of 16.80 MMscfd;
Plan of Operation : 2017 &2018
Delivering Gas to RD II
Market Development in Dumai
10-16 " - 2.1 km
16”& 24” – 119 km
Reserved Capacity of 60 MMscfd);
Potential of 95 MMscfd
Gas In: June 7, 2017;
Plan of Operation : 2018
Plan of Operation : 2017
Market Development in Subang
8- 16" - 33 km
Potential of 29.64 MMscfd Customer Attachment RD II Market Development in Gresik, Lamongan
Plan of operation : 2019 Potential of 6.03 MMscfd; and Tuban
Plan of Operation : 2017 &2018 Phase I : 24" - 11.5 km
Potential of 36 MMscfd
Plan of Operation: 2017
19Evolving Gas Regulation
October 2015 May 2016 November 2016 July 2017
Third Economic Presidential Decree Decree of ESDM Minister Gas Price Amendment
Policy Package No. 40 /2016 No. 40/2016 CPGL – PGN
Lowering energy price Determination of gas price Gas prices for three specific ESDM Minister approved
including gasoline, for seven industries (specific industries i.e the fertilizer, increased gas price of
electricity and gas price users) petrochemical and steel ConocoPhillips to PGN in
industry Batam Area
February 2016 June 2016 July 2017
Decree of ESDM Decree of ESDM Decree of ESDM
Minister Minister Minister
No. 6 /2016 No. 16 /2016 No. 45 /2017
Guideline and procedure to Procedure for determining Guideline to determine
determine allocation, the price for specific users utilization and price of gas
utilization and price of gas for electricity sector
20Contact:
Investor Relations
PT Perusahaan Gas Negara (Persero) Tbk
Mid Tower Manhattan 26th Floor
Jl. TB Simatupang Kav. 1-S
Jakarta, Indonesia
investor.relations@pgn.co.id
+62 21 8064 1111You can also read