2018 Interim Results Announcement - Nexteer
←
→
Page content transcription
If your browser does not render page correctly, please read the page content below
2018
               Interim Results
                    Announcement

    Copyright 2018, Nexteer Automotive Corporation. All rights reserved.
1
Safe Harbor Statement
    These materials have been prepared by Nexteer Automotive Group Limited (“Nexteer” or the “Company”) and are being furnished to you solely for informational purposes. The
    information contained in these materials has not been independently verified. NO REPRESENTATION OR WARRANTY EXPRESS OR IMPLIED IS MADE AS TO, AND NO RELIANCE
    SHOULD BE PLACED ON, THE FAIRNESS, ACCURACY, COMPLETENESS OR CORRECTNESS OF THE INFORMATION OR OPINIONS CONTAINED HEREIN. It is not the intention
    to provide, and you may not rely on these materials as providing, a complete or comprehensive analysis of the Company’s financial or trading position or prospects.

    Neither Nexteer nor any of its affiliates, advisors or representatives shall have any liability whatsoever (in negligence or otherwise) for any loss that may arise from any use of this
    presentation or its contents or otherwise arising in connection with this presentation.

    Certain statements contained in these materials constitute forward-looking statements. Such forward-looking statements involve known and unknown risks, uncertainties and other
    factors, many of which are beyond our control, which may cause the actual results, performance or achievements of the Company to be materially different from those expressed by, or
    implied by the forward-looking statements in these materials. The Company undertakes no obligation to update or revise any forward-looking statement, whether as a result of new
    information, future events or otherwise. Many factors may cause the actual development to be materially different from the expectations expressed here. Such factors include, for
    example and without limitation, changes in general economic and business conditions, fluctuations in currency exchange rates or interest rates, the introduction of competing products,
    the lack of acceptance for new products or services and changes in business strategy.

    In this document, all references to “Booked Business Amount” are to our estimation of the value of all booked business under contracts that have been awarded to us. The Booked
    Business Amount is based on estimated lifetime volume of the programs derived from indicative production arrangements provided by the applicable OEM customers and information
    provided by third-party industry sources. In calculating the Booked Business Amount, we also assume that the relevant contracts will be performed in accordance with their terms. Any
    modification or suspension of the contracts related to the booked business by our customers could have a material and adverse effect on the value of the booked business. The value of
    booked business is not a measure defined by International Financial Reporting Standards (“IFRS”), and our methodology for determining the Booked Business Amount may not be
    comparable to the methodology used by comparable companies in determining the value of their booked business. While we believe that our current Booked Business Amount is a
    relevant financial metric, the information in relation to the booked business and the Booked Business Amount included in this document does not constitute a projection, forecast or
    prediction of our profits, and the actual contract value may be different from the estimated Booked Business Amount due to various factors and uncertainties beyond our control. We
    cannot assure you that our estimated Booked Business Amount contained in this document will be indicative of our future operating results.

    This document does not constitute an offer, solicitation, invitation, or recommendation to purchase or subscribe for any securities and no part of it shall form the basis of or be relied upon
    in connection with any contract, commitment or investment decision in relation thereto.

2           CONFIDENTIAL
Business Highlights

                          Michael Richardson
                          Executive Board Director
                          President

3     CONFIDENTIAL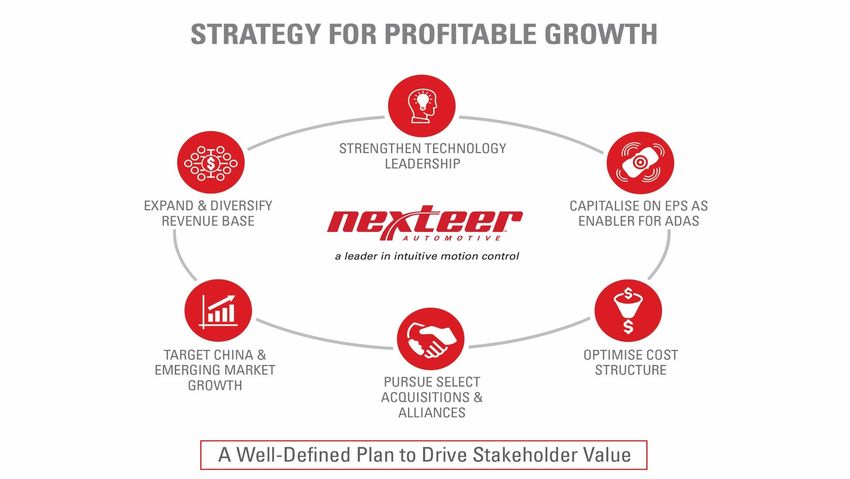
WHY We Deliver Motion Control Solutions

    ▪ Every day, millions of people around the
      globe depend on Nexteer to deliver:
       – High-quality
       – Application specific
       – Safety-critical motion control solutions
    ▪ We deliver protection, personality,
      performance and passion in driving.

    ▪ We make driving safe, fuel-efficient & fun
      for today’s world & an automated future.

4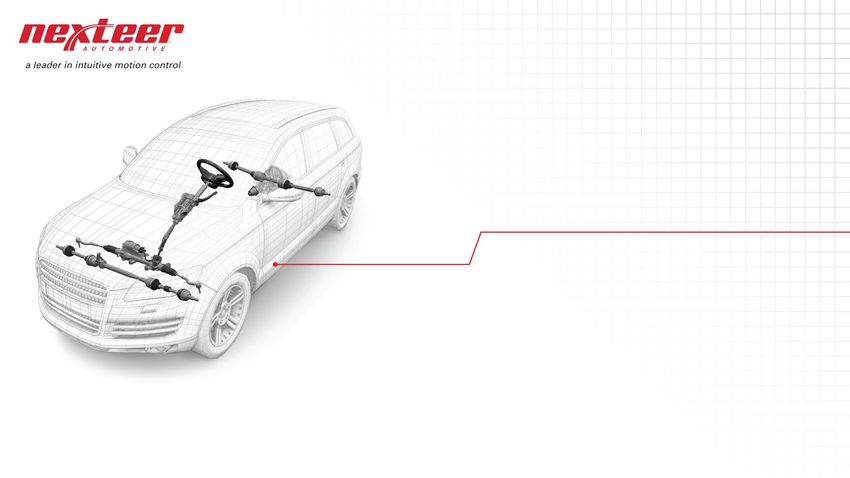
Strategy for Profitable Growth

       Strengthen Technology Leadership
       Expand & Diversify Revenue Base
       Capitalise on EPS as enabler for ADAS
       Target China & Emerging Market Growth
       Optimise Cost Structure
       Pursue Select Acquisitions & Alliances

                Well-Defined Plan to Drive Stakeholder Value
5     CONFIDENTIAL
2018 1H Business Highlights
    Strategic Coherence and Portfolio Discipline

    ▪ Successful launch of 8 programs across multiple
      product lines, regions & customers

    ▪ Increased Order-to-Delivery Backlog to US$24.9 billion
    ▪ Continued global strategic footprint expansion
    ▪ Solidified Steering industry leadership as product innovator
    ▪ Focused on operational efficiency improvement

6
Launched 8 Major Customer Programs

                               • GM Excelle
                                                                  6
                 2               CEPS
                               • SGMW Wuling Rongguang
                                 CEPS
                               • Chang’An X70A
          • FCA Ram 1500         CEPS
            REPS, Column       • Chang’An Eado
                               • CEPS
                               • FCA Grand Commander
                               • Column
                               • Maruti-Suzuki Swift Dzire Tour
                                 Driveline
7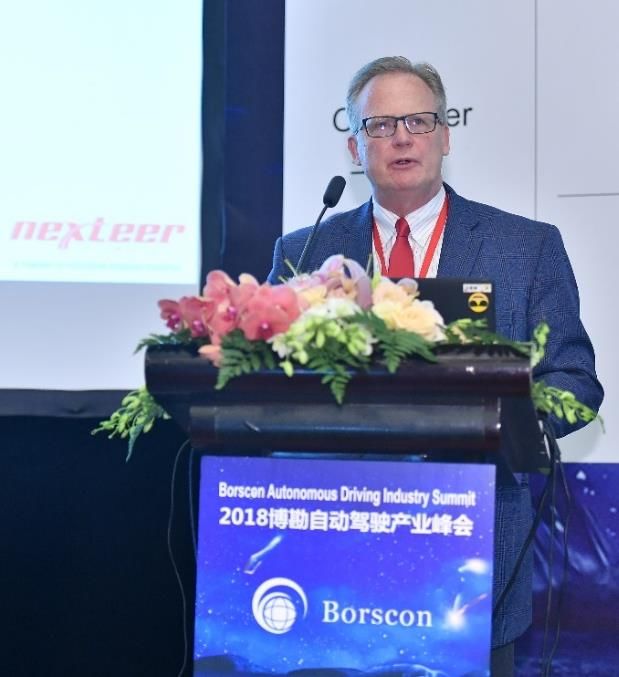
New Vehicle Launch

                     FCA                         SGMW                        FCA
                   Ram 1500                 Wuling Rongguang          Grand Commander

          GM                  Maruti-Suzuki Swift              Chang’An                 Chang’An
         Excelle                  Dzire Tour                     X70A                     Eado
8
2018 1H Business Highlights
    Strategic Coherence and Portfolio Discipline

    ▪ Successful launch of 8 programs across multiple
      product lines, regions & customers

    ▪ Increased Order-to-Delivery Backlog to US$24.9 billion
    ▪ Continued global strategic footprint expansion
    ▪ Solidified Steering industry leadership as product innovator
    ▪ Focused on operational efficiency improvement

9
Projected Business Rotation

                                              Order to Delivery Backlog* as of June 30, 2018

                                                                        +3.0        24.9
                         23.9                   -2.0
                                                                                                   14%
                                                                                                                  EPS

                                                                                             12%                  HPS
                                                                                                   $24.9B         CIS
                                                                                             3%

                                                                                                            71%   DL

                       Dec 31,                1H 2018                 Net New      Jun 30,
                        2017                  Revenue                  Order        2018
                                                                      Booking

     * Booked business information is compiled through our internal records, and
       such information has not been audited nor reviewed by our auditors.

10
EPS Featuring New Technology For
Industry Trend
16%
8%
8%
16% EPS
Backlog
EPS assembly for
Electric Vehicle
EPS enables L3-5
ADAS/AD function
11 CONFIDENTIAL2018 1H Business Highlights
Strategic Coherence and Portfolio Discipline
▪ Successful launch of 8 programs across multiple
product lines, regions & customers
▪ Increased Order-to-Delivery Backlog to US$24.9 billion
▪ Continued global strategic footprint expansion
▪ Solidified Steering industry leadership as product innovator
▪ Focused on operational efficiency improvement
12Strategic Manufacturing & Technical Footprint
Expansion 1H 2018
Kenitra, Morocco
EPS & Driveline
Queretaro, Mexico Manufacturing
Driveline
Manufacturing Bangalore, India
Software Center
13Software as a Product Differentiator
Nexteer Software Engineer Growth
Total: 100
NA
2013 AP
EMEA/SA
Total: 400+
2018
Total: 600+
2020
142018 1H Business Highlights
Strategic Coherence and Portfolio Discipline
▪ Successful launch of 8 programs across multiple
product lines, regions & customers
▪ Maintained Order-to-Delivery Backlog of US$24.9 billion
▪ Continued global strategic footprint expansion
▪ Solidified Steering industry leadership as product innovator
▪ Focused on operational efficiency improvement
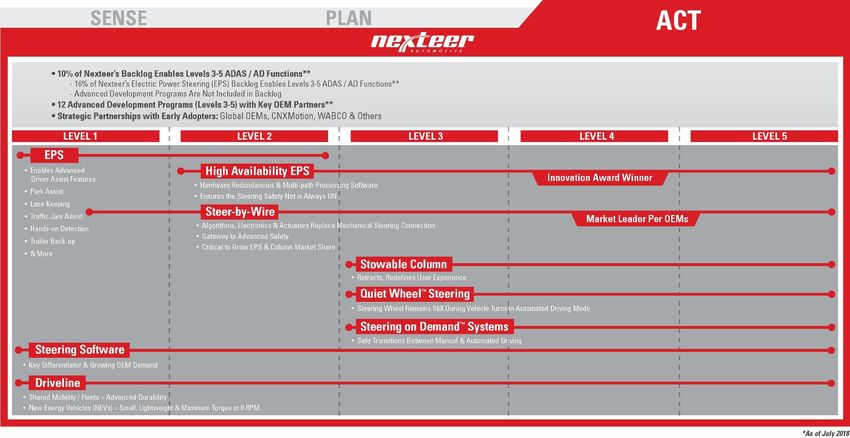
15Industry Leadership Validated Through
Advanced Technology Projects Awards
12 Programs
in Current
Development
(Levels 3-5)
with Key OEM Partners
Lateral Directional Control
* Source: SAE International
16Industry Leadership 17
Industry Leadership in Core Steering Products

     Nexteer recognized as key contributor to GM’s delivery of its first    ADAS vehicle

          2017 Supplier of the Year                             Fully-redundant
               Innovation                                    ADAS Level 5

18
Industry Leadership in Core Steering Products
Nexteer recognized as key contributor to GM’s delivery of its first ADAS vehicle
“This is an opportunity for GM to honor those
suppliers who are truly the best of the best.
The automotive industry is transforming at an
incredible rate. The relationships we have
with our supply base means everything when
it comes to delivering a strong vehicle lineup
today & the cutting-edge vehicles and mobility
services of tomorrow.”
─ Steve Kiefer, GM senior vice president,
Global Purchasing & Supply Chain
19Technology Leadership
Global Stage, Confidential Showcases &
Research Clinics for Early Adopters
202018 1H Business Highlights
Strategic Coherence and Portfolio Discipline
▪ Successful launch of 8 programs across multiple
product lines, regions & customers
▪ Increased Order-to-Delivery Backlog to US$24.9 billion
▪ Continued global strategic footprint expansion
▪ Solidified industry leadership as product innovator
▪ Focused on operational efficiency improvement
21Industry GM Innovation Award 2018 North American Truck of the 2018 Motor Trend Truck
High Availability EPS Year of the Year
Recognition Lincoln Navigator
Steering Column, REPS
Ford F-150
Steering Column, REPS
2018 Frost & Sullivan 2018 SGMW Excellent
Manufacturing Leadership Supplier Award of
Award Indonesian Subsidiary
22 CONFIDENTIALIndustry Ford Top Performing Global
Suppliers
Ford Top Supplier Award - 2018 SGMW Excellent
Manufacturing Operations Collaboration Award
Recognition Ford Excellence Awards Queretaro - Silver Award
Melvin L. Wilcox 2018 GAC FCA Excellent
Innovation Award Delivery Performance
Magnetic Torque Overlay
(MTO) Team
Supplier Award
23 CONFIDENTIALFinancial Highlights
Bill Quigley
Senior Vice President
Chief Financial Officer
24 CONFIDENTIAL1H 2018 Financial Highlights
1. Strong results across key financial metrics
− Higher Y/Y earnings with expected margin profile
− Significant earnings and margin improvement compared to 2H 2017
2. Revenue bolstered by organic growth and currency
− APAC key customer demand tempering revenue
3. Record Net Profit performance
− Cost efficiencies largely on track; monitoring commodity environment
− Benefit from US Tax Reform
4. Significant Free Cash Flow and healthy Balance Sheet
5. Strong customer program awards driving increased Backlog
25 CONFIDENTIAL1H 2018 Financial Highlights
Revenue EBITDA Net Profit Free Cash Flow
(in millions) (in millions) (in millions) (in millions)
+3.7%
+1.3%
$2,047 +11.1%
$1,974 +34.4%
$1,904 $327 $331
$200
$183
$294 $180
$172
$136 $131
1H 2017 2H 2017 1H 2018 1H 2017 2H 2017 1H 2018 1H 2017 2H 2017 1H 2018 1H 2017 2H 2017 1H 2018
* Net Profit Attributable to Equity Holders
26 CONFIDENTIALRevenue by Region
Global Revenue Regional Distribution
(in millions) (in millions)
$1,974 $2,047 N. America Asia Pac. EMEA-SA
13% 14%
+$36 $1,343
+$29 -$27
21% 20%
$1,307 $416 $418 +$12 $286
+$23
$251
+0.6% $14
+13.7%
66% +3.7% 66% +2.7%
FX-adj.: -6.3% FX-adj.: 4.8%
1H 1H 1H Vol./ 1H 1H FX Vol./ 1H 1H FX Vol./ 1H
2017 2018 2017 Price 2018 2017 Price 2018 2017 Price 2018
N. America Asia Pac. EMEA-SA
27 CONFIDENTIALRevenue by Product Line
Global Revenue Product Distribution
(in millions; structural %) (in millions; growth %)
$1,974 $2,047 EPS Columns HPS Driveline
15% +5.1%
15%
5%
4% +0.7% +5.0%
16% $1,321
16% 16%
-8.5%
$1,257 $335 $337 $304
$290
64% +3.7% 65% $93
$85
1H 1H 1H 1H 1H 1H 1H 1H 1H 1H
2017 2018 2017 2018 2017 2018 2017 2018 2017 2018
EPS Columns HPS Driveline
28 CONFIDENTIALEarnings and Margin Profile
EBITDA Operating Profit Net Profit
(in millions) (in millions) (in millions)
9.8%
12.2% 11.7%
16.2% $200
16.6% $240 $240
$327 $331
9.1%
9.9%
15.5% $180 9.0%
$188
$294 $172
1H 2017 2H 2017 1H 2018 1H 2017 2H 2017 1H 2018 1H 2017 2H 2017 1H 2018
29 CONFIDENTIALEBITDA Margin Strong Across all Regions
N. America Asia Pac. EMEA-SA
(in millions) (in millions) (in millions)
16.7% 16.3%
21.5% 21.0%
16.0%
18.5% 10.1%
8.7% 8.6%
$219 $196 $220 $89 $81 $88 $22 $21 $29
1H 2017 2H 2017 1H 2018 1H 2017 2H 2017 1H 2018 1H 2017 2H 2017 1H 2018
30 CONFIDENTIALCapital Investment for Future Growth
R&D Expense* Capex*
(in millions) (in millions)
6.5%
6.0%
4.1%
3.3%
$134
$119
$81
$67
1H 2017 1H 2018 1H 2017 1H 2018
• Including engineering and product development costs charged to income statement and
development costs capitalized as intangible asset.
Capex presented based on assets acquired
31 CONFIDENTIALStrong Free Cash Flow and Balance Sheet
(in millions) Jun 2018 Dec 2017
Cash and Capital
1H 2017 1H 2018 Gross Debt $412 $491
Less: Cash 605 601
Net Debt ($193) ($110)
$140 Total Equity $1,548 $1,441
$176
Total Net Capital $1,355 $1,331
$323 Net Debt to Net Capital n.a. n.a.
$312
Liquidity
$183 Cash $605 $601
$136 $136
Credit Facilities 489 456
Total $1,094 $1,057
Cash from Investing Free Cash Cash from Investing Free Cash
Ops Activities Flow Ops Activities Flow Leverage / Coverage
Gross Debt to EBITDA* 0.7x 0.8x
Net Debt to EBITDA n.a. n.a.
* LTM EBITDA
32 CONFIDENTIAL2018 Rest of Year Considerations
1. Revenue paced by global OEM unit production
2. Potential currency headwind from USD strength
3. Closely monitoring commodity environment – managing supply chain
and customer relationships
4. Substantial number of customer program launches
5. Broad customer opportunities driving future growth
Actioning Both Near Term Performance and Long-Term Growth
33 CONFIDENTIALStrategy for Profitable Growth
Strengthen Technology Leadership
Expand & Diversify Revenue Base
Capitalise on EPS as enabler for ADAS
Target China & Emerging Market Growth
Optimise Cost Structure
Pursue Select Acquisitions & Alliances
Well-Defined Plan to Drive Stakeholder Value
34 CONFIDENTIALYou can also read