Presentation of the FAMUR Group Q1 2018 business results summary
←
→
Page content transcription
If your browser does not render page correctly, please read the page content below
Presentation of the FAMUR Group
Q1 2018 business results summary

2018 ® FAMUR Group
This presentation is the property of FAMUR S.A. Its processing, copying or saving on information carriers, in whole or in part, or making it available, in whole or in part, to third parties requires prior written consent of FAMUR S.A. Any statements contained in this presentation which do not refer to historical facts are ‘forward-looking statements’. Such forward-looking statements, in particular where they refer to future financial performance or potential development of the FAMUR Group, should not be regarded as firm forecasts. FAMUR S.A. can give not assurance that any predictions regarding the future will materialise. Future financial performance may significantly differ from projections.
Agenda

1. Introduction
2. 2017 financial highlights and key developments
3. Market environment
4. The Group’s development prospects

FAMUR Group | key facts
CEE’s largest supplier of a complete range of solutions for the mining industry
Regional leader in the Underground, Surface and Handling Systems segments
Dynamic growth on foreign markets
Strong M&A track record - 16 successful acquisitions
Approximately 400 engineers and designers working for the Group
Highest profitability in the industry in the long term
11 42 5,000+ PLN 1,460m* PLN 308m* 38%
production companies employees in revenue in EBITDA of exports
facilities
* 2017 data
May 2018 | 2018 ® FAMUR Group 4
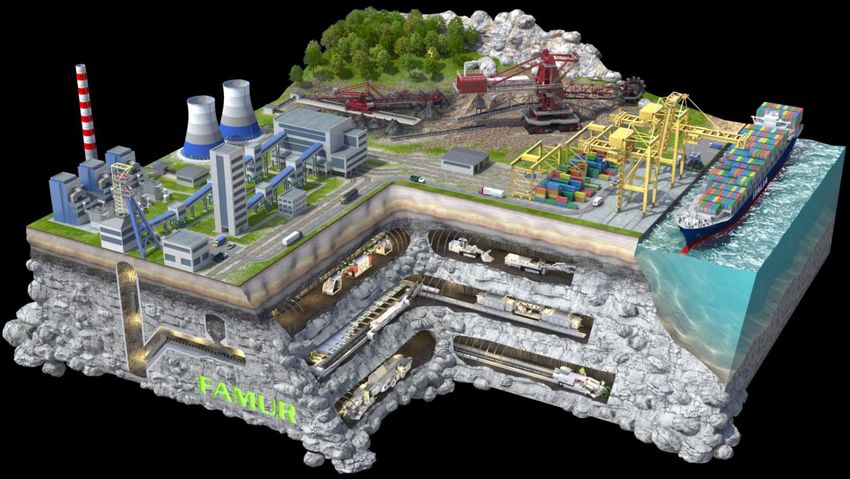
Comprehensive portfolio of FAMUR products

                                                                                              1.    Shearer loaders
                                                                                              2.    Powered roof support systems
                                                                                              3.    Scraper conveyors
                                                                               14             4.    Roadheaders
                                                   13                                    19   5.    Drilling and bolting rigs
                             16                             12                                6.    Haul trucks
                                                                                    18
                  15                                                                          7.    Suspended monorail systems
                                  11                                      17
                                                                                              8.    Underground belt conveyors
             19
                                                                                              9.    Mining electrical equipment
                   11
        10                                                                                    10.   Mine shaft
                                           7                                                  11.   In-plant continuous transport
                                                             20                               12.   Surface belt conveyors
                                                                      5
                                                                                              13.   Stacker-reclaimers
                                                        3
                                                                                              14.   Bucket-wheel excavators
                                                                  9
                                       2           1                                          15.   Wagon tipplers
                   8
                                                                                              16.   Surface infrastructure
                                                                                              17.   Container cranes
                                                   6                           4
                                                                                              18.   Ship-to-shore gantry cranes
                                               4                                              19.   Power plant's coal feeding system
                                                                                              20.   Loaders and dinting loaders

 May 2018 | 2018 ® FAMUR Group                                                                                                      5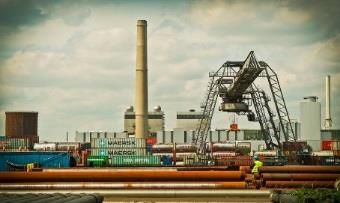
Key production facilities

 SURFACE
                                                                       KATOWICE (FAMUR)
 UNDERGROUND

                     KONIN (FUGO) *

                                                          PIOTRKÓW TRYBUNALSKI (PIOMA)
               ZGORZELEC (FAMAGO) *

                                                                          KLUCZBORK (FAMAK)

              CHORZÓW (ELGÓR + HANSEN) *

                                                                                  KATOWICE (REMAG)
                                  ZABRZE (KOPEX) *
                                                                          GORLICE (GLINIK)

                                      RYBNIK (RYFAMA) *
                                                                       NOWY SĄCZ (NOWOMAG)

                                                                                          * Acquired in 2017
 May 2018 | 2018 ® FAMUR Group                                                                                 6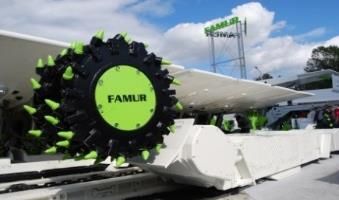
Agenda

1. Introduction
2. 2017 financial highlights and key developments
3. Market environment
4. The Group’s development prospects
Financial Highlights
       2016                        2017                      2017 COMBINED*                                  Q4 2017                                  Q1 2018
                                                                          +

  PLN 1,030m              PLN 1,460m                            PLN 1,905m                                  PLN 493m                                  PLN 502m
     Revenue                 Revenue        +42 %                    Revenue                                                         +2 %
                                                                                                               Revenue                                 Revenue

   PLN 239m                PLN 298m                              PLN 404m                                    PLN 93m                                  PLN 103m
     EBITDA                  EBITDA**       +21 %                   EBITDA**                                                          +11 %
                                                                                                               EBITDA**                                EBITDA

      23%                      20%           -15 %                      21%                                     19%                                     21%
  EBITDA margin           EBITDA margin**                         EBITDA margin**                         EBITDA margin**              +11 %
                                                                                                                                                  EBITDA margin

   PLN 114m                PLN 114m          +0 %
                                                                  PLN 172m                                   PLN 35m                                  PLN 52m
       EBIT                   EBIT**                                   EBIT**                                    EBIT**                +49 %             EBIT

   PLN 94m                 PLN 82m          -13 %                 PLN 124m                                   PLN 20m                                  PLN 39m
     Net profit             Net profit**                            Net profit**                               Net profit**            +95 %           Net profit

  PLN -133m                PLN 80m          -213m                  PLN 80m                                    PLN 80m                                 PLN 13m
     Net cash                Net debt                                Net debt                                   Net cash               +67m            Net debt

                                             NOTES: Kopex results are consolidated since H2 2017 | * Pro-forma data for 12M 2017 FAMUR + KOPEX
                                                      ** EBIT, **EBITDA, **EBITDA MARGIN, **Net Profit – normalized i.e. excluding Q4 2017 one-offs
   May 2018 | 2018 ® FAMUR Group                                                                                                                                    8
Development of the Group’s operating segments

            Machinery and Equipment                                   Back-to-Back Solutions
              From a manufacturer of narrow-use              ... to a supplier of back-to-back solutions for the mining,
               mining machines and systems ...                     transport, transshipment and power industries.

     Design            Manufacturing              Delivery        Erection                  Commissioning                  Service

  May 2018 | 2018 ® FAMUR Group                                                                                                      9
Finance – stable liquidity
OCF cumulatively (PLNm)
2 367 2 426
Net debt (PLNm) 2 175
1 861
1 746
1 349
1 072
659
502
191 239
251
73 76 65 127 73 80
15 -22 18 13
-13 -31 -138 -133
2006 2007 2008 2009 2010 2011 2012 2013 2014 2015 2016 2017 Q1 2018
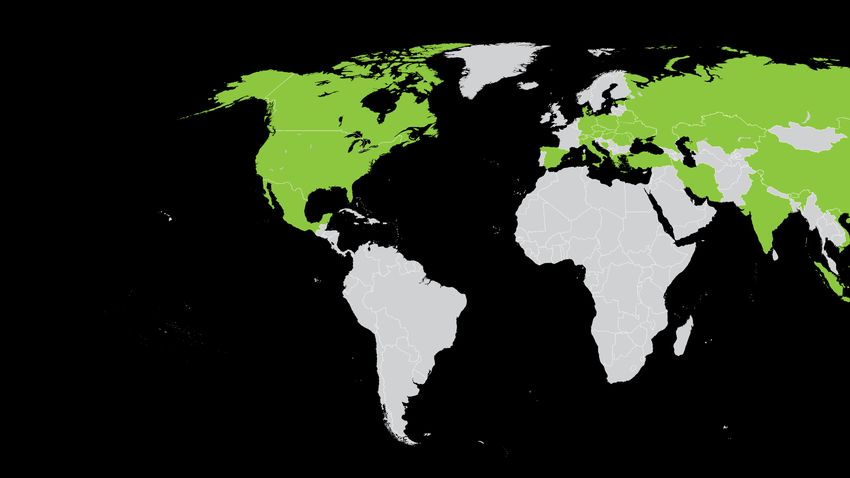
May 2018 | 2018 ® FAMUR Group 10Geographical split of revenue
Share of exports in the Group’s sales, 2013 – 2017 Revenue by country
Others; 4%
50% Germany; 2%
Mexico; 2%
38%
France; 2%
30% Bulgaria; 3%
26% 27%
Russia; 4%
18% Poland; 69%
Austria; 5%
Kazakhstan; 10%
2013 2014 2015 2016 2017 2022 target
*) as of Q1 2018
The geographical split of the Group's revenue is variable, with Russia, Kazakhstan, Turkey, the Netherlands, Austria,
Argentina, the USA, Australia, Indonesia, and Mexico considered the most promising markets
May 2018 | 2018 ® FAMUR Group 11Significant new contracts in progress in 2018
Delivery of a ship-to-
Delivery of Finance lease with Longwall system, JSC FAMAK’s cooperation
shore unloading
a longwall system a delivery of new ARCELORMITTAL agreement with Hans system
PG Silesia conveyors, TEMIRTAU, Kunz GmbH FAMAK and TATA
Sp. z o.o. PGG S.A. Tentekskaya
PLN 50m STEEL IJMUIDEN BV
min. annual value (2017-
PLN 63m PLN 74m EUR 19m 2020)
EUR 13m
Delivery of a longwall Delivery of longwall
Deepening of shaft at Construction of system, OOO Delivery of roof
system OOO
KWK Pniówek PBSz Grzegorz shaft FAMUR Russia АО supports,
POLSKIE MASZYNY
S.A. and JSW S.A PBSz S.A. and UК SIBIRSKAJA, JSW S.A.
Inaglinskij complex,
TAURON Wydobycie Uvalnaya Yakutia
PLN 44m PLN 228m PLN 85m
EUR 17m EUR 22m
May 2018 | 2018 ® FAMUR Group 12Major events in 2018 YTD
Receipt of conditional offer to purchase PBSz S.A. shares from JSW
Increasing the flexibility of FAMUR Group financing in particular:
Execution of agreement with Bank Zachodni WBK S.A. for overdraft and foreign currency facility for
PLN 50m (up to 36 months)
Execution of agreement with Credit Agricole Bank Polska for credit facility for PLN 50m (until February
2021)
Execution of annexes to agreements with Bank Gospodarstwa Krajowego for PLN 40m overdraft
facility and PLN 42m guarantee line (extension by 36 months)
Repayment of liabilities under credit facility agreements with PKO Bank Polski S.A.
Approval of the FAMUR’s Information Memorandum by the Polish Financial Supervision Authority (PFSA) –
February 8th, 2018
Approvals of KOPEX demegrer by FAMUR and KOPEX Extraordinary General Meetings – April 2018
Registration of FAMUR’s share capital increase and KOPEX demerger (through transfer of a part of its assets
to FAMUR) by National Court Register
Execution of annexes to agreements with Raiffeisen Bank Polska S.A. (PLN 132.5m in total)
May 2018 | 2018 ® FAMUR Group 13Agenda 1. Introduction 2. 2017 financial highlights and key developments 3. Market environment 4. The Group’s development prospects
Positive global demand outlook

                        Demand
     Key markets        forecast                          Main products
                        vs 2017

                                   Complete range of products: longwall systems, conveyors,
       POLAND
                                   transport and handling systems, power systems

                                   Longwall systems, transport and handling systems,
RUSSIA AND KAZAKHSTAN
                                   transshipment machinery for open-pit mining

                                   Longwall systems, transport and handling systems,
       TURKEY
                                   transshipment machinery and machinery for the power industry

                                   Longwall systems, transport and handling systems,
        CHINA
                                   transshipment machinery and machinery for the power industry

                                   Longwall systems, transport and handling systems,
         US
                                   transshipment machinery and machinery for the power industry

      INDONESIA
                                   Surface transport and handling systems,                        According to the International Energy Agency
                                   transshipment machinery and machinery for the power industry
                                                                                                  (2017 report ), the volume of energy generated
        INDIA                      Complete range of products                                     from coal will increase from 9,282 TWh in 2016
                                                                                                  to 10,086 TWh in 2040, i.e. by 9% (CAGR of
 OTHER CEE COUNTRIES
                                   Surface transport and handling systems, transshipment          0.4%).
                                   machinery

    THE BALKANS                    Transport and handling / transshipment systems                 Coal will remain the main energy source for
                                                                                                  electricity production in China and India, and
 SOUTH AND CENTRAL
      AFRICA
                                   Complete range of products                                     Southeast Asia will triple the amount of electricity
                                                                                                  generated from coal.
 May 2018 | 2018 ® FAMUR Group                                                                                                                    15
Domestic market environment
Expected investments in Poland
For 2018, PGG is planning capex of PLN 2.56bn, including
CAPEX in the mining sector:
PLN 823m on access headings, PLN 411m on longwall
We expect to see a stronger flow of orders on improving conditions in solutions and PLN 1.32bn on other investments (in mine
the Polish market and growing demand for coal. workings, upgrades of coal processing plants, purchases of
machinery and equipment).
POLAND – INVESTMENT IN THE INDUSTRY (PLNm)
– 2016 vs 2018 Jastrzębska Spółka Węglowa (JSW) has planned its
overall capex for 2018-2030 at approximately PLN 18.9bn,
i.e. 1.45bn annually on average (based on JSW’s strategy).
~2,560
Bogdanka forecasts put its 2016-2025 capex (in nominal
~1,550 ~1,450
terms) at PLN 3.7bn in the base-case scenario and
approximately PLN 4bn in the flexible development scenario.
~400 According to the data presented in the Government
Total Capex PGG - JSW - Capex annually Bogdanka - Capex Programme for the Mining Sector until 2030, announced
sector '2016 Capex 2018 P / up to 2030P annually on January 23rd 2018, as of 2021 the average projected
/ up to 2025P
Source: the Company's estimates based on
expenditure on investments is to reach approximately PLN
available market data, data from coal companies 2bn.
May 2018 | 2018 ® FAMUR Group 16Assumptions of the PROGRAMME
for the Polish Hard Coal Mining Industry until 2030
adopted by the Polish Council of Ministers on January 23rd 2018
PROGRAMME FOR THE MINING KEY GOALS ORGANISATIONAL AND TECHNOLOGICAL
INDUSTRY UNTIL 2030 OF THE PROGRAMME CHANGES IN THE MINING INDUSTRY
drafting of a new Mining Law by profitability and financial liquidity – modernisation of the underground
2020 alignment of production with market infrastructure
implementation of the Smart Mine needs
Prospects for implementation of the
programme integration of the mining and power ‘Mine 4.0’ vision
budget subsidy totalling PLN sectors
3.99bn upgrade of the underground transport
investments to reach new deposits system
public aid of PLN 7.22bn for the and improve efficiency of the mining
mining sector creation of integrated mines
operations
establishment of the Mining gaining access to new deposits where
ensuring that coal demand in Poland is
Industry Steering Committee at coal extraction is economically viable
the Ministry of Energy fully met
New opportunities for all of the
undeveloped proved hard coal support for and development of clean
FAMUR Group operating segments
reserves, roughly estimated at 31bn coal technologies
tonnes, located in the Kraków, Lublin innovations and improvement of
and Katowice provinces
safety in the mines
OBJECTIVES ACTION AREA OPPORTUNITIES
May 2018 | 2018 ® FAMUR Group 17PROGRAMME for the Polish Hard
Coal Mining Industry until 2030
adopted by the Polish Council of Ministers on January 23rd 2018
Demand for hard coal to remain stable low-case scenario - minimum hard coal consumption levels
[million in Poland in the long term (2016–2030)
reference-case scenario - consumption of hard coal in the Polish
tonnes] market remains roughly at current levels
90
high-case scenario - development of the thermal coal market in
80 Poland, with coking coal consumption remaining stable
70 ELECTED KEY ASSUMPTIONS UNDERLYING THE
REFERENCE-CASE CENARIO:
60 Commercial power plants – increase in hard coal
consumption(+5.7m tonnes)
50 Cokemaking – no major changes
Households – decrease in consumption (-4.7m tonnes)
40
Thermal power stations – decrease in consumption
(-0.8m tonnes)
30
It has been assumed that the existing and any newly
constructed coal-fired power generating units will cover
no more than 50% of the growing demand for electricity
Adoption of the 200+ Programme (modernisation of all
low scenario reference- case scenario high scenario 200MW power generating units); timely completion of the
units in Jaworzno, Kozienice and Opole power plants
Implementation of the capacity market mechanism
May 2018 | 2018 ® FAMUR Group 18Agenda 1. Introduction 2. 2017 financial highlights and key developments 3. Market environment 4. The Group’s development prospects
15 years of market consolidation

                                                                  Stable high margin                                             Strategic market
                       Development of                                                           Diversification:
  Single product                           Famur’s IPO              revenue philar:                                              consolidation in
                     Underground product                                                       development of
 (shearer loader)                                               roadheaders operating                                                 region
                          porftolio                                                            Surface segment
                                                                         lease

     2002           2003          2005     2006          2007          2011             2012        2014           2015   2016         2017

 May 2018 | 2018 ® FAMUR Group                                                                                                               20
Prospects for further growth of the Group
2017 2018 2019+
Identification and recognition of risks Development and implementation of Leader of innovation in offered
Start of the margin recovery process the FAMUR Group strategy solutions
Work on the FAMUR Group’s global Increased margin on running contracts Increase in stable and high-margin
strategy revenue from aftermarket services and
Growth of investments in the mining
Launch of cooperation with the mines leases
industry – tenders for back-to-back
in the area of innovative solutions – Global development strategy
solutions
‘Mining 4.0’
Full synergies
Completion of the integration Goal:
processes Stronger GO GLOBAL expansion
Famur's presence on all continents of
Consolidation of market share key importance to the mining industry
INTEGRATION GROWTH GLOBALISATION
May 2018 | 2018 ® FAMUR Group 21Global development scenarios
Target markets Following market leaders
Organic growth
RUSSIA Organic growth investments – building new representative offices in the
foreign markets
TURKEY
INDONESIA
Strategic acquisitions
MEXICO
Acquisition of a foreign target – expansion of the know-how, production base
INDIA and sales markets
CHINA BFCTP SAS
USA
Strategic alliances / joint ventures
CANADA Agreements on joint operations in particular markets – expansion of
markets, mutual benefits for the partners
AUSTRALIA
Strategic Alliances /
acquisitions Joint Ventures
May 2018 | 2018 ® FAMUR Group 22Olga Panek
Investor Relations Director
opanek@famur.com
+48 32 359 65 05
+48 691 190 339
Thank you for your attention!
May 2018 | 2018 ® FAMUR Group 23You can also read