Vale Fertilizantes Business overview - Roger Downey - October 2015 - Vale.com

Page created by Keith Austin
 
CONTINUE READING
Vale Fertilizantes Business overview - Roger Downey - October 2015 - Vale.com
Vale Fertilizantes
Business overview – Roger Downey
October 2015
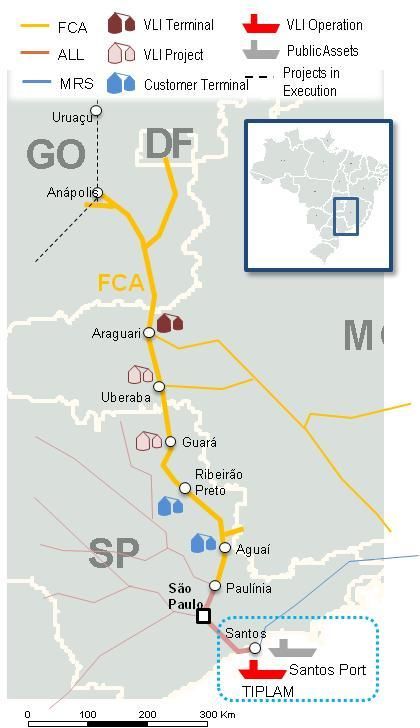
Vale Fertilizantes Business overview - Roger Downey - October 2015 - Vale.com
Table of Contents

1.   VF structure

2.   Market update

3.   Business model

                      2
Vale Fertilizantes Business overview - Roger Downey - October 2015 - Vale.com
1. VF corporate structure
Vale Fertilizantes Business overview - Roger Downey - October 2015 - Vale.com
Ownership structure

                                                                                                                      Potential partner

                                                                           Vale Fertilizantes

                               100%                                                                                               100%
                                    Brazil                                                                            International
                              (Vale Fertilizantes                                                                     (Stand alone                                Potential
                                 operations /                                                                           projects /                                partners
                                   projects)                                                                           operations)

           100%               100%                  100%            100%                                             40%(1)            100%(2)

                                                        G                  G                                                  B                               G
 Phosphates and            Taquari-                                                                      Bayovar I&II                      Kronau
                                           Patrocínio       Carnalita
    Nitrogen              Vassouras                                                                        (Peru)                         (Canada)

                                          49%(3)

                                                              Potash                                              Phosphate                                                B Brownfield
                                   TIPLAM
                                                              Logistics                                     G Greenfield                                                        Legal entity

Source:   Company data.

                                                              (1)       Vale has 51% of voting rights (control).
                                                              (2)       Vale is currently discussing the potential sale of a minority stake in Kronau.
                                                              (3)       The remaining 51% is held by VLi – a subsidiary controlled by Vale. VF’s share may be diluted as a result of an        4
                                                                        expansion project, but VF would retain its current commercial and political rights.
Vale Fertilizantes Business overview - Roger Downey - October 2015 - Vale.com
2. Market update
Vale Fertilizantes Business overview - Roger Downey - October 2015 - Vale.com
We believe in a strong fertilizer market

                          Supply side                                                  Demand side

      Publicly available estimates overestimate production         Population growth, mostly in Asia and Africa, should
       capacity for fertilizers                                      boost food supply needs

                                                                    Rising developing countries income, especially in
      Historical data shows that the market has never reached
                                                                     BRIC’s and other Asian, is expected to shift food
       “full capacity”, even in boom years
                                                                     consumption habits

      Depletion/decrease in grades of current mines is not         Tight availability of arable land and water resources
       fully factored into market estimates                          should boost fertilizer usage to cope with food demand

      Several projects in the supply pipeline are actually         Available estimates for future grain production growth
       unlikely to be implemented, or should suffer delays           are very conservative

There are healthy fundamentals for the global fertilizer sector

                                                                                                                              6
Vale Fertilizantes Business overview - Roger Downey - October 2015 - Vale.com
By 2030, grain production must increase significantly to
meet global food demand

                                                                 Annual per capita consumption (tons per capita)

     World grain production growth assuming FAO’s
                                                                    0.34          0.36    0.32       0.36       0.38
 1   estimates - implicitly assumes deterioration of
     food habits
                                                                 Global grain production (bn tons)

                                                                                                                       3,2
                                                                                                             0,2
                                                                                                     0,3    CAGR
                                                                                                                                 0.7
                                                                                                             1.3%
                                                                                          0,2    CAGR
     World grain production growth assuming
 2   maintenance of current per capita consumption               CAGR
                                                                                         CAGR
                                                                                          0.5%
                                                                                                  1.0%

                                                                  1.6%     0,9

                                                                                   2,5                                 2,5

     World grain production assuming increase in                    1,5
 3   meat consumption per capita

                                                                   1980           2010     1          2         3      2030

                                             Source: FAO, Company data.
                                                                                                   Additional
                                                                                                                             7
                                                                                                 information
Vale Fertilizantes Business overview - Roger Downey - October 2015 - Vale.com
We don’t believe that there will be excess capacity in either
the phosphate…
Global phosphate rock capacity evolution

 (Mtons)
                                                                                                                                                                                358
                                                                                                                                                                                     2
                                                                                                                                                                                80
                                                                                                                        66                  ?                270
           251                 (35)
                                                      216                    (27)                   15

                                                                                                                                                                                278

    Current Ops          Utilization rate          Current              Exhaustion             Brownfield           Greenfield       Low probability      Operational       Demand
     + ramp-up            adjustment¹              capacity                                    expansion            expansion           projects         capacity 2030       2030
1 – Nominal capacity adjustment to operational capacity considers 2007 demand peak deflator utilization rate.
2 – Additional potential demand assuming growth in meat consumption per capita (= 2x grain growth – FAO base).

Global phosphate rock utilization rate

                          CAGR Demand ‘14 – ’30 = 2.2%                                       CAGR Demand ‘15 – ’19               CAGR Demand ‘20 – ’24         CAGR Demand ‘25 – ’29
                                                                                                         1.8%                           2.5%                             2.5%
120%                                                                                                                                                                     111%
                                                                                                                                         99%
                           94%                                   91%                                     90%
100%

  80%                                                                                                                                                                    96%
                           81%                                                                                                           85%
                                                                 78%                                     77%
  60%

  40%

  20%
                                                                          Adjusted Utilization Rate                  Utilization Rate
   0%
                      2005 - 2009                           2010 - 2014                            2015 - 2019                       2020 - 2024                    2025 - 2029

                                                                                 Source:   Company data, CRU, IFA, Fertecon.
                                                                                                                                                                                         8
… or the potash markets
Global potash capacity evolution

 (Mtons KCl)

                                                                                                                                                                             112
                                                                                                                                                                                  2
                                                                                                                      19                (5)                                  25
                                                                                                                                                           85
          80                   (10)
                                                       70                    (6)                     7

                                                                                                                                                                             87

    Current Ops          Utilization rate          Current              Exhaustion             Brownfield        Greenfield       Low probability      Operational       Demand
     + ramp-up            adjustment¹              capacity                                    expansion         expansion           projects         capacity 2030       2030
1 – Nominal capacity adjustment to operational capacity considers 2004 demand peak deflator utilization rate.
2 – Additional potential demand assuming growth in meat consumption per capita (= 2x grain growth – FAO base).

Global potash utilization rate

                          CAGR Demand ‘14 – ’30 = 2.7%                                       CAGR Demand ‘15 – ’19            CAGR Demand ‘20 – ’24         CAGR Demand ‘25 – ’29
                                                                                                         3.6%                        2.4%                             2.2%
120%
                                                                                                                                                                      96%
100%                       92%                                                                           88%                          89%
                                                                 85%
  80%
                           81%                                                                                                                                        85%
                                                                 75%                                     77%                          78%
  60%

  40%

  20%
                                                                         Adjusted Utilization Rate                Utilization Rate
    0%
                     2005 - 2009*                           2010 - 2014                           2015 - 2019                     2020 - 2024                    2025 - 2029

                                                                                * Does not include 2009.
                                                                                Source: Company data, CRU, IFA, Fertecon.                                                             9
3. Business model
Vale Fertilizantes
Investment highlights

Brazil is the market to be in for                                                  VF is the leading platform to play
fertilizers                                                                        the Brazilian fertilizer market
    Brazil is the only country able to                                                VF is the largest domestic
     respond to the food challenge in a                                                 producer of fertilizers by a long
     significant way
                                                                                        way (7x larger than the second-
    Increasing grain production from                                                   largest player)
     high land availability and
     continuous growth in land                                                         Unique combination of integrated
     productivity (fertilizers &
                                                                                        logistics and proximity to key
     technologies)
                                                                                        consumer regions
    Most of the global growth in
     fertilizer consumption in the                                                     Vale brand name
     coming years should come from
     Brazil                                                                            Cost-cutting initiatives and
    Significant advantages for local                                                   improved sales policies
     producers vis-à-vis foreign
     players                                                                           Outstanding pipeline of projects

 Vale Fertilizantes is uniquely positioned to benefit from the strong tailwinds in the fertilizer sector in Brazil

                                               Source:   Company.
                                                                                                                            11
Brazil has unique advantages in agriculture production…
Brazil has unique advantages when it comes to agriculture…                   … resulting in its leadership position in this segment

                                                                           Crop                        Production     Exports   % of global exports

               Appropriate soil for farming
                                                                                                              2
                                                                                                             #2
                                                                                                                         2
                                                                                                                        #1             39%
                                                                             Soybeans

               Regular rainfall
                                                                                                              3
                                                                                                             #3          2
                                                                                                                        #2             19%
                                                                             Corn
               All-year-round crops
                                                                                                             1
                                                                                                             #1
                                                                                                                         1
                                                                                                                        #1             29%
                                                                             Coffee
               Competitive farming costs
                                                                                                             1           1
                                                                                                             #1         #1             77%
                                                                             Orange juice
               Low cost of land
                                                                                                              2          1
                                                                                                                        #1             22%
               Advanced technology                                           Meat

                                                                                                             1           1
                                                                                                             #1         #1             45%
               Qualified labor                                               Sugar

                                                                                                              2          1
                                                                                                             #3         #1             34%
               Stable regulatory environment
                                                                             Poultry

 Brazil’s leading role in global agriculture production is assured by its unique competitive advantages

                                                   Source:   Company data, United States Department of Agriculture.
                                                                                                                                                12
… and is the only country positioned to meet to the
         growth in global demand for grains
 Arable land: potential                                                                                                                               Climate: temperature, rainfall,
 for expansion                                                                                                                                        and topography
(m ha)                                                                                                                                                         Hours of day light
                                                                                                                      Australia
   USA               188             81                                                                                                                        16
                                                                             Argentina
   India            169                                                                                                              China                     14

 Russia            132         88                                                                     Brazil
                                                                                                                                                               12
                                                                     EU
     EU         116            144                                                       Russia
                                                                                                       USA                                 India               10
  China            138
                                                                                                                                                                8
                                                                                    Canada

                                                                                                                                                                    May
                                                                                                                                                                    Aug
                                                                                                                                                                    Sep

                                                                                                                                                                    Feb
                                                                                                                                                                    Mar
                                                                                                                                                                    Apr
                                                                                                                                                                    Oct
                                                                                                                                                                    Nov
                                                                                                                                                                    Dec
                                                                                                                                                                    Jan

                                                                                                                                                                    Jun
                                                                                                                                                                     Jul
  Brazil      58         106              222

           Planted area                                                                                                                                                  Brazil     China
           Expansion potential                                                                                                                                           India      USA
           Pasture with agriculture potential                                                                                                                            Equator
                                                                                         Indonesia                 Peru
                                                                                                     Colombia

                                            % of world's total fresh water

                                                 15%

                                                                8%
                                                                               6%          5%           5%           5%           4%           4%              3%

                                            Water: Availability of fresh water

   Brazil is the only country able to respond to the food challenge in a significant way

                                                                                     Source:    Company data, FAO, ANDA, USDA, CRU, Sinprifert, Agroconsult.
                                                                                                                                                                                            13
Brazil is expected to boast the highest growth rates
      in the global fertilizer sector
 Phosphate demand(1)                                                                  KCI demand(2)

(mt P2O5)                                              CAGR                          (mt KCl)                                                                CAGR
                                                      2013-2018                                                                                             2013-2018

                                  51.3                  1.7%                                                                       67.3                        5.0%
             47.0                                                   Others                                                                                              Others
                                                        1.4%                                                                                                   4.0%
                                  16.2                                                              52.6                           22.1
            15.2                                        2.8%        FSU                                                                                       17.4%     India
                                  1.7                                                               18.2                            6.4
             1.5                  8.3                   2.7%        India                                                                                      3.9%     FSU
             7.2                                                                                    2.9                             4.5
             4.7                  5.2                   2.2%        Brazil                          3.7                             9.3                        2.2%     US
             4.6                  5.0                                                               8.3
                                                        1.7%        US                                                             11.3                        6.1%
                                                                                                    8.4                                                                 Brazil
            13.9                  14.9
                                                        1.4%        China                           11.1                           13.8                        4.4%     China
            2013E                2018E                                                            2013E                            2018E

Intensity of fertilizer consumption in Brazil

        Fertilizer consumption (kg nutrients / ha)
                                                                                       Potential increase in fertilizer consumption (mt nutrients)

                                                306                            Current                              Growth factor                         Potential demand
                                                                               consumption                   x      (Multiplier)                  =       Mt nutrients
                                                                               Mt nutrients
                                     200                                                            12.6                                   3.1                           38.7

                                                                                                                               x
                                   185
                                                                                                  Nutrient intensity                        Arable land
                                                                                                   at USA levels                            expansion
                           133                                                                         (1.09x)                            potential (2.83x)

   VF is strategically positioned to capture the growth in Brazil's fertilizer demand and increase its market share

                                                         Source:    Fertecon, Company data, IFA, CRU, companies data.
                                                         (1)       Total phosphate consumption includes MAP, DAP, TSP, SSP, rock for direct application and other          14
                                                                   phosphates.
                                                         (2)       KCl deliveries.
Brazil market structure provides significant cost
      advantages to the local fertilizer producer
Logistics to Brazil

 Illustrative export logistics cost to Brazil

                                                Seaborne shipping costs                                                               US$25–30/t(1)

                                                Port charges                                                                          US$15–20/t(2)

                                                Truck to inland blenders                                                              US$40–50/t(4)

                                                Total delivered cost                                                                 US$101–121/t

                                                           Source:   Company data, CRU, industry research reports.
                                                           (1)       Vancouver / Baltic Sea.
                                                           (2)       Paranaguá Port.                                                                                             15
                                                           (3)       AFRMM is Additional Freight for Renewal of the Merchant Navy: a tax imposed on inbound Brazilian freight (CRU).
                                                           (4)       Paranaguá to Mato Grosso.
Brazilian market – Testing our business model
Delivery

                  -6.4%

         19.828                   -8.7%
                     18.559                                  -9.4%            -10.2%                 -6.9%

                              8.607          7.858
                                                     2.349        2.129    2.971       2.669   3.287         3.060

             Products                 NPK                     N                    P2O5                K2O

Production

                  4.6%

         5.691        5.952
                                      7.1%                   19.6%             3.4%
                                                                                                     3.4%
                              1.902          2.037
                                                                           1.293       1.337
                                                     437             523                       171           177

             Products                 NPK                     N                    P2O5                K2O

Import

               -10.4%
         15.917                   -11.7%
                    14.264
                                                           -12.9%              -7.2%              -13.6%
                              8.160          7.205
                                                                                               3.870         3.345
                                                     2.117        1.844    2.173       2.016

             Products                 NPK                     N                    P2O5                K2O

     2014 (Jan-Aug)
                                                                                                                     16
     2015 (Jan-Aug)
Vale Fertilizantes is the leading fertilizer producer in the
 country by a long way
   Phosphate capacity in Brazil (P2O5)                                                      VF highlights

  (kt)
         1.950
                                                                                            Largest
                                                                                                                            ~7x larger than the 2nd local
                                                                                            fertilizer
                                                                                                                             producer in phosphates
                                                                                            producer in                     Only potash producer in the
                                                                                            Brazil'                          country
                            284                   219                    224
                                                                                                                            ~50% market share in the
                                                                                                                             Southeast & Central-West regions
                                                                      Other
                                                                                            Vertically
   Fertilizers market share in Brazil (total supply, 2014)
                                                                                            integrated
                                                                                                                            Operations throughout the
                                                                                                                             production chain, from potash and
                                                                                                                             phosphate rock mining to end-
   Phosphate (P2O5)                                     Potash
                                                                                                                             product manufacturing
                                                                         Imports
                                   31%                                     95%

                                                                                            Own port
                                      Local
                                    production
                                       38%                                                                                  Dedicated private port terminal
Imports                                                                                                                     Strategically positioned
 62%                                   81% Vale
                                                                                                                            Capacity of 2.8Mtpy
                                    Other local                     5%
                                    producers
                                       7%

   VF is uniquely positioned to benefit from the positive fertilizer sector dynamics in Brazil

                                                          Source:    Fertecon, Company data, IFA, CRU, companies data.
                                                                                                                                                                 17
Assets strategically located next to the region with the
greatest potential for fertilizer consumption
                                                                         Advantages of VF’s geographic footprint

                                                                             Exposure to the Cerrado region
                                                                                … region with the highest growth prospects in the
                                                                                 country in the coming years

                                                                             Strong price competitiveness
                                                                                Logistics advantages versus imports
                                                     CTV

                                                                             Just-in-time deliveries
                      Catalão
                                  Patos de Minas                                … to a significant portion of its customers
                    Uberaba          Araxá
                       Guará        Tapira

 Mine                    Cajati                                              Long-term relationship with customers
 Plant                            Cubatão/Piaçaguera                            Close relationships with customers in the main
                                  (Plant & Port)                                 agricultural regions of Brazil
 Cerrado

 Region with the
 highest growth                                                              Integrated logistics
 prospects in the                                                               Own and third party infrastructure, which further
 coming years                                                                    strengthens VF’s fertilizer distribution

                                     Source:   Company data, BPI, CONAB, MAPA EMBRAPA, IBGE.
                                                                                                                                     18
Unique integrated logistics infrastructure and distribution
        capabilities…
    VF’s logistics corridors

                                                                                                                                          Ponta da Madeira port
                                                                                                                                             Itaqui port

                                                                                               PA                              MA

     VLI / VALE`s Railroads

            EFVM – Ferro Vitória to Minas highway
                                                                                                                                                            SE
            EFC – Ferro Carajás highway
                                                                                                                                    BA
            FNS – Norte Sul railroad
                                                                                                                                                           Inácio
            FCA – Centro-Atlântica railroad                                                                                                                Barbosa
                                                                                                                                                           port
            Opportunities
            ALL

            Vale’s ports                                                                                                        MG
                                                                                                                                          ES
            Third-party ports

            Cerrado                                                                                                                            Tubarão port
                                                                                                            SP
                                                                                                                                     RJ
            Region with the highest growth
            prospects in the coming years
                                                                                                                                 TIPLAM (Santos)
                                                                                                                                 (JV between VLi and VF)

    Vale’s logistics portfolio in Brazil also includes 11,271km of railroads (directly and indirectly)

    VF benefits from Vale's significant logistics infrastructure to distribute fertilizers in Brazil

                                                               Source:   Company data.
                                                               (1)       TIPLAM is 49% owned by VF and 51% by VLI, a company controlled by Vale.                     19
…with a dedicated port terminal in Santos that brings an
unparalleled competitive advantage to foreign supply

                          Key advantages                                                       Geographic footprint
                          Private, mixed-use port terminal located outside the public port
                           of Santos concession area

                         Strategically positioned with available area for further expansion

                         One of the two ports in Brazil that can handle ammonia, but the
                          only one with scale

                     Road and rail access (ALL, MRS and FCA) with high productivity

                     75% of total sulfur imports in Brazil

                  Adapted to handle phosphate rock

                 Located near to 4 units of Vale Fertilizantes that could be used as
                  backyard

              Expansion project

              Expansion project underway with expected Capex of R$2.2 bn

             Potential to double capacity by adding an additional fertilizer berth of
              2.8 Mtpa

             Terminal also provides additional capacity for general cargo

         Three new warehouses for grains and one for sugar, and a flexible
          storage unit that can hold both sugar and grains

                                                    Source:   Company data.
                                                                                                                      20
We are doing our homework
Improvements in sales policies (actual gains in 2014)                             Cost-cutting initiatives (actual savings in 2014)

          Price increases for gypsum                                                        Chemical and
                                                                                                                               US$10 mm
          +US$27 mm                                                                         technical factors

                                                                                            Lower freight
          Premium increases for ammonium                                                                                       US$11 mm
                                                                                            costs
          nitrate
          +US$11 mm

                                                                                            Services                           US$21 mm
           Revised methodology for allocation
           of shipping costs in the fertilizer segment
           +US$17 mm
                                                                                            Lower cost of rock                 US$9 mm

           Increased premiums for nitric acid
           /ammonia
           +US$5 mm
                                                                                            Labor
                                                                                                                               US$10 mm
                                                                                            optimization

           Strategy for capturing a premium in the
           animal nutrition segment                                                         General expenses
                                                                                                                               US$15 mm
           +US$12 mm                                                                        and others

                                                        Source:   Company data.
                                                                                                                                          21
World-class expandable resource base, underpinned by
a broad pipeline of projects

K        Kronau
    Capacity: 4.0 Mtpa of potash
    Reserves: 621mt @ 29.1% KCl
                                                                  K       Carnalita
                                                                     Capacity: 1.4 Mtpa of potash
                                                                     Reserves: 302mt @ 12.2% KCl

     P       Bayovar II
     Capacity: 1.9 Mtpa of p-rock
     Reserves: 409mt(2) @ 15.4% P2O5
                                                                      P   Patrocínio
                                                                     Capacity: 1.3 Mtpa of phosphate
                                                                      rock
                                                                     Reserves: 486mt @ 12.1% P2O5

    Potash        Phosphate

                                        Source:   Company data.
                                                                                                        22
Key takeaways

     Brazil is an agriculture powerhouse and the world’s most attractive fertilizer market

     There are significant advantages for local producers vis-à-vis foreign players

     Vale created a leading platform to tap the Brazil market, with a unique combination of assets strategically
     located close to main agricultural frontiers in Brazil and an unparalleled integrated logistics infrastructure

     Constant improvements in sales policies and cost-cutting measures will assure the company’s increased
     profitability

     A strong pipeline of world-class projects to serve the fast growing Brazilian market will assure the company’s
     growth going forward

                                                                                                                      23
You can also read