COMPANY PRESENTATION ANDRITZ GROUP - JUNE 2019
←
→
Page content transcription
If your browser does not render page correctly, please read the page content below
COMPANY PRESENTATION
       ANDRITZ GROUP

           JUNE 2019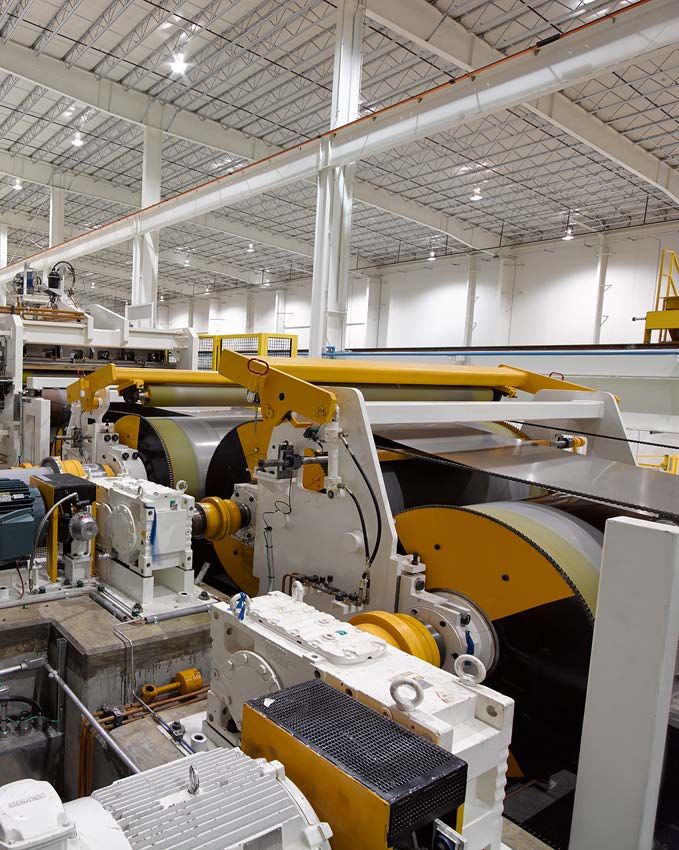
CHAPTER OVERVIEW

01             ANDRITZ GROUP OVERVIEW
                                                                   06   LONG-TERM TARGETS AND
                                                                        STRATEGY

02             HYDRO

03             PULP & PAPER

04
05             SEPARATION

2 / ANDRITZ / COMPANY PRESENTATION / JUNE 2019 / © ANDRITZ GROUP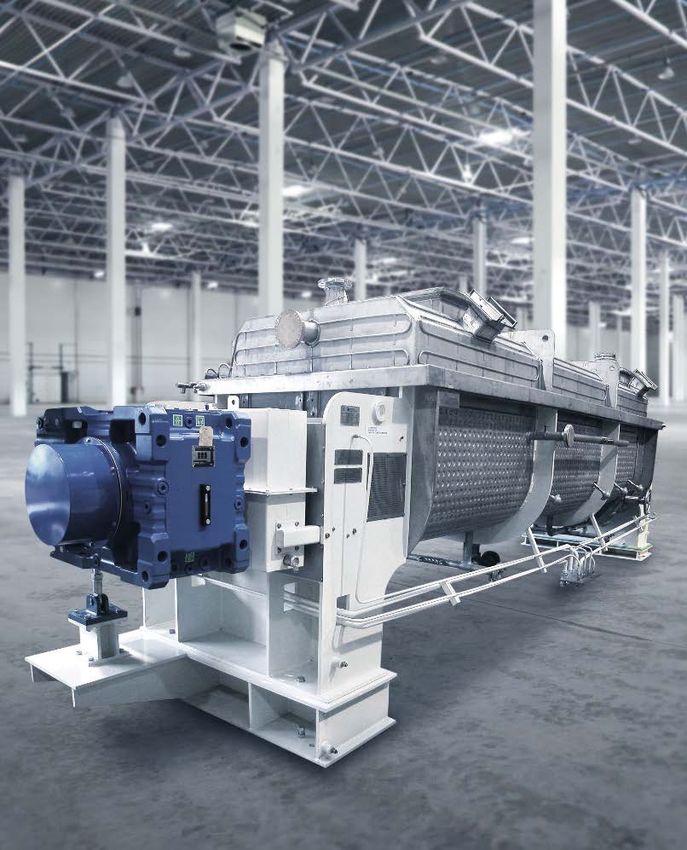
THE ANDRITZ GROUP

ANDRITZ is a globally leading supplier of plants, equipment, systems and services for hydropower stations, the pulp and
paper industry, the metalworking and steel industries, and solid/liquid separation in the municipal and industrial sectors as
well as for animal feed and biomass pelleting.

Global presence
Headquarters in Graz, Austria; over 280 production sites and service/sales companies worldwide.

                                                                                                        SALES BY REGION 2018 (%)
KEY FINANCIAL FIGURES:

                                                        UNIT       Q1 2019     2018
Order intake                                            MEUR       1,658.1   6,646.2                                               Emerging
                                                                                                                                   markets:
Order backlog (as of end of period)                     MEUR       7,260.9   7,084.3        Europe &                               41%
                                                                                       North America:            6,031
Sales                                                   MEUR       1,489.2   6,031.5                             MEUR
                                                                                                59%
Net income (including non-controlling interests)        MEUR          32.6    219.7
Employees (as of end of period; without apprentices)    -           29,398   29,096

3 / ANDRITZ / COMPANY PRESENTATION / JUNE 2019 / © ANDRITZ GROUP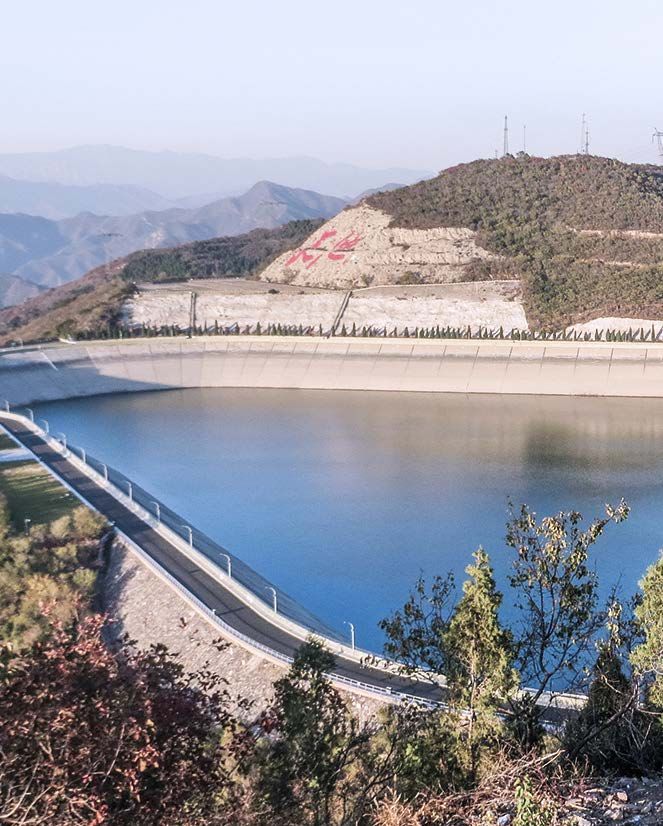
A WORLD MARKET LEADER
WITH FOUR BUSINESS AREAS

                   PULP & PAPER                                       METALS                             HYDRO                     SEPARATION

                            39                                     29                             22                              10
                    % order intake*                            % order intake*                   % order intake*                  % order intake*

                    PRODUCT OFFERING                           PRODUCT OFFERING                  PRODUCT OFFERING                 PRODUCT OFFERING
                    Equipment for production of                Presses/press lines for metal     Electromechanical equipment      Equipment for solid/liquid
                    all types of pulp, paper,                  forming (Schuler); systems for    for hydropower plants            separation for municipalities
                    tissue, and board; energy                  production of stainless steel,    (turbines, generators); pumps;   and various industries;
                    boilers.                                   carbon steel, and non-ferrous     turbo generators.                equipment for production of
                                                               metal strip; industrial furnace                                    animal feed and biomass
                                                               plants.                                                            pellets.
                    * Share of total Group order intake 2018

4 / ANDRITZ / COMPANY PRESENTATION / JUNE 2019 / © ANDRITZ GROUP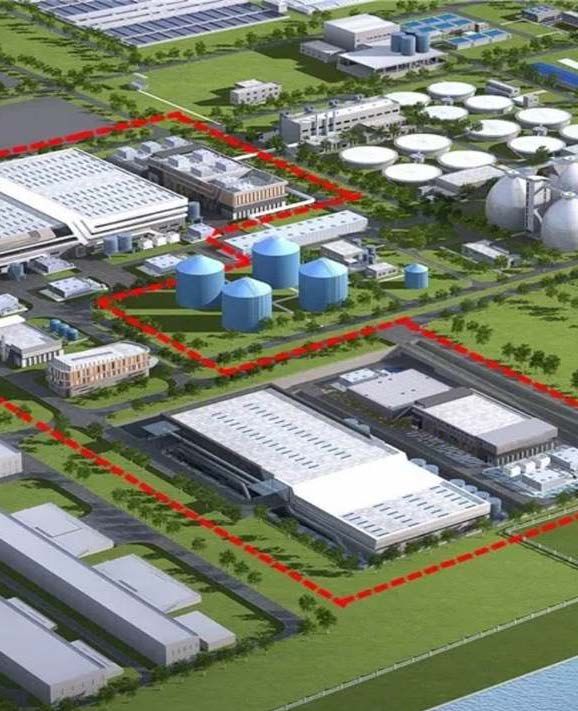
LONG-TERM GROWTH BASED ON ACQUISITIONS
AND ORGANIC EXPANSION

Growth evenly split between organic expansion and acquisitions

                                                                                   6,646
                                                                                                                                           6,377
                                             6,101    6,018                         660                                                            6,039           6,031
                                                                                                                                   5,859                   5,889
                  5,707             5,611                      5,569       5,580                                           5,711
                                               666
                                      273               832                                                        5,177
                                                                   393     117
                           4,924
                   1,423                                                                                   4,596
                            710
         4,132
          450                                                                                      3,554
3,349                                                                                      3,198
 494                                                                               5,986
                                     5,338    5,435    5,186               5,463
                                                                   5,176
                   4,284    4,214
         3,682
 2,855

 2009    2010      2011     2012     2013     2014     2015        2016    2017    2018    2009    2010    2011    2012    2013    2014    2015    2016    2017    2018

                      Order intake (MEUR)       Orders >100 MEUR                                                           Sales (MEUR)

5 / ANDRITZ / COMPANY PRESENTATION / JUNE 2019 / © ANDRITZ GROUP
2018 WAS A VERY ACTIVE YEAR WITH REGARD TO
EXTERNAL GROWTH
Seven acquisitions; foundation of a cybersecurity company in Israel

                                                 • About 3,100 employees
                                                 • Annual sales of more than 500 million Euros
                                                 • Extension of the ANDRITZ product portfolio,
                                                   mainly in the stable service business          XERIUM
         DIATEC S.R.L.                                                                            TECHNOLOGIES, INC.

                               OTORIO LTD

                                                                       ASKO, INC.

  HMI CANADA INC.

                                             FARINA PRESSE S.P.A.                                 NOVIMPIANTI DRYING TECHNOLOGY S.R.L.
                                                                                    PSIORI GMBH

6 / ANDRITZ / COMPANY PRESENTATION / JUNE 2019 / © ANDRITZ GROUP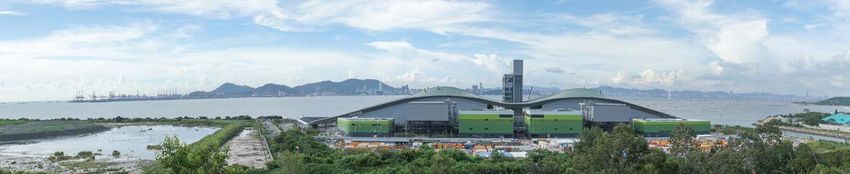
RISING SHARE OF SERVICE BUSINESS

Service business increased in absolute and relative terms                             Share of service sales by business area (Q1 2019)

IN MEUR
                                                                                              Hydro                 Pulp & Paper
                                                    2,010       2,155      2,319
                          1,892        1,930
              1,670                                                                                    26%

                                                                                                                                   57%
               2014        2015         2016         2017           2018    Last 4
                                                                           quarters

                                                                                              Metals                 Separation
                                                                              40
                                                      34             36                                25%
% OF            29           30          32
TOTAL
SALES                                                                                                                              46%

               2014         2015         2016        2017           2018   Q1 2019

 7 / ANDRITZ / COMPANY PRESENTATION / JUNE 2019 / © ANDRITZ GROUP
EBITA MARGIN FOR THE GROUP AND
BY BUSINESS AREA
2014-2018 (in %)                                                                                            Long-term
                                                                                                                                                              Long-term
                                                                                                                                                                goal:
                                                                                                               goal:
                                                                                                                                                                >8%
                                                                                                            8.5-9.0%
ANDRITZ GROUP                                                                         HYDRO                                         PULP & PAPER
                                                                                                                                    8.7*       8.7      9.5        9.9
                                                                          8.3      7.9                7.8        7.9%**
                                                                                             7.3
                                                                                                                                    6.9%**
                                                                                                                7.5*       5.2

                                           7.3   7.5*
                         7.3%**
                                                 7.1%**         6.9%**
       6.5
                         6.7*                                            2014     2015      2016     2017       2018      2014      2015     2016      2017       2018
                                                                6.5*                                                      Improved profitability in capital as well as
                                                                         Stable profitability despite drop of market
                                                                         volume by one third.                             service business growth.

                                                                                     METALS                  Long-term                SEPARATION           Long-term
                                                                                                                goal:                                         goal:
                                                                                   8.6%**                    6.0-7.0%                                      8.0-9.0%
                                                                          7.1                7.2
                                                                                                       6.0
                                                                                                      4.6%**                                            4.6        4.8
                                                                                                                           3.7       3.6
                                                                                                                                               2.9
                                                                                  4.1*                           2.5%**

                                                                                                                1.7*
                                                                         2014     2015      2016      2017      2018      2014      2015     2016      2017       2018

      2014              2015              2016   2017          2018      Weak global automotive market and                Profitability turnaround continuing.
                                                                         underabsorption in Germany.
* EBITA margin reported
**EBITA margin adjusted by extraordinary items
 8 / ANDRITZ / COMPANY PRESENTATION / JUNE 2019 / © ANDRITZ GROUP
DEVELOPMENT OF LIQUID FUNDS AND
NET WORKING CAPITAL

 IN MEUR

                                                                            Acquisition of Xerium   IN MEUR
2,350               LIQUID FUNDS / NET LIQUIDITY                                                                                 NET WORKING CAPITAL
                                                                                (~770 MEUR),
                                                                           inclduding redemption
                                2,048                                        of 480 MUSD bond         300
                                          Acquisition of Schuler
                                             (~600 MEUR)                                                               Increase mainly due to:
                                                                                                                                                                       183.4
                        1,815                                              1,772                      200              • Xerium working capital (+100 MEUR)   160.5
1,850
                                                 1,702                                                                 • Reduction of POC payables
                1,595                                                                                 100
                                        1,517                      1,507                   1,475
                        1,401                             1,449

1,350                           1,286                                              1,280                0
                1,177                                                                                         2014
                                                                                                              2014           2015        2016         2017    2018    Q1 2019
        1,082                                    1,065
                                                                                                     -100
                                                                    945
                                                                            908                                                                       -121
                                                           984                                       -200
 850                                     893                                                                                 -182.1
                                                                                                                                         -215.8
         678
                                                                                                     -300

 350                                                                                                 -400

                                                                                                     -500
                                                                                             -72
 -150   2009    2010    2011    2012    2013     2014      2015    2016    2017    2018      Q1
                                                                                                     -600     -570.9
                                                                                            2019
                                                                                   -100
                                  Liquid funds           Net liquidity                               -700

 9 / ANDRITZ / COMPANY PRESENTATION / JUNE 2019 / © ANDRITZ GROUP
CHAPTER OVERVIEW

01              ANDRITZ GROUP OVERVIEW
                                                                    06   LONG-TERM TARGETS AND
                                                                         STRATEGY

02              HYDRO

03              PULP & PAPER

04
05              SEPARATION

10 / ANDRITZ / COMPANY PRESENTATION / JUNE 2019 / © ANDRITZ GROUP
HYDRO: UNCHANGED MODERATE MARKET
ENVIRONMENT
Selective award of individual projects, particularly in the growing Asian market
ANDRITZ supplied equipment for the pumped storage
• New hydropower plants hydropower plant Shi Shan Ling, China.
Some new, larger projects are currently in the planning phase, especially in
Southeast Asia and Africa; selective award of individual projects is likely.
• Pumps
Satisfactory project activity.
• Modernizations/rehabilitations
As a result of the continuing low investment activity by utilities, many
modernization projects are still postponed, particularly in Europe.
• Competition
Stable competition at challenging level.
11 / ANDRITZ / COMPANY PRESENTATION / JUNE 2019 / © ANDRITZ GROUPGLOBAL HYDROPOWER CAPACITY EXPECTED TO
GROW SLIGHTLY IN THE LONGER TERM
Average annual growth of 2.4% expected for 2018-2030E
CAGR 2018-2030E: +2.4% 2018: more than 76% of total hydropower capacity related to large conventional hydropower plants with a
capacity of 952 GW. The remainder related to small hydro and pumped storage capacities at 138 GW and
■ Small hydro +2.5% 157 GW respectively.
■ Pumped storage +4.1%
1,663
1,629
■ Large conventional hydro* +2.1% 1,555
1,592
1,516
1,476
*) turbines > 30 MW 1,435
1,398
1,364
1,274 1,303 1,334
1,223 1,247
1,170 1,203
1,137
1,070 1,097
1,003 1,036
969
933
868 900
822 844
767 777 799
758
2000 2001 2002 2003 2004 2005 2006 2007 2008 2009 2010 2011 2012 2013 2014 2015 2016 2017 2018 2019E 2020E 2021E 2022E 2023E 2024E 2025E 2026E 2027E 2028E 2029E 2030E
Source: GlobalData
12 / ANDRITZ / COMPANY PRESENTATION / JUNE 2019 / © ANDRITZ GROUPGLOBAL HYDROPOWER MARKET DECLINED BY ONE
THIRD SINCE PEAK IN 2011
Cost structures adjusted to market decline
9,000 100% HYDRO EMPLOYEES
8,300 -33%
8,000 -16%
8,339 8,230 7,260 7,237
8,000 90%
7,285 7,469 7,445
7,400 7,002
7,200
7,000 80%
7,000 6,800
ANDRITZ Hydro market share [%]
6,400
6,000 5,900 70%
6,000 5,600 5,600
5,100 60%
5,000
Market (MEUR)
50% 2011 2012 2013 2014 2015 2016 2017 2018
4,000
40%
34% HYDRO DIRECT LABOR HOURS
3,000
26% 30%
24% 23% 2,978 2,656 2,791 2,808 2,673 2,588 2,522 -22%
22% 22%
19% 20%
2,000 24% 17% 18% 2,334
15% 20%
1,000 10%
0 0%
2007 2008 2009 2010 2011 2012 2013 2014 2015 2016 2017 2018
World
World Order intake
Andritz HYDROANDRITZ Hydro
Total E&M OI ANDRITZ
Andritz market
market share
share 2011 2012 2013 2014 2015 2016 2017 2018
(based on order intake)
Source: ANDRITZ
13 / ANDRITZ / COMPANY PRESENTATION / JUNE 2019 / © ANDRITZ GROUPGOOD PIPELINE FOR LARGE-SCALE HYDRO
PROJECTS
Average investment cost for hydropower equipment: ~250-500 MEUR / GW
(amount per GW depends on scope of supply)
Planned projects Country GW total plant Decision time frame
Caculo Cabaca Angola 2.1 2019
Koysha (Gibe IV) Ethiopia 2.3 2019
Carillon Rehab Canada 0.6 Next 1-2 years
Dasu Pakistan 2.2 Next 1-2 years
Rogun Tajikistan 2.4 Next 1-2 years
Nurek Rehabilitation – Phase 2 Tajikistan 2.2 2021
Itaipu - Automation Brazil -- Next 1-3 years
Upper Cisokan Indonesia 1.0 Next 1-3 years
Hatta Pumped Storage U.A.E. 0.3 2019
Pfaffenboden Austria 0.3 Next 1-3 years
Grand Coulee Units G19-G21
United States 1.8-2.3 Next 2-3 years
Turbine upgrade/rehabilitation
Koralm Austria 0.9 Next 3-5 years
Demwe Lower India 1.9 Next 3-5 years
Grand Coulee Units G1-G18 Rewinds United States 1.8-2.3 Medium to long term
Inga 3 Congo 4.8 Medium to long term
14 / ANDRITZ / COMPANY PRESENTATION / JUNE 2019 / © ANDRITZ GROUPFAVORABLE MODERNIZATION POTENTIAL
Over one third of world hydropower capacity was originally commissioned more than 40 years ago
Global hydropower capacity ~1,200 GW, thereof ~440 older than 40 years
Average: 36% more than 40 years old
North/Central America 132 GW older than 40 years 67%*
Europe 177 GW 57%
Asia (without China) 56 GW 31%
Africa 18 GW 30%
South America 38 GW 22%
12
China GW
5%
* Installed hydropower capacity older than 40 years in percent of the region’s total installed capacity
Source: S&P WORLD ELECTRIC POWER PLANTS data base (WEPP)
15 / ANDRITZ / COMPANY PRESENTATION / JUNE 2019 / © ANDRITZ GROUPCHAPTER OVERVIEW
01 ANDRITZ GROUP OVERVIEW
06 LONG-TERM TARGETS AND
STRATEGY
02
03 PULP & PAPER
04
05 SEPARATION
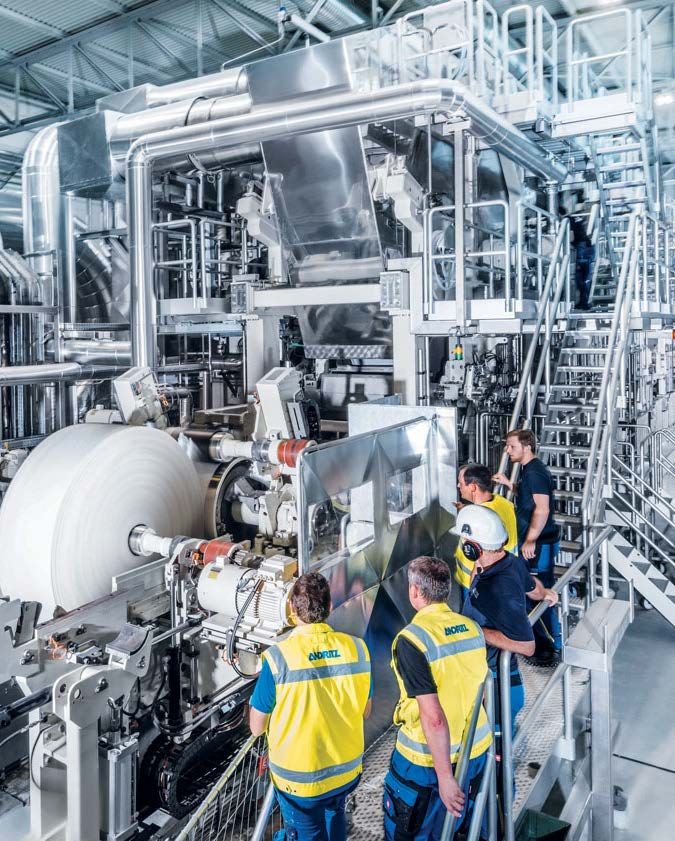
16 / ANDRITZ / COMPANY PRESENTATION / JUNE 2019 / © ANDRITZ GROUPPULP & PAPER: CONTINUED GOOD MARKET
ENVIRONMENT
The ANDRITZ tissue pilot plant in Graz, Austria – the
• Pulp PrimeLineTIAC – offers customers the opportunity to
test and develop their future textured tissue.
Excellent project activity for both modernization of existing pulp mills and
greenfield pulp mills.
• Paper
Satisfactory market development for tissue and packaging equipment
continued.
• Power generating boilers
Very good project and investment activity, especially in Europe and Asia
(Japan).
• Competition
Stable competitive environment.
17 / ANDRITZ / COMPANY PRESENTATION / JUNE 2019 / © ANDRITZ GROUPLONG-TERM PAPER DEMAND GROWTH BY PRODUCT
Tissue and packaging as major drivers
GROWTH P.A 2017-2030E
Source: Pöyry
WF: Woodfree; UC: uncoated; WC: wood-containing; C: coated
18 / ANDRITZ / COMPANY PRESENTATION / JUNE 2019 / © ANDRITZ GROUPWORLD FIBER PRODUCTION DEVELOPMENT
2017-2030E
ANDRITZ‘s potential market
Global consumption growth,
350,000
replacement of shutdowns as
well as bio-refinery products
300,000
250,000
1,000 tons/a
200,000
150,000
100,000
50,000
0
Recovered Paper Chemical Pulp Mechanical Pulp
2017 2020 2025 2030
Source: Pöyry
19 / ANDRITZ / COMPANY PRESENTATION / JUNE 2019 / © ANDRITZ GROUPNEW PULP MILLS AND LINES ≥0.5MT IN PLANNING
BUT: substantial pulp
USA: inventory increase
Owner – project Capacity/a* Planned start-up globally in Q1 2019
SUN BIO Arkansas 1.0 2023 FINLAND: RUSSIA:
Owner – project Capacity/a* Planned start-up Owner – project Capacity/a* Planned start-up
BRAZIL: OOO Monolog 0.5 2020
Kemijärvi 0.5 2021
Owner – project Capacity/a* Planned start-up
Finnpulp – Kuopio 1.2 2022 Krasleinvest 0.8 2022
Klabin 1.0 2020
China Chentong 0.8 2022
Eldorado – Três Lagoas 2.3 2022 ESTONIA:
Siberwood 0.9 2023
Lwarcel 1.3 2022 Owner – project Capacity/a* Planned start-up
Segezha/CAMCE 0.5 2024
Suzano 2.0 2022 Est-For Oü 0.7 2025-
China Metallurg. 0.5 2025-
Group
CRPE Holding S.A –
Ribas do Rio Pardo
2.2 2024 PARAGUAY:
JSC Arkhangelsk 0.5 2025-
Owner Capacity/a* Planned start-up
Jari Cellulose 0.8 2024
Boguchanskiy 0.8 2025-
Suzano – Três Lagoas 1.9 2025- Paraguay pulp project 1.5 2025-
MOZAMBIQUE:
Suzano – Aracruz 1.7 2025- URUGUAY:
Veracel – Eunápolis 1.8 2025- Owner Capacity/a* Planned start-up
Owner Capacity/a* Planned start-up
Braxel – Peixes 2.0 2025- Portucel 1.5 2025-
UPM 2.1 2022
Suzano – Imperatriz 1.3 2025- OTHER:
CMPC Brazil – Pelotas 1.8 2025-
ARGENTINA:
Owner – project Capacity/a* Planned start-up
Owner – project Capacity/a* Planned start-up
Aditya Birla & Eco 1.0 2025- Acacia Cellulose 0.9 2022
Brazil Florestas Agroforestal Oberá 0.6 2021 Malaysia
Double A Thailand 0.6 2025-
*Annual capacity in million tons (subject to change over time); source: Pöyry. Capacity/year refers to added gross capacity
(i.e. relevant as accessible market) without taking into account possible shut-downs of existing capacities
20 / ANDRITZ / COMPANY PRESENTATION / JUNE 2019 / © ANDRITZ GROUPCHAPTER OVERVIEW
01 ANDRITZ GROUP OVERVIEW
06 LONG-TERM TARGETS AND
STRATEGY
02
03
04 METALS
05 SEPARATION
21 / ANDRITZ / COMPANY PRESENTATION / JUNE 2019 / © ANDRITZ GROUPMETALS: CONTINUED LOW PROJECT AND
INVESTMENT ACTIVITY IN METALS FORMING
Satisfactory market environment in Metals Processing
• Metals Forming (Schuler)
Unchanged moderate project and investment activity due to the continuing
weak international automotive market as well as due to the economic slow
down in China.
• Metals Processing
Overall satisfactory project activity. Orders placed focused mainly on
technologies and plants for the production of advanced high-strength steel
grades.
• Competition
Unchanged challenging competition.
Bridle rolls in an ANDRITZ aluminum finishing line.
22 / ANDRITZ / COMPANY PRESENTATION / JUNE 2019 / © ANDRITZ GROUPSCHULER: ORDER INTAKE AND SALES 2013-2018
Despite acquisitions order intake practically flat over the last five years
ORDER INTAKE AND SALES (IN MEUR) AGGREGATED EBITDA 2013-2018 (IN MEUR)
• Purchased in 2013 business plan
595 660
assumed lower sales going forward
1,233 1,255 1,212
1,200 1,200 1,174
1,165 1,194 1,178 1,141 • Acquisition multiple: 4.1 EV/EBITDA
Actual six year average: 5 / 4.6 (excl.
1,039 1,016 extraordinary items)
EBITDA EBITDA excl.
• Two restructuring programs in 2013 and extraordinary items
2015 with a total of 60 MEUR
implemented SALES CHINA (IN MEUR)
• Acquisition of Yadon in 2016 to expand 334
298 310
business in the Chinese growth market 287 272 290
• Some shift of production capacities to
China
• Weakness of the global automotive
market in 2018 leads to under-
absorption especially in Germany
2013* 2014 2015 2016** 2017 2018 2013* 2014 2015 2016** 2017 2018
Order intake Sales
* First-time consolidation of the Schuler Group as of March 1, 2013; pro forma
** First-time consolidaton of Yadon and Aweba as of July 1, 2016
23 / ANDRITZ / COMPANY PRESENTATION / JUNE 2019 / © ANDRITZ GROUPCHAPTER OVERVIEW
01 ANDRITZ GROUP OVERVIEW
06 OUTLOOK, GROUP STRATEGY,
AND FINANCIAL TARGETS
02
03
04
05 SEPARATION
24 / ANDRITZ / COMPANY PRESENTATION / JUNE 2019 / © ANDRITZ GROUPSEPARATION: GOOD PROJECT AND INVESTMENT
ACTIVITY CONTINUED
Particularly for solid/liquid separation equipment
• Municipal
Investment activity at unchanged good levels (sewage sludge dewatering
and drying).
• Industrial
Good project activity in chemicals, mining, and minerals;
investment activity in food improved significantly from low level.
• Feed and biomass pelleting
Solid project activity.
• Competition
Unchanged market environment with some global and many regional
ANDRITZ Gouda paddle dryer for hygienic
competitors. drying of food and chemicals.
25 / ANDRITZ / COMPANY PRESENTATION / JUNE 2019 / © ANDRITZ GROUPEQUIPMENT FOR THE WORLD’S LARGEST PLANT
FOR GENERATING POWER FROM SEWAGE SLUDGE
Bailonggang effluent treatment plant, Shanghai
• ANDRITZ will supply nine fluidized bed dryers and six EcoFluid fluidized bed boilers for
one of the world’s largest effluent treatment plants.
• Order value of just under 120 million euros (60% for Pulp & Paper, 40% for Separation).
• Start-up at the end of 2019.
• Important references for sludge drying and incineration plants in Asia:
• Supply of four EcoFluid boilers to Hong Kong for power generation from sludge.
• Delivery of five drum drying plants to Singapore for water evaporation.
Four ANDRITZ EcoFluid boilers generate power from sludge at the effluent treatment plant in Hong Kong.
3D image of the planned extension to Bailonggang
effluent treatment plant.
26 / ANDRITZ / COMPANY PRESENTATION / JUNE 2019 / © ANDRITZ GROUPCHAPTER OVERVIEW
01 ANDRITZ GROUP OVERVIEW
06 LONG-TERM TARGETS AND
STRATEGY
02
03
04
05
27 / ANDRITZ / COMPANY PRESENTATION / JUNE 2019 / © ANDRITZ GROUPLONG-TERM TARGETS AND STRATEGY
Stay within four segments and achieve long-term profitable growth
FINANCIAL TARGETS
• Sales CAGR of 5-8% based on organic and external growth
• Profitability Achieve average EBITA-margin of 8% over the next 3-5 years
• Dividend Payout of 50-60% of earnings on average
• No diversification, continue to grow the four business areas
• Further expansion of service business
STRATEGY • Maintain/expand technological leadership
• Achieve/maintain competitive cost structure
• Expand global presence
28 / ANDRITZ / COMPANY PRESENTATION / JUNE 2019 / © ANDRITZ GROUPYou can also read