IBuyers: A new choice for home sellers but at what cost? - Collateral Analytics
←
→
Page content transcription
If your browser does not render page correctly, please read the page content below
®

                                                                                                               RESEARCH

iBuyers: A new choice for home sellers but at
what cost?
by Dr. Michael Sklarz* and Dr. Norman Miller** August 07, 2019

Introduction
iBuyers offer quicker closings for sellers who would like to avoid the uncertainty of knowing when and if their
home will sell. For motivated sellers who want a predictable sale date and need to move, perhaps a long
distance from the current location, there is no question that iBuyers have provided a welcome alternative to
traditional brokerage. Rather than compare iBuyers to traditional brokerage, as if the market was required to
offer only one choice, we welcome a plethora of choices for home buyers and sellers. A robust and
competitive market will provide different levels of services and charges to compensate providers for cost of
service and risk. Here we address the question “ Who are the iBuyers, how do they make money, what risks
do they face, and what are the benefits for sellers?”

iBuyer background
The largest iBuyer, based on capital raised to date, is OpenDoor, but there are several others including
OfferPad, Zillow Offers, Redfin, Knock, Realogy CataLIST, Perch, Keller Offers from Keller Williams, and
many others. Some of these are local brokerage firms like SDCountyhomebuyers.com and we can
expect a few localized iBuyers in every major metro. In fact, iBuying can be viewed as comparable to
corporate relocation companies that have been around for many years, providing a guaranteed a sale for
employee transfers, but now offered to the general public and paid for directly by sellers.

When did they start?
OpenDoor, now with over 1300 employees, headquartered in Phoenix, started in 2014 and is available in
at least 20 major cities as of July, 2019. OpenDoor has been reported to have raised at least $1.3 billion
dollars and purchased over 10,000 homes in 2018, more than three times the number of homes as the
next closest competitor, OfferPad.1 They also sold more than double the number of homes as OfferPad.2
OpenDoor has now teamed up with Redfin.

OfferPad started in 2015. Another iBuyer, Knock is slightly different, in that it provides a home trading
platform, assisting the seller by temporarily buying your new home and then selling your old home. As
such Knock is combining the functions of a short-term banker with those of a brokerage firm.

*Collateral Analytics CEO
**University of San Diego School of Business and Collateral Analytics Research

1
    See https://techcrunch.com/2019/03/20/opendoor-raises-300m-on-a-3-8b-valuation-for-its-home-marketplace/
2
    See https://magazine.realtor/technology/feature/article/2019/05/you-can-t-afford-to-ignore-ibuyers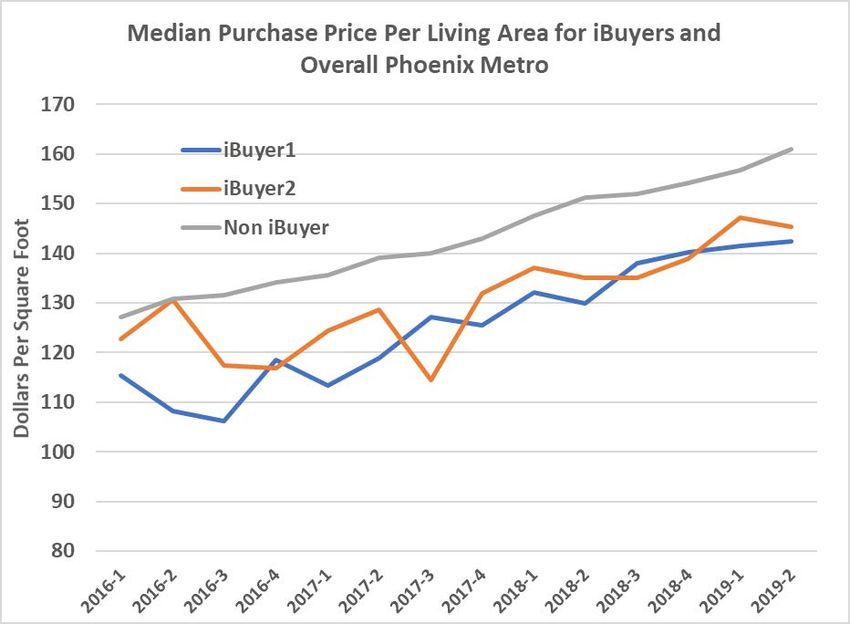
®

Zillow Offers jumped in after witnessing the growth of OpenDoor and is on pace to enter more markets by
2020 than OpenDoor and OfferPad combined, based on their listing data base presence throughout the
United States.

The industry is still in its infancy and represents an extremely small part of the overall market, but one can’t
ignore any financial innovation that has been growing in market share at over 25% per year. Eventually the
most efficient firms, that make the fewest mistakes, with enough capital to reach significant market share
will remain. At the same time, traditional brokerage firms are likely to add this option for sellers, if they have
not already done so.

What do iBuyers charge compared to traditional transactions?
Traditional brokers fees generally range from 5% to 7% of the sales price, with 1% to 4% charged to sellers
and 3% typically paid to buyer’s agents, known as a co-op fee. In addition to this cost, buyers typically pay
some closing costs including lender related charges in the range of 1% to 3%. Aside from direct transaction
costs, the sellers must often spend time and money on home repairs, frequently clean and leave their home
for showings, and bear the uncertainty of not knowing when and if the home will sell.

iBuyers charge sellers a “convenience fee” of 6% to 9.5%, some also charge the seller for fees typically
paid by buyers at closing adding another 1% or more. Most iBuyers will inspect the home, assess a
generous home repair allowance and negotiate a (an additional) credit to handle such repairs.3 Some
iBuyers like OfferPad will pay for moving costs within 50 miles and allow a few extra days after closing of
residence. Overall the total direct costs, ignoring repair credits, will run 7% to 10% for an iBuyer, versus the
typical 5% to 9% combined seller and buyer costs with a traditional broker. Yet, that is not the end of the
story or comparison.

iBuyer Prices Versus Traditional Market Prices
Comparing the transaction costs above of iBuyers, one might conclude that for 2% to 5% more than a
traditional agency, I can sell my home with certainty, avoid the hassles of showing and shift the risk of not
knowing when the home will sell to the iBuyer. iBuyers are well aware of the risks inherent in selling a
home. Using their data analysis, they should, hopefully, know about competing inventory, how long it takes
to sell on average, and how much they will need to sell below market, if they wish to sell fast. iBuyers also
need to be compensated for their capital costs for typically 60 to 80 days. Because of these risks and
costs, iBuyers cannot afford to buy all homes offered at all times of the year, without a conservative offer
price. The more unique the home, the worse the season for selling, or the more competing inventory is
present in the local market, the more conservative will be the offer price.

Using public record data to identify iBuyer and non-iBuyer purchases, Exhibit 1 below shows quarterly
median single family prices paid on a per square foot of living area basis in the Phoenix metro for two of the
larger iBuyers compared to the rest of the (non-iBuyer) market. It should be mentioned that these prices
represent the purchases which we could easily identify and totaled approximately 4000 transactions.

3 The   Zillow web site suggest a service fee of 7% or more will be required, although there is no charge to receive an offer.
®
RESEARCH
Exhibit 1: Phoenix, AZ Metro Single Family Prices Paid Per Square Foot by Buyer Type
While the graph above in Exhibit 1 is a good way of seeing trends in home values and purchase prices by buyer
type, a more accurate way of measuring iBuyer discounts paid is to control for size, age and a host of other
variables influencing value on both the iBuyer purchased properties and all other buyers of similar properties.
To do this, we compared the purchase prices with our CA (Collateral Analytics) Value AVM (Automated Valuation
Model) since the latter correlates very well with actual market values. Here we analyze four active markets.
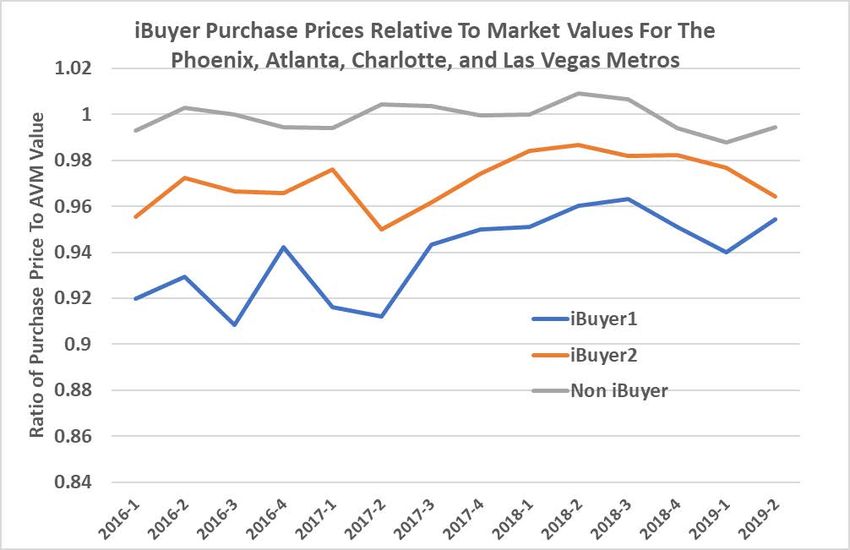
Exhibit 2 below summarizes the analysis and includes approximately 6000 transactions. Here we see the
median discounts of 4.5% to 6.9% for iBuyer1 and 2.0% to 3.3% for iBuyer2. Exhibit 2 shows quarterly median
values of this ratio for the two iBuyers along with the same for purchases of non-iBuyer transactions for four
major iBuyer markets, – i.e. Phoenix, Atlanta, Charlotte, and Las Vegas. The difference between the top line and
the iBuyer lines represents the average spread from our estimate of market value.
One might look at Exhibit 2 and conclude that the spread below market value paid by iBuyers is declining. This
may be true, or it could be that the pressure to deploy capital has reduced the spread as the iBuyer market
matures. Ultimately, the spread will be at an appropriate level to compensate the iBuyers for liquidity risks and
capital costs.®
RESEARCH
Exhibit 2: Median Purchase Price-To-AVM Ratio for iBuyer and Non-iBuyer Transactions
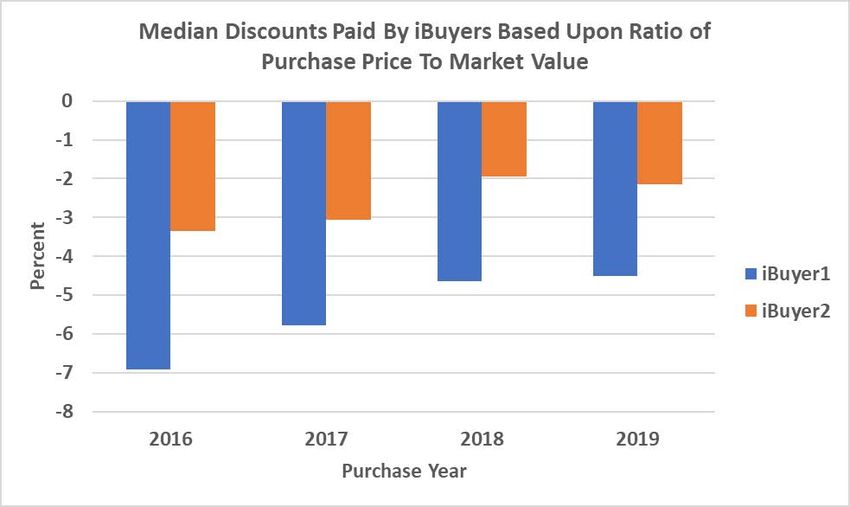
The median purchase price discounts for the four markets studied are shown on an annual percentage
basis in Exhibit 3.
Exhibit 3: Median iBuyer Purchase Price to Market Value Discounts
Other iBuyer Risks: Vacant Property Signals and Adverse Selection
iBuyers face two risks not inherent with most traditional brokerage sales. The first, is that as iBuyer for
sale signs become known, the public will know these are vacant properties. Home break-in’s became
more common when borrowers departed from negative equity homes during the housing crisis of
2008-2010. Empty homes became targets for vagrants and criminals stealing appliances, copper wires
and more.®
RESEARCH
In some cases, fake buyers are able to gain access to the homes with a phone app which opens the lock
box, and because iBuyers do not have agents accompany potential buyers into homes for sale guarding
against fake buyers that only wish to steal from the home may require new safeguards.
The second significant risk for iBuyers is one of adverse selection. Sellers know the nuances of their homes
better than anyone. They will know if the pit bulls next door will make it harder to show the home without
terrifying visitors. Valuation models used by iBuyers have a range of accuracy, just like all appraisals, and
when this value estimate happens to be on the high side of market value, sellers are likely to recognize this
and be more willing to accept the offer. When the offer is too low, the sellers will turn to other iBuyers or
other more traditional selling options. If sellers know the values of their homes better than the iBuyers, then
there will be a problem of adverse selection for the buyers. Sellers tend to accept offers, even those
considered conservative by the iBuyers, when they are close to or above market value and reject those
which are too low. Not all sellers are better informed than the iBuyers. Still, there is some risk of informed
sellers taking advantage of relatively high offers.
Conclusions
The kind of spreads observed, from our market value estimates to the prices paid by iBuyers, apparently
makes sense for the iBuyer companies. The iBuyers do have carrying costs involving significant amounts of
capital, safeguarding the home risks, and adverse selection risks. They also bear significant risks if prices
decline. A downturn in home prices, not forecast by the iBuyer market analysts could be devastating as
they ramp up their business platforms, particularly if the cost of capital increases. At the same time,
downturns are precisely when the most sellers would want this option.
These preliminary empirical results suggest that sellers are paying not just the difference in fees of 2% to
5% more than with traditional agencies, and a generous repair allowance, but another 3% to 5% or more to
compensate the iBuyer for liquidity risks and carrying costs. In all, the typical cost to a seller appears to be
in the range of 13% to 15% depending on the iBuyer vendor. For some sellers, needing to move or
requiring quick extraction of equity, this is certainly worthwhile, but what percentage of the market will want
this service remains to be seen.You can also read