Umicore FY 2019 performance - 7 February 2020
←
→
Page content transcription
If your browser does not render page correctly, please read the page content below
Umicore FY 2019 performance
                    7 February 2020
Overview
Highlights 2019
2020 outlook
2019 business review
2019 financial review
Wrap up
Q&A
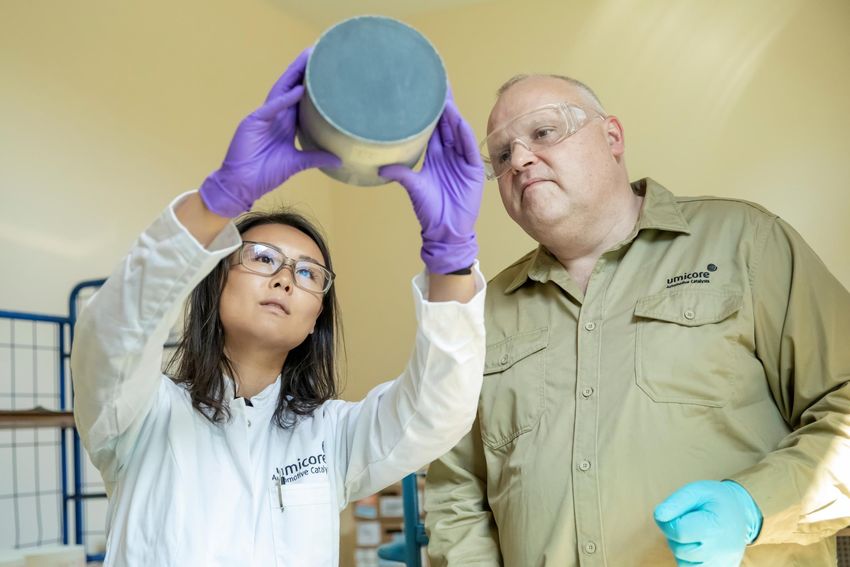
Umicore 2019 performance 2Highlights 2019
Strong performance in challenging environment
ENERGY & SURFACE
CATALYSIS RECYCLING
TECHNOLOGIES
Market share gains in gasoline Growth in cathode materials for Favorable supply environment
catalyst applications EVs in line with the market
Optimized input mix offset
Leading light-duty catalyst Higher cathode materials sales largely lower volumes
provider in China, largest car in H2, sequentially and YoY
market worldwide Higher metal prices
Cobalt price halved vs 2018
Strong growth from fuel cell
catalyst applications Higher D&A and upfront
greenfield investment costs
Significant strides made in the execution of our growth strategy
Umicore 2019 performance 32020 outlook
Umicore expects to grow revenues and earnings in 2020*
ENERGY & SURFACE
CATALYSIS RECYCLING
TECHNOLOGIES
No signs of imminent recovery in EV demand in China not expected Increased availability of Hoboken
automotive market to materially recover in 2020 smelter
Higher sales of cathode materials Sustained favorable supply
Benefiting from strong market
for EVs and positive impact from environment
position in gasoline catalyst
applications and higher recent acquisition in Kokkola Tailwinds from metal prices (partly
penetration of cGPFs in Europe Higher R&D, D&A and start-up hedged in 2019)
and China costs
Fuel cell catalyst production ramp-
up in Korea
*Assuming that the recent coronavirus outbreak will not result
in a protracted or material effect on the economy in 2020
Umicore 2019 performance 42019 business review
Catalysis 2019 market context

Recession in global car market                    More stringent emission norms
                                                  in key regions
Global light-duty vehicle production down by      Euro 6d TEMP for all new vehicles since
6.3% year on year:                                September 2019
   China             - 8.9%
   Europe            - 5.0%                       Early implementation of China 6a in July 2019
   North America - 4.4%                           in several major cities and provinces

China down 2nd year in a row; steep contraction   Increasing share of gasoline particulate filters
in H1 19, while pace of decline eased             in Europe and China
somewhat in H2 19

Falling diesel production in Europe
(-12%), share of 35% in European car market

                                                                                             Umicore 2019 performance   6
Catalysis 2019 performance
Revenues +7% and REBIT +10%; outperforming market reflecting market share
gains in light-duty gasoline
REVENUES
1500 1.360 1.460
1.253
1.094 1.163
Automotive Catalysts 1000 620
652 743
545 565
Market share gains in light-duty gasoline
500
Growing penetration of cGPFs in China and Europe 549 598 633 709 717
0
Leadership position in light-duty vehicles in China H1
2015 2016 2017 2018 2019
Higher volumes and revenues in heavy-duty diesel H2
REBIT
300
Precious Metals Chemistry
Strong demand from pharmaceutical and chemical 250 13,2% 12,7%
12,3% 12,4%
industries 200 10,6%
166 185
152 168
Significant increase in demand for fuel cell catalysts 150 124
99
75 85 82
100 63
50 86 87
61 78 81
0
2015 2016 2017 2018 2019
million €
Umicore 2019 performance 7Catalysis – major milestones in 2019
Capacity expansions
Sustained investments Opening of new plant
to support growth of
in product and for fuel cell catalysts
Automotive Catalysts in
process innovation in Korea
China, Poland and India
Umicore 2019 performance 8E&ST 2019 market context
Slowdown in global EV demand and low cobalt price
Global EV market up 7.7% in 2019 compared to 62% in 2018, reflecting abrupt
decline in EV sales in China in H2 due to subsidy cuts
LCO in consumer electronics: supply chain reducing excess inventories
ESS in Korea: subdued demand due to safety incidents
Depressed cobalt price (-56% vs 2018) and inflow of cheaper unethically
sourced artisanal cobalt
Umicore 2019 performance 9E&ST 2019 performance
Revenues -5%; REBIT -29% reflecting slowdown in demand and low cobalt price
REVENUES
1500
Rechargeable Battery Materials 1.289 1.225
Lower sales for portable electronics and ESS 894
1000 639
Higher sales for EVs, in line with global EV market 618
587 610
495
Recycling and refining activities hit by low cobalt price 500 322
289
650 607
Higher D&A, higher R&D and upfront costs for 298 288 398
greenfield expansions 0
H1
2015 2016 2017 2018 2019
H2
REBIT
Cobalt & Specialty Materials
19,8%
Impacted by low cobalt price and inflow of cheaper 500
14,6% 14,5%
unethically sourced artisanal cobalt 400 12,6% 13,2%
Customers reducing excess inventories 300 257
200 183
140 136
81
Revenues for Electroplating slightly up; stable 100 70 82 79
30 45 121 102
61
revenues for Electro-Optic Materials 0 40 37
2015 2016 2017 2018 2019
million €
Umicore 2019 performance 10E&ST – major milestones in 2019
Capacity expansions
• Commissioning greenfield
Commissioning of Acquisition of cobalt refinery
plant in China new Process and cathode precursor
Competence Center activities in Kokkola, Finland
• Start of construction greenfield
plant in Poland (Olen, Belgium)
Support for long-term
Multi-year cathode growth
materials supply Conclusion of long-term
• Obtained support within
agreements with leading EV supply partnerships for
framework of IPCEI* for
battery makers, LG Chem sustainable cobalt batteries
and Samsung SDI • Global Battery Alliance initiative
* Important Projects of Common European Interest Umicore 2019 performance 11Recycling 2019 market context
Supportive metal prices and favorable supply environment
Supportive metal price environment
Higher prices for certain precious and platinum group metals, particularly in
the second half of 2019
Favorable supply environment with increased availability of complex end-of-life
materials
Growing proportion of more complex and higher metal loaded spent
automotive catalysts
Higher availability of printed circuit boards due to Green Fence in China
Umicore 2019 performance 13Recycling 2019 performance
Revenues +9%; REBIT +40% reflecting favorable supply mix, higher metal
prices and optimization of input mix
REVENUES
1.000
Precious Metals Recycling 800 663 641 650 626 681
600
Higher availability of spent autocats and printed circuit 320 318 311 300 368
boards 400
Higher metal prices 200 343 323 339 326 313
Optimization of input mix allowed to offset most of the 0 H1
2015 2016 2017 2018 2019
volume shortfall due to extended maintenance H2
REBIT
shutdown and fire incident in July
300 27,6%
Stable revenues for Jewelry & Industrial Metals; 250 21,3% 21,5%
19,5% 19,7%
substantial earnings contribution from Precious 200
188
142
Metals Management 150 125 128 135
112
100 65 55 56
63
50 77 79 76
62 73
0
2015 2016 2017 2018 2019
million €
Umicore 2019 performance 14Recycling – major milestones in 2019
Completion of multi- Investments to sustain
Upgrade of key
year expansion and improve the
equipment during
program at Hoboken environmental
extended shutdown
plant performance of the
plant
Umicore 2019 performance 152019 financial review
Key figures 2019

   REVENUES                                                        REBIT                               Free Operating Cash Flow
   +3% to € 3.4 bn                                                  € 509 m, close to 2018             € -39 m (€ -406 m in FY 18)
   Strong growth in Catalysis (+7%)
                                                                    record level                       Net debt € 1,143m
   and Recycling (+9%) partly offset                                Balanced contribution from the     Net debt / REBITDA 1.9x
   by decline in E&ST (-5%)                                         three business groups
                                                                    Absorbs strong increase in D&A

   RECURRING NET                                                    REBITDA
                                                                                                       CAPEX                   € 553 m
   PROFIT (Group share)                                             +5 % to € 753* m
   -5% to € 312 m                                                   Stable group REBITDA margin of     ROCE                       12.6%
   Recurring EPS of € 1.30                                          22.1%*                             reflecting intense growth investments
                                                                    Margin increase in Catalysis and
   Proposed gross annual dividend                                   Recycling
   of € 0.75

                     Strong performance in a persistently difficult market context

                                                                                                                                   Umicore 2019 performance   17
 * € 17 m impact from IFRS 16, excluding this, REBITDA is € 736 m and REBITDA margin is 21.6%
Robust performance in challenging market context
REBIT & REBIT margin
Recurring EBIT at € 509 m, close to
700 15,5% 14,8%
record level of 2018
600 13,2%
CAGR
12,2% 12,6% Double digit growth in Recycling and
500
514 509 2015-2019
400 299 320
398
252
+ 11 % Catalysis offset by decrease in E&ST
269
300
140 165
203 Increase in D&A and costs related to
200
100 261 240
greenfield investments in battery
160 155 195
0
materials
2015 2016 2017 2018 2019
REBITDA & REBITDA margin
19,3% 19,9% 20,0%
21,9% 22,1% CAGR Recurring EBITDA growth (+ 5%) to
800 2015-2019
587
720 753
+ 10 %
new high of € 753 m
600 465 496
356 396
299
Robust group margin despite headwinds
400
225 258
Adoption of IFRS 16 lease standard
200 364 357
240 238 288 effect of € 17 m
0
2015 2016 2017 2018 2019
Umicore 2019 performance 18
Group, excluding discontinued activities, million €Strong sequential earnings growth in second half
REBIT & REBIT margin
Strong H2 19 performance after more
300
12,8% 12,8% 13,5% 13,0%
15,2% 15,9% 14,3% 15,3% challenging H1 19
250 11,6% 12,3%
269
Strong sequential and year-on-year growth in H2
261
252
240
200
203
195
150 Mostly driven by Recycling (higher metal prices in
165
160
155
140
100
H2 19 and reflecting impact of extended shutdown
50
0
in H1 19 and fire incident in H2 18)
H1 2015
H2 2015
H1 2016
H2 2016
H1 2017
H2 2017
H1 2018
H2 2018
H1 2019
H2 2019
Also higher H2 19 performance in Catalysis, but
lower in E&ST
REBITDA & REBITDA margin
21,3% 22,4% 21,4% 22,7%
450 19,6% 19,1% 19,2% 20,5% 20,2% 19,8% FY 19 vs H2 19 vs H2 19 vs
400
350 FY18 H2 18 H1 19
396
364
357
356
300
Revenues +3% +9% +6%
299
250
288
258
200
240
238
225
150
100 Recurring EBIT -1% +7% + 12 %
50
0 Recurring EBITDA +5% + 11 % + 11 %
H1 2015
H2 2015
H1 2016
H2 2016
H1 2017
H2 2017
H1 2018
H2 2018
H1 2019
H2 2019
Umicore 2019 performance 19
Group, excluding discontinued activities, million €Improvement in free operating cash flows
million €, continued operations only
1000 800
627
500
549 Cash flow from operations highest in
0 92 last five years at € 549 m
-78
-500
Includes a € 78 m increase in working capital
-708
-1000 requirements, mostly driven by impact of
FY15 FY16 FY17 FY18 FY19
Cashflow generated from operations after net working capital cash flow higher PGM prices in Catalysis
Net working capital cash flows
Cashflow from operations before net working capital cash flow
million €, continued operations only
800
Improved free cash flow from operations,
600
400
549
close to break even (€ -39 m) despite
200 higher growth investments
92
0
-39
-200
-406
Capex of € 553 m, 2/3rd in E&ST
-400
-600 -498
Complemented by higher capitalized
development expenses of € 35 m
-588
-800
FY15 FY16 FY17 FY18 FY19
Cashflow generated from operations after net working capital cash flow
Capex + capitalized development expenses
Free cashflow from operations
Umicore 2019 performance 20
*Free cashflow from operations = cashflow generated from operations – capex & capitalized development expensesNet cash flow bridge
million €
Free operating cashflow of € - 39 m
(€ - 406 m in 2018)
€ 188 m cash out linked to the
Kokkola acquisition
Increased dividend payout to
Umicore shareholders
(€ 186 m vs € 175 m in 2018)
Increase in net financial debt of €
582 m, including non-cash increase
of € 46 m from IFRS 16 adoption
Umicore 2019 performance 21Maintaining a healthy capital structure
35,2%
31,1%
2000 24,4% 2,00
1800
1,92 1,80
15,3% 13,8%
1600 1,60
1,40 1443 Gearing
1400 1,40 ratio
1,19
1200 1,20
1000
840 1,00
861
800 0,80 Net debt
0,64
0,56 / recurring EBITDA
600 0,60
400 321 296 0,40
200 0,20
Consolidated net
0 0,00 financial debt, end of
2015
2016
2017
2018
2019
period
million €
Net financial debt of € 1,443 m,
Corresponds to : Funding headroom to execute
including new € 390 m long term US
private debt placement, drawn in growth strategy while
1.9x net debt to recurring
September 2019 remaining within the
EBITDA ratio
investment grade territory
Diversified funding base and balanced 35% net gearing ratio
maturity profile
Umicore 2019 performance 22Further extension of funding base
Issuance of € 390 m US private placement notes,
Committed medium & long term
complementing existing committed credit facilities:
facilities
Historically low, fixed interest rates
Total of € 1,875 m
Maturities of 7, 10 and 12 years 2000
1800
Total of committed medium and long term debt facilities 1600 Syndicated Bank Credit
amounting to € 1,875 million. 1400
795 Facilities (undrawn)
1200
1000
Debt maturity profile 390 2019 US Private Placement
500 800
400 600
300
360 2017 US Private Placement
400
200
200
100 330 2017 Schuldschein
0 0
million € 2023 2024 2025 2026 2027 2028 2029 2030 2031 million €
Umicore 2019 performance 23Non-recurring items
FY 2019 Non-recurring EBIT :
Million €
Restructuring charges and provisions (26) Mostly linked to restructuring charges,
optimizing the footprint in E&ST (outside of
Other (4) the battery materials activities)
Non-recurring EBIT (30) Most significant impact from the
discontinuation of one of the US sites of
Non-recurring tax result 6 business unit Cobalt & Specialty Materials
Net non-recurring result (Group (24)
Share)
million €
Umicore 2019 performance 24Wrap-up
Wrap-up

    Strong 2019 performance, close       Consistent execution of long-term
     to 2018 record levels, despite      growth strategy, while adapting to
    persistently weak market context       short-term fluctuating market
                                                      demand

       Major steps taken in 2019 to          Umicore expects to grow
     strengthen leadership position in       revenues and earnings in
        clean mobility materials and                  2020
                 recycling

                                                                          Umicore 2019 performance   26
Q&A
Financial calendar

     30 April 2020   Ordinary General Meeting of Shareholders

     5 May 2020      Ex-dividend date

     6 May 2020      Record date for the dividend

     7 May 2020      Dividend payment date

     31 July 2020    Half Year Results 2020
                                                                `

                                                                    Umicore 2019 performance   28
Forward-looking statements
This presentation contains forward- Should one or more of these risks,
looking information that involves risks uncertainties or contingencies materialize,
and uncertainties, including statements or should any underlying assumptions
about Umicore’s plans, objectives, prove incorrect, actual results could vary
expectations and intentions. materially from those anticipated,
expected, estimated or projected.
Readers are cautioned that forward-
looking statements include known and As a result, neither Umicore nor
unknown risks and are subject to any other person assumes any
significant business, economic and responsibility for the accuracy of these
competitive uncertainties and forward-looking statements.
contingencies, many of which are
beyond the control of Umicore.
Umicore 2019 performance 29You can also read