Nature of Airline Demand - Air Transport Management Seminar Universidade Lusofona Lisbon 7th - 11th January 2008
←
→
Page content transcription
If your browser does not render page correctly, please read the page content below
Nature of Airline
Demand                                      Air Transport Management Seminar
                                                         Universidade Lusofona
                                                                         Lisbon
                                                        7th - 11th January 2008

 Dr Keith Mason
 Director Business Travel Research Centre
 www.businesstravelresearch.com

 Dept of Air Transport
 K.Mason@cranfield.ac.uk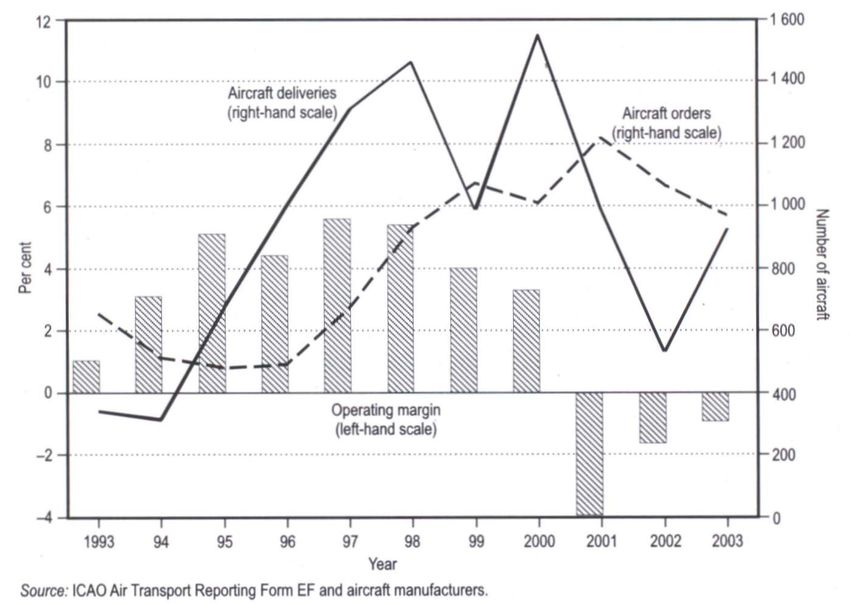
The Airline Industry

  •   Big and Wide and Tall
  •   Characteristics
  •   Changes in Demand
  •   Key Issues
Big and Wide and Tall
     2,100 million passengers (4.1% increase)
753 million international passengers (6.7% increase)

                                            ICAO preliminary figures
IATA Members
Operations
                    IATA members Air Transport Operations

 500,000

 450,000

 400,000

 350,000

 300,000

 250,000

 200,000

 150,000

 100,000

  50,000

      0
           2001   2002           2003                 2004         2005   2006
                          Tonnes-Kilometres Performed (millions)

                                  Mail   Freight   Passenger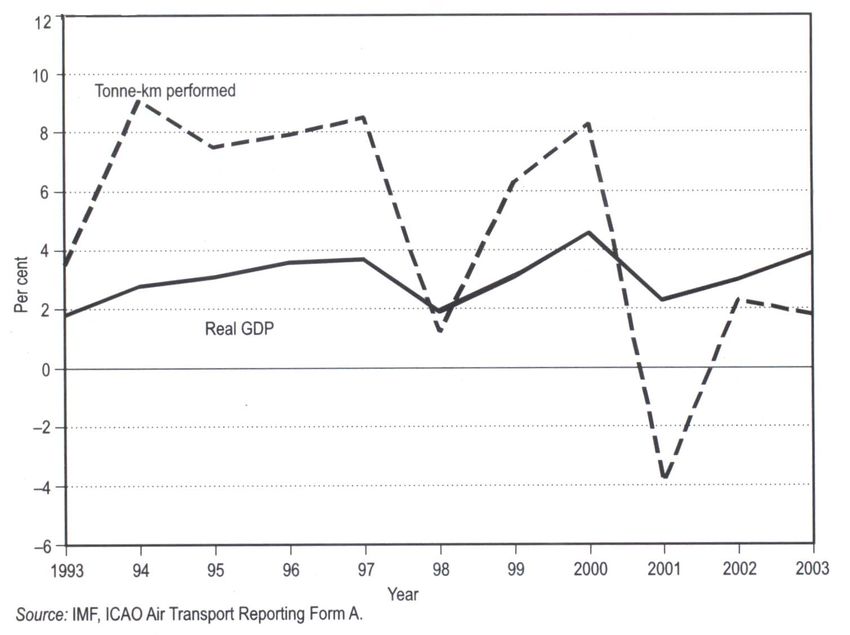
IATA Share of World
RPKs, 2006
          100

          90

          80

          70

          60
Percent

          50

          40

          30

          20

          10

           0
                International               Domestic                                  Total 2007
                                                                      Source: IATA , WATS,

                                Scheduled    Charter   All Services
Major Passenger
Traffic Flows (RPKs)

                              14.0%    Europe
                                        8.9%                9.6%
       North America
          20.6%                                      Middle
                                                    East 1.0%
                                            2.2%                                    8.0%

8.0%                                                            3.1%

                                                                        Asia &
                                             0.6%                      SW Pacific
                       1.6%                                             19.4%

         Source: IATA WATS 2004
                       IATA scheduled RPKs 2006
Passenger traffic
growth forecast
Actual
ICAO, Outlook for Air Transport to 2015, Cir 304 AT/127IATA Members’
Passenger Load
Factors
IATA Member Passenger Load Factors
78
76
74
72
Percent
70
68
66
64
62
2001 2002 2003 2004 2005 2006
International Domestic SystemAirline Industry Characteristics
Airline industry
characteristics
• Strongly influenced by economic cycles
• Seats cannot be stored
• High operating gearing
• Many markets highly seasonal
• Long aircraft ordering lead times
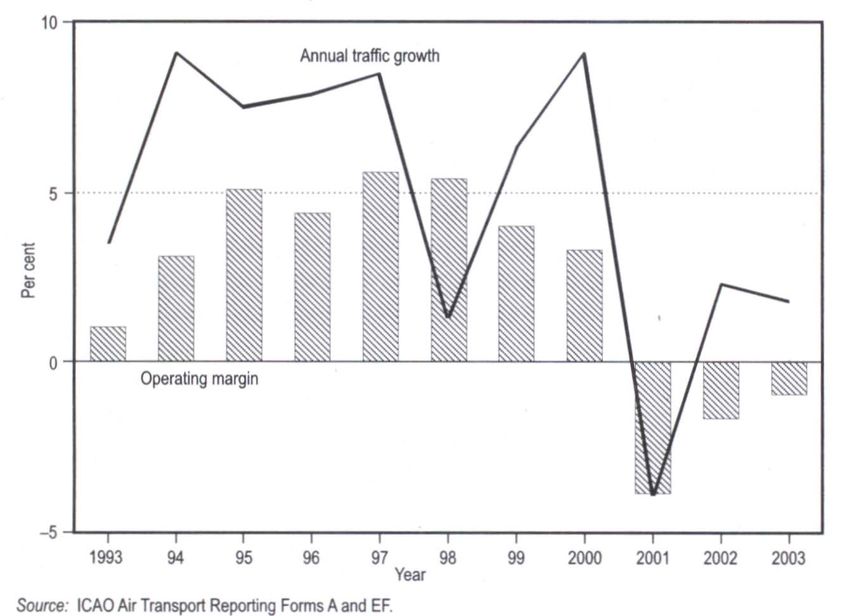
• Poor financial performanceWorld GDP & scheduled traffic growth
Aircraft Manufacturer
Forecasts
(Passenger-kms)

   Av. Annual Growth:
   2006/7 to 2025/6      Airbus   Boeing
   Intra-Europe           5.6%     3.5%
   Europe - N. America    3.7%     4.7%
   Asia - N. America      5.5%     6.2%
   Europe - Asia          5.3%     5.6%
   Domestic China        10.8%     8.8%
   Domestic India         9.8%     9.9%
   Total World            6.0%     5.0%
High Operational
Gearing

  • Variable costs (escapable in short-term):
      • approx. 40% of total
  • Indirect costs (escapable in medium-term):
      • approx. 40%
  • Fixed aircraft-related costs (escapable medium-term):
      • approx. 20%

  • High Operational Gearing = Large Swings in Profitability
Route Seasonality
(Summer) Gatwick - Malaga: Schedule and Charter combined (2006)
140,000
120,000
100,000
80,000
60,000
40,000
20,000
0
Jan Feb Mar Apr May Jun Jul Aug Sep Oct Nov Dec
LGWAGPRoute Seasonality
(Winter) Luton - Geneva (2006)
40,000
35,000
30,000
25,000
20,000
15,000
10,000
5,000
0
Jan Feb Mar Apr May Jun Jul Aug Sep Oct Nov Dec
LTNGVARoute Seasonality
(Business) Heathrow - Frankfurt Main (2006)
180,000
World Cup
160,000
140,000
120,000
100,000
80,000
60,000
40,000
20,000
0
Jan Feb Mar Apr May Jun Jul Aug Sep Oct Nov Dec
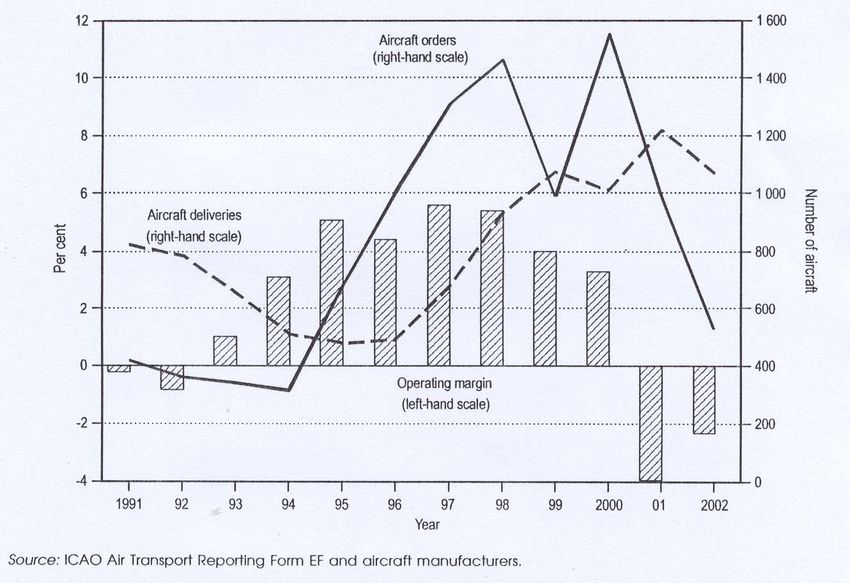
LHR-FRAFinancial return & traffic growth
Financial return &
aircraft supply              2000+
                             orders
                             in 2005

                     2004   2005
Recent jet orders
Boeing and Airbus
• 2005
• Boeing = 1004
• Airbus = 1055
• 2006
• Boeing = 1044
• Airbus = 790What strategy are
airlines pursuing?
Higher yield passengers
v.
Low seat cost
___________
Non-stop, hub bypass
v.
Multi-stop, hub to hub consolidation
___________ACME Market Share
(S-Curve) Strategy
5x
Market Share
4x
*ACME: Airlines’ Collective
Management Effect
3x
2x
The more capacity/frequency
x
share captured, the greater the
share of the market achieved
*ACME: Airlines Collective Management Effect
x 2x 3x Frequency shareACME Market Share
(S-Curve) Strategy
50%
40%
Market Share
30% *ACME: Airlines’ Collective
Management Effect
20%
10% The more capacity/frequency
share captured, the greater the
share of the market achieved
10% 20% 30% Frequency share %
NB: Both the X & Y scales are the sameReview
• Implicit assumption that all passengers along the Y-
axis are of the same value
• Model is predicated on desire to gain market share to
• Capture best traffic
• Frequency dominance will bring high yield business traffic
• Deter entrants
• Dominate distribution channels
• FFP
• Earn abnormal profits
• But on long haul routes the various routings (e.g
LON-SYD via DXB, BKK, HKG, SIN, etc.) mean that
market share cannot be protectedSo to review…
• In growth phase of cycle airlines tend to adopt a market
share strategy
• An indirect service at low seat cost can afford to carry lower value traffic
and will capture market share (but at increasingly lower yields) perhaps
enabling market dominance in some markets.
• This strategy has higher exposure and the defence of the market position is
more difficult in today’s airline environment
• But a carrier that puts a direct service or restricts capacity is likely to
capture yield although costs may be higher
• In a downturn airlines tend to adopt a market share strategy
• Again the carrier with the smaller aircraft and the more direct service is
going to capture better yielding passengers
• The carrier with the larger aircraft may lose passengers unless they drop
fares further. Low seat costs are not very worthwhile if you have no one
sitting in the seat.World scheduled airline
financial results: US$
20,000
15,000 Operating Result
Net Result
10,000
5,000
US$ million
0
-5,000
-10,000
Source: ICAO and IATA for 2006 estimate
-15,000
1988 1989 1990 1991 1992 1993 1994 1995 1996 1997 1998 1999 2000 2001 2002 2003 2004 2005 2006eWorld scheduled airline
financial results: margins
8.0
6.0
Operating Result as % Revenues
Net Result as % Revenues
4.0
2.0
Percent
0.0
-2.0
-4.0
Source: ICAO and IATA for 2006 estimate
-6.0
1988 1989 1990 1991 1992 1993 1994 1995 1996 1997 1998 1999 2000 2001 2002 2003 2004 2005 2006eProfitability by sector
(2006) Top 150 Airline Profitability
Total
Regional
Major
Low cost
Leisure
Independent
Flag
Cargo
-2.00% 0.00% 2.00% 4.00% 6.00% 8.00% 10.00%
Net Margin Op Margin
Major = Pax airline with revenues of $2bn, Flag = Mainline National Carrier
(Top 150 airlines, Airline Business, Aug 2007)Top 150 airline groups -
six year record
(Airline Business, Aug 2007)Changes in Demand
Change in business
market

   • Downgrading
   • Adoption of low cost airlines
   • Change in booking behaviour
        •   Increase in fare transparency
            •   As fares have fallen route deals have been less attractive
            •   No longer prepared to pay high multiples for business class
        •   Increase in price elasticity
        •   Increase in “value for money” purchasing
   • Use of other forms of communication
        •   45% of US business travellers working for firms with managed travel programmes
            report that they had substituted at least one trip with tele or web-conference while
            25% of those who worked for companies with unmanaged travel policy (NBTA Annual
            survey 2004)
Profitability by class of
passenger service
Source: IATA, Task ForcePropensity to fly
premium
% of business travellers in premium cabins, 4 quarter moving average
65
60
55
50
45
40
35
30
25
Longhaul
20
Shorthaul
15
10
1986 1987 1988 1989 1990 1991 1992 1993 1994 1995 1996 1997 1998 1999 2000 2001 2002 2003 2004 2005 2006
Source: BAClass of travel Class of travel booked for last trip
60%
50%
40%
30%
20%
10%
0%
First Class Business Class Premium Economy Full Economy Restricted Low Cost Carrier
Class Class Economy Class
Short Haul (flights < 3 hours) Long Haul (flights > 3 hours)
Source: Mason, Cranfield University, 2006Business Travel in good
economic times
• In economic good times we would expect the market to be price
inelastic and demand increased service.
• However the market seems to be splitting into:
• A diminishing proportion of business class and first class customers
• Corporates define when business class can be used and this definition is getting
more strict and more effectively controlled
• The proportion left will be likely customers for business class only services (e.g.
EOS), hub-bypass direct (LH - PrivateAir) etc.
• Can A380 interiors/sleeper cabins attract these travellers away from direct
services?
• And an increasing proportion of “downgraders”, premium economy users, and LCC
adopters.
• Corporates are getting tools (online SBTs) that enable real-time appraisal of the
best fare and can use these systems to ensure travel policy compliance
• Seeking greater choice/flexibility from airlines - unbundling
• SME customers tend to choose the budget optionBusiness Travel in poor
economic conditions
• In economic downturns business travel market shows
increased price elasticity and downgrading activity.
• Business class in short haul has become virtually extinct.
• Increased use of premium economy services in long haul
• Greater management of the decision to travel on ROI basis
• Increasing substitution of less essential travel by other forms of communication
• Greater management of the travel selection decisions using real time
systems that incorporate value of time/well being of traveller
• Can A380 interiors/sleeper cabins attract travellers away from direct services
and avoid extra hotel accommodation?.Leisure traveller - Lifestyle changes • Lengthier and more flexible holiday entitlements • Increased job and educational mobility • Rise of the ‘grey panthers’ • The Gap Year phenomenon • 2nd Homes overseas • Sporting, cultural events
Reason for travel
influences airline
choice
     100%

     80%

     60%
                                                            Other non-business
                                                            Visiting Friends/Relatives
                                                            Holiday - Independent
                                                            Holiday - Package
                                                            Business
     40%

     20%

      0%
            Charter       Low Cost Carrier   Full Service
            Source: BAA
Leisure travel in good
economic times
• Increasing disposable income, low interest rates and reduced
incentive to save means:
• Increasing number of leisure trips (shorter duration)
• Increasing dramatically in European short haul market
• Leading to significant orders for B737s and particularly A320s
• Of the 2000+ aircraft ordered in 2005 over 70% were A320/B737 types
• Growing long haul demand
• Markets in India and China with a growing monied middle class
• Limits to growth are amount of free time, surface mode
substitutes (esp. rail) and other ways of spending money (new
iPods and iPhones, HDTV, “experience events”, etc.)Leisure travel in poor
economic conditions
• With falling disposable incomes, job insecurity,
saving for rainy days means:
• When economy turns down hasn’t been a decrease in number
of leisure trips. But not sure that will continue in future
• Will environmental taxes reduce demand?
• Quicker consolidation in LCC sector
• Leading to cancellations and lower uptake of options
• Weaker demand for long haul services and people seeking best
prices – airlines will have to fight harder to protect markets
• Market protection and retrenchment from network carriersThank you for your participation
You can also read