Rightmove House Price Index - The largest monthly sample of residential property prices
←
→
Page content transcription
If your browser does not render page correctly, please read the page content below
Rightmove
House Price Index
The largest monthly sample of
residential property prices

 21st September 2020

   Copyright © 2020, Rightmove plc. Released 21st September, 2020. For media enquiries and interviews please
   contact the Rightmove press office: T | 020 7087 0605 M | 07894 255295 or E | amy.murphy@rightmove.co.uk
Monday 21st September 2020
Price record for larger homes as buyers compete for space
• Price of property coming to market up 0.2% this month, just £269 below the record set in July:
• Second-stepper sector of three- or four-bedroom homes hits new record of £291,618, as more
buyers seek larger homes
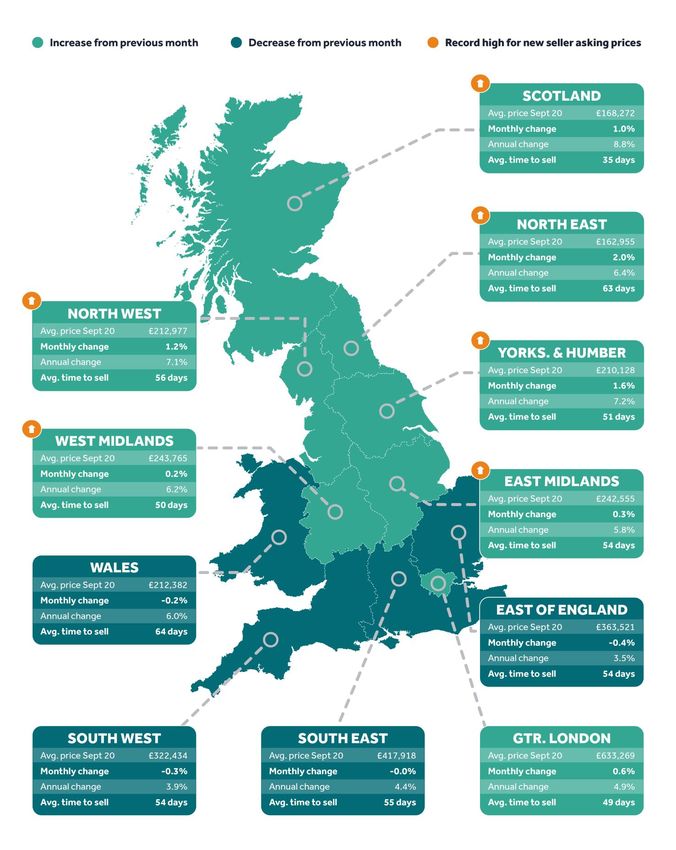
• Northern regions strongest for price jumps, with Yorkshire & the Humber, East Midlands, West
Midlands, North East, North West and Scotland all at new records
• Sales agreed compared to this time last year stronger for larger homes – more than doubling in the largest
‘top of the ladder’ homes sector (+104%), and growing strongly in the second-stepper sector (+55%)
• National sales agreed for the whole year to date are down just 5% on the same period in 2019, with East of
England (+4%) and South East (+1%) already ahead, while Scotland (-21%) and Wales (-16%) still lag behind
due to their later reopening
• Rightmove estimates that there are nearly 40% more sales currently going through the buying and selling
process compared to this time last year, leading to congestion of sales in progress
National average asking prices
Month Avg. asking price Monthly change Annual change Index
September 2020 £319,996 +0.2% +5.0% 247.4
August 2020 £319,497 -0.2% +4.6% 247.0
National average asking prices by market sector (excluding Inner London)
Sector September 2020 August 2020 Monthly change Annual change
First-time buyers £200,324 £201,196 -0.4% +4.2%
Second-steppers £291,618 £290,520 +0.4% +5.7%
Top of the ladder £564,512 £563,593 +0.2% +4.9%
Year-to-date
Region/country sales agreed
vs. same period in 2019
Great Britain -5%
East of England +4%
South East +1%
South West -1%
London -3%
North East -4%
North West -5%
Yorkshire and The Humber -6%
East Midlands -6%
West Midlands -7%
Wales -16%
Scotland -21%
2
Copyright © 2020, Rightmove plc. Released 21st September, 2020. For media enquiries and interviews please
contact the Rightmove press office: T | 020 7087 0605 M | 07894 255295 or E | amy.murphy@rightmove.co.ukOverview
The trend of up-sizing to a larger home has continued at pace over the past month, leading to record asking
prices in the second-stepper sector, made up of three- or four-bedroom homes. This price record has
been fuelled by buyers looking for more space, including both those who need extra space for their families
and those looking for room to work from home. Overall prices have remained steady since they hit a record
in July, up by a marginal 0.2% on the month, and up by 5.0% annually, which is the highest annual growth
rate recorded since September 2016. Regions outside the South of England have seen the strongest price
jumps, with Yorkshire & the Humber, East Midlands, West Midlands, North East, North West and Scotland
all at new records.
Tim Bannister, Rightmove’s Director of Property Data comments: “Increased competition for second-
stepper homes has pushed prices to a record this month for those looking to take the next step up the
ladder. Needing more space has always been the most popular reason for moving house, but now there’s a
new urgency for extra space to be able to work from home, which means that there are different sets of
buyers competing for the same type of property. At the start of the year a fourth bedroom was very much a
luxury for buyers trading up, but it’s now emerging as a must-have for those who are able to take that step.
With overall asking prices just a few hundred pounds shy of July’s record, and buyer demand at an all-time
high, those currently looking for their next home are likely to find that only offers close to the asking price
will be considered, especially for larger homes.”
The demand for larger homes is also reflected in the number of sales being agreed by agents compared to
this time last year. The strongest sector is ’top of the ladder’, which includes four-bedroom detached
homes and larger. Sales agreed, compared with the same period last year, more than doubled in August in
this sector, up by 104%. While in the second-stepper sector (three- or four-bedroom homes excluding
four-bedroom detached) they were up by 55%. The first-time-buyer sector of two bedrooms or fewer,
although not as strong as the larger homes sectors, still saw sales agreed up by 36%.
Nationally, sales agreed for the whole year to date are now down by only 5% on the same period last year.
Two regions – the East of England (+4%) and the South East (+1%) – have already overtaken the number of
sales agreed for the same period last year, helped by higher average prices causing the stamp duty holiday
to have more of an impact for buyers and sellers in these areas. Unsurprisingly both Scotland and Wales are
in double digit declines as they are still playing catch up from reopening their housing markets later than
England, and are now down by 21% and 16% respectively.
In London, sales agreed for the year to date are down by just 3%, with a two-speed market in play. There is
strong sales activity in Outer London, especially for top-of-the-ladder homes, while areas like Zone 1 are
finding it more challenging, where sales are down by 14% for the whole year to date compared to the same
period last year. The strong activity in Outer London has helped the capital to climb back to being the
second fastest region for the average time taken to secure a buyer, now being beaten only by Scotland at
35 days. The average number of days to agree a sale in London is now 49, a significant 20 days shorter than
at this time last year. Nationally, the average time to secure a buyer has dropped from 62 days in August
2019 to 53 this August.
Bannister observes:“When comparing with last year, it’s remarkable that two regions have already caught
up with and overtaken the number of sales agreed across the year so far, and if the market continues at its
current pace then we could see all areas of England break even over the next month or so. We know that
some people are now choosing to move out of London altogether, but these latest figures show that
there’s still plenty of activity in the outer areas of the capital. The market remains challenging in Zone 1, as
the benefit of living within walking distance of an office in the City has dropped down buyers’ wishlists for
now.”
Rightmove’s analysis estimates that there are nearly 40% more sales currently on the journey from
agreeing a price towards completing the sale compared to this time last year, leading to agents reporting
that they are having to manage expectations with clients and explain to them that their sales are going to
take a bit longer to complete.
3
Copyright © 2020, Rightmove plc. Released 21st September, 2020. For media enquiries and interviews please
contact the Rightmove press office: T | 020 7087 0605 M | 07894 255295 or E | amy.murphy@rightmove.co.ukOverview
Bannister explains: “We’re hearing of challenges at all steps of the buying and selling process, including
lenders having to deal with a higher number of mortgage applications and solicitors over their capacity, and
we estimate there are nearly 40% more sales currently going through than at this time last year. The
temporary stamp duty holiday means that there’s more urgency than usual for the congestion to be
cleared by the end of March, making it vital for buyers and sellers to work closely with their estate agent
and to make sure that they’re moving fast when the ball is in their court to complete a document or answer
questions. We’d advise that buyers and sellers factor in at least an extra month to account for the current
delays in the process, if possible, as time is already running short for sales that are agreed now to be
completed by Christmas.”
Agents’ views
Ben Hudson, Managing Director of Hudson Moody in York, says: “In the first few months of the market
reopening I was saying that we were as busy as we’d ever been, but even that is now paling into
insignificance when compared with how busy we are right now. A number of our buyers are coming from
London, as it’s comparatively cheap here compared to the capital. They’re selling up their homes in
Wandsworth and Clapham and buying a four-bed detached house in York, because they’ll only be
commuting from here once or twice a week, something they would never have been able to consider doing
before. We’re very much having to make our buyers and sellers aware that the conveyancing process is
taking longer at the minute; there’s a mixture of fewer council staff working so searches are taking longer,
mortgages taking longer to go through, and solicitors being inundated with work. We’re having to call
everyone involved in the sale constantly to make sure things keep moving.”
Nick Leeming, Chairman of Jackson-Stops, comments: “When the property market experiences
unprecedented demand, such as the UK has seen post-lockdown, you can understand how potential
logjams can form throughout the transaction process. For those looking to sell their home now, there are
ways in which you can help prevent a sale from taking longer than expected to reach the completion stage.
A key way of doing this is to be prepared, get all of your documents, searches, pre contract enquiries and
contracts agreed in advance, so that as soon as you have agreed terms with a buyer everything you need is
ready. It is also worth investigating the delivery time scales of your solicitor – do your research, read
reviews from other sellers. The last thing any seller wants is to wait for two weeks for a solicitor to reply to
an introductory email so it is worth looking into the availability of online conveyancers if time is of the
essence.”
4
Copyright © 2020, Rightmove plc. Released 21st September, 2020. For media enquiries and interviews please
contact the Rightmove press office: T | 020 7087 0605 M | 07894 255295 or E | amy.murphy@rightmove.co.ukNational trends
Average asking price trend
£340,000
£335,000
£330,000
£325,000
£320,000
£315,000
£310,000
Index
£305,000 temporarily
£300,000 suspended in
£295,000 May & June
£290,000
£285,000
£280,000
Sep-19 Oct-19 Nov-19 Dec-19 Jan-20 Feb-20 Mar-20 Apr-20 May-20 Jun-20 Jul-20 Aug-20 Sep-20
Average 'time to secure a buyer' (no. of days) - National
100
88
90
83
80 76
73
71
70 67 67
64
62 62 61 62
60
53
50
40
Aug-19 Sep-19 Oct-19 Nov-19 Dec-19 Jan-20 Feb-20 Mar-20 Apr-20 May-20 Jun-20 Jul-20 Aug-20
5
Copyright © 2020, Rightmove plc. Released 21st September, 2020. For media enquiries and interviews please
contact the Rightmove press office: T | 020 7087 0605 M | 07894 255295 or E | amy.murphy@rightmove.co.ukRegional trends
6
Copyright © 2020, Rightmove plc. Released 21st September, 2020. For media enquiries and interviews please
contact the Rightmove press office: T | 020 7087 0605 M | 07894 255295 or E | amy.murphy@rightmove.co.ukEditor’s notes
Miles Shipside is currently away. Interviews are available with our Director of Property Data, Tim Bannister.
About the Index:
The Rightmove House Price Index methodology was updated in January 2018. The report now includes data for
Scotland and a number of measures have been refined. The stock per agent figure now calculates the average based
on the number of properties an agent has on Rightmove each day across the month, rather than the average of the
total number of properties each agent advertised in the month. London asking prices are now broken down into travel
zones. For the purpose of historical comparisons, the historical figures have been restated based on the new
methodology.
The Index includes asking price breakdowns in the housing market to offer trends at three different sectors of the
market: first-time buyer, second-stepper and top of the ladder. Inner London prices have been excluded from this
categorisation as the normal housing ladder is not really applicable.
Advertising property for over 90% of all UK estate agents, Rightmove is in a unique position to identify any immediate
changes in the market. Rightmove’s House Price Index is compiled from the asking prices of properties coming onto
the market via over 13,000 estate agency branches listing on Rightmove.co.uk. Rather than being a survey of opinions
as with some other indices, it is produced from factual data of actual asking prices of properties currently on the
market. The sample includes up to 200,000 homes each month – representing circa 95% of the market, the largest and
most up-to-date monthly sample of any house price indicator in the UK. The Index differs from other house price
indicators in that it reflects asking prices when properties first come onto the market, rather than those recorded by
lenders during the mortgage application process or final sales prices reported to the Land Registry. In essence,
Rightmove’s Index measures prices at the very beginning of the home buying and selling process while other indices
measure prices at points later in the process. Having a large sample size and being very up-to-date, the Rightmove
Index has established itself as a reliable indicator of current and future trends in the housing market.
Rightmove measured 178,941 asking prices this month in England, circa 95% of the UK market. The properties were
put on sale by estate agents from 9th August to 13th September and advertised on Rightmove.co.uk.
Market sectors explained:
First-time buyer: This figure represents the typical property a first-time buyer would purchase, covering all two bed
properties and smaller that come to market (houses and flats).
Second-stepper: This figure represents the typical property of a person moving from their first home, covering all
three and four bed properties that come to market (houses and flats) excluding four bed detached houses.
Top of the ladder: This figure represents asking prices at the top end of the market, covering all five bed properties
and above (houses and flats), as well as four bed detached houses.
About Rightmove.co.uk:
Rightmove.co.uk is the UK’s leading property website, displaying details of homes for sale or rent to the largest online
audience. It is consistently ranked the number one property website in the UK (source: Experian Hitwise). It has circa
95% of all properties for sale and at any time displays a stock of over one million properties to buy or rent. The
Rightmove.co.uk site attracts nearly 141 million visits from home movers each month with time on site averaging 1.1
billion minutes per month (Rightmove data, July 2019).
7
Copyright © 2020, Rightmove plc. Released 21st September, 2020. For media enquiries and interviews please
contact the Rightmove press office: T | 020 7087 0605 M | 07894 255295 or E | amy.murphy@rightmove.co.ukYou can also read