Trading CO2 Certificates Joint Energy Community - EFET Training - 15 December 2020 Dr. Guido Pasternack
←
→
Page content transcription
If your browser does not render page correctly, please read the page content below

Trading CO2 Certificates
Joint Energy Community – EFET Training
15 December 2020
Dr. Guido Pasternack
European Federation of Energy Traders (EFET)

We promote competition, transparency and open access in the European energy sector.
We build trust in power and gas markets across Europe, so that they may underpin a sustainable
and secure energy supply and enable the transition to a carbon neutral economy.

Since our establishment in 1999, EFET has been playing a prominent role in facilitating the development
of open, competitive, liquid and transparent electricity and gas markets, actively contributing to the
development of the EU energy market design.

                           Improving the functionality and design of European gas,
                           electricity and associated markets for the benefit of the overall
                           economy, society and especially end consumers.

                           Developing and maintaining standard wholesale supply contracts
                           and standardising related transaction and business processes (e.g. the
                           EFET Master Agreement and the EFET standard CPPA).

                           Facilitating debate amongst TSOs, regulators, policy makers, traders
                           and others in the value chain about the future of the European energy
                           market.
                                                                                                          2
Agenda

•   Scope and coverage of the EU
    ETS
•   Allocation
•   Market Dynamics
•   Market Oversight
•   Compliance and Risks
•   Overlapping Policies

                                   3
The EU Emissions Trading System is the cornerstone to
drive compliance with Europe‘s climate goals
Cap and Trade system, that limits the overall volume
of greenhouse gases that can be emitted each year
Installed in 2005 to comply with commitments of
Kyoto Treaty
Limits greenhouse gas emissions from more than
11.000 installations in energy and industry
Covers ~45% of EU‘s greenhouse gas emissions
Covers mainly CO2, but also N2O and PFCs from
large emitters Carbon
Participation is in principle mandatory, but
thresholds for small emitters exists
4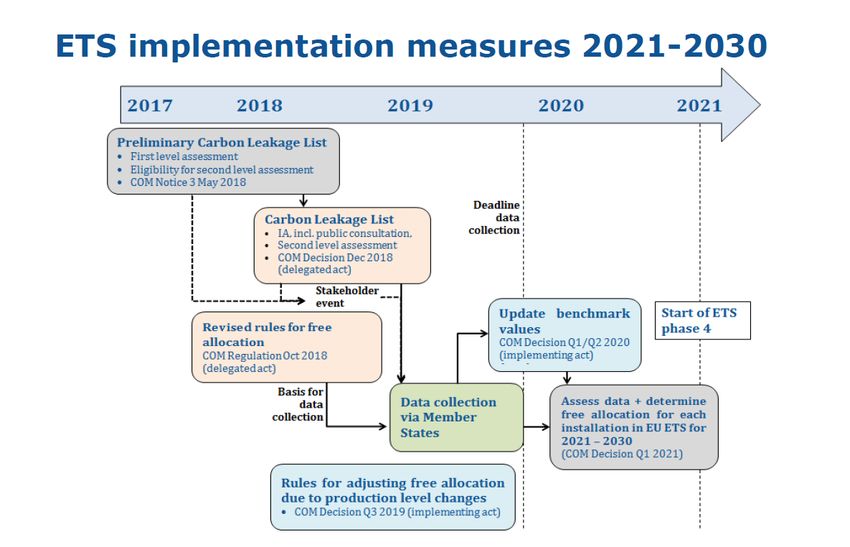
EU ETS scope: main GHG gases of power generation,
industry and aviation in EU+EFTA
 Greenhouse gases in scope                                                                            Geographical scope

 Emission of greenhouse gases1) (GHG), measured in tCO2e
                                                                                                         EU                           +         + EFTA2)
           CO2                             N2O                             PFC1)

      Activities in scope
                                      Stationary installations                                                                         Aviation

                 Power & heat                                          Industry processes

          Thermal input > 20MW                               Oil refining; coke production; metals;                               Flights inside
                                                             cement; lime; glass; ceramics; pulp;                                 ETS area
                                                             paper; chemicals

        1) Officially covered greenhouse gases are carbon dioxide (CO2), methane (CH4), nitrous oxide (N2O), hydrofluorcarbons (HFCs), perfluorcarbons (PFCs) and sulphur
        hexafluorides (SF6). Only three gases are emitted by currently listed activities (CO2, N2O, PFCs)
        2) EFTA: European Free Trade Association                                                                                                                            5
EU ETS was established 15 years ago
Trading Period 1 Trading Period 2 Trading Period 3 Trading Period 4
2005-2007 2008-2012 2013-2020 2021-2030
Test Phase
Covered only CO2 from
power generators and large Mandatory Participation
industries
Constant cap (6.5% below
Low penalties for non- 2007) Shift towards auctioning
compliance
Mainly free allocation of Full auctioning for the
Price turns zero at the end of certificates based on power sector Meaningful carbon price?
2007 as banking was not grandfathering rules
allowed Gradual increase of Increased yearly reduction
International credits allowed auctioning for
(~1.4 bn transferred) of 2.2% p.a. (LRF)
manufacturing sector
Aviation brought into the Set-aside certificates as
1.74% reduction of cap reserve to reduce surplus
system per 1.1.2012 every year
Cancellation of certificates
But high surplus from TP2 in 2024
puts pressure on prices
Stricter rules for free
allocation to industry
6Agenda
• Scope and coverage of the EU
ETS
• Market Dynamics
• Allocation
• Market Oversight
• Compliance and Risks
• Overlapping Policies
7Price development until 2017: Excess supply pulled
down the carbon prices
TP1 (2005-2007) TP2 (2008-2012) TP3 (2013-2020)
Supply red. blocked; Decision on correction measures
growing concern on (Backloading+Market Stability
Negotiations on
over-allocation + policy Reserve), start of negotations for
Over-allocation; Financial supply reduction;
overlap (EE Dir.) trading period 4
no banking into TP2 Crisis DE Nuke Exit
35
30
25
20
€/t15
10
5
0
2005 2006 2007 2008 2009 2010 2011 2012 2013 2014 2015 2016
8Excess supply was mainly accumulated in Phase 2
… but decision to
3.000 Supply backload 900m
Emissions
2.500 certificates helped to
Surplus
stabilize the market
2.000
2014: - 400mt
1.500
2015: - 300mt
1.000
2016: - 200mt
500
And these
0
2008 2009 2010 2011 2012 2013 2014 2015 2016 2017 2018 2019
certificates from
backloading have
Trading Period 2 Trading Period 3
been transferred into
the Market Stability
Reserve
Source: EU COM
9Reform of the EU ETS setting rules for Phase 4
(2021-2030) substantially supported price development
EUA Front Year December Future Commission
35 proposal adopted
on 15 July 2015
30
Trilogues from
25
April to 8
20 November 2017
€/t
15 Entry into force on
10 8 April 2018
5
0
2017 2018 2019 2020
10CO2 emissions have become a key driver of variable
costs of fossil power generation
Plant Type Lignite Hard Coal Natural Gas
Carbon Intensity
0.40 0.33 0.20
[t/MWh thermal input]
Exemplary Plant Efficiency
35% 39% 55%
[%]
Emissions per Unit Output
1.14 0.85 0.36
[t/MWh]
Emission-related costs at
ETS allowance price of 25 €/t 28.50 21.25 9.00
[€/MWh]
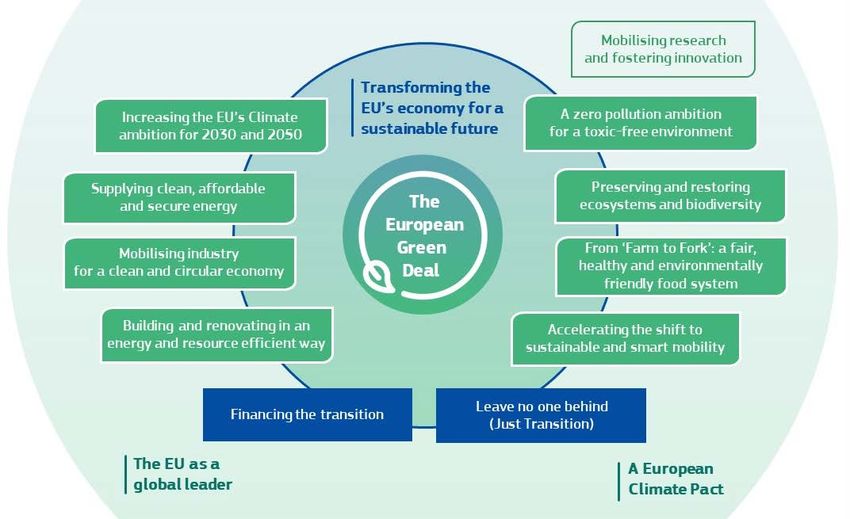
11Fuel Switching due to rising carbon prices
Source: Agora Energiewende 12Emission reduction mainly works by fuel-switch, output
reduction and investments
Short Term Long Term
Power Sector
Fuel
Switch
Investments
Output
(+research)
reduction
Industry
Carbon
Leakage
13Agenda
• Scope and coverage of the EU
ETS
• Market Dynamics
• Allocation
• Market Oversight
• Compliance and Risks
• Overlapping Policies
14Structure of the EU ETS in Phase 4 (2021-2030)
15.5 billion allowances
Strengthening of the EU ETS
- Market stability reserve (MSR): Withdrawal
rate of 24% for 2019-2023
- Invalidation of allowances: As from 2023
allowances held in the reserve above the total
number of allowances auctioned during the
Free allocation for Auctioning by previous year should no longer be valid
industry Member States - Linear Reduction Factor: Annual cap
reduction of 2.2% per year (currently: 1.74%)
- Voluntary cancellation of allowances to
account for national measures: Member
States can cancel allowances to account for
domestic policy measures (e.g. coal phase-
out).
Innovation Fund
(400m) Free allocation Modernization Fund
buffer* (450m) (310m)
* Allowances dedicated for auctioning that may be converted 15Linear Reduction Factor increases from 38m tonnes to
48m tonnes per year
Total ETS Supply in Trading Periods 3 and 41
-38,3
2.084 -38,3
2.046 2.008 -48,4
1.970 1.931 1.893 1.855 1.816 1.768 1.720 1.671 1.623 -48,4
1.575 1.526
1.478 1.429 1.381 1.333
2013 2014 2015 2016 2017 2018 2019 2020 2021 2022 2023 2024 2025 2026 2027 2028 2029 2030
Total Supply Trading Period 3
Total Supply Trading Period 4
1Effective supply volumes in single year may differ due to shifts etc.
16Market stability reserve aims to balance excess supply
at a „healthy“ level
From 2019 onwards: adjustment of no of “circulating allowances” at end of each year
Supply in Emissions in
current year current year
Case 1 “oversupplied”:
833mt Move 12-24% into MSR TNAC 2019:
(reducing future supply
through auction volumes)
1.386 mt
TNAC 2018:
1.655 mt Circulating
Case 2 “in balance”:
allowances
previous current 833mt
year year no adjustment
400mt
Y-1 Y
Case 3: “undersupplied”
400mt +
Add 100mt to future
supply from MSR
17For the energy industry auctioning rules are key
The EU Auctioning Regulation ensures that all participants have harmonized, non-discriminatory and
cost-efficient access to the European primary market for emission allowances.
All over the EU, auctions take place only on regulated trading platforms (EEX (and ICE for UK).
High predictability due to publication of detailed auctioning calendar
18Free allocation has to mirror increased ambition
Free allocation for Free allocation adjusted Cross-sectoral New Entrants Reserve
sectors at genuine risk to activity level correction factor (NER)
of carbon leakage (CSCF)
Product of emission In response to Uniform application, if NER with starting value
intensity * trade overallocation in phase demand for free of approximately 350m
intensity with 3rd 3, free allocation will allocation exceeds allowances
countries >0.2: 100% become more dynamic supply Adaptation of the level
free allocation of and linked to To prevent CSCF, of free allocation due to
benchmark value production levels allowances have been production increase or
>0.15: Qualitative Free allocation to an set aside. If not utilized, increase shall be
assessment installation adjusted, these allowances will carried out with
If less exposed: when operations be used for the allowances taken from
Decrease from 30% change by more than Innovation Fund and or added to the NER.
after 2026 to reach 0% 15% using a two-year the Modernization
in 2030 rolling average Fund.
Free allocation to Two benchmark
district heating phases (2021-25 /
adjusted by LRF 2026-30)
19Free allocation based on most recent data sets
Source: EU COM 20Agenda
• Scope and coverage of the EU
ETS
• Allocation
• Market Dynamics
• Market Oversight and Compliance
• Overlapping Policies
21National ETS authorities surpervise the process
Operator collects data on emissions reporting
1 online in formular management system (FMS) and
forwards the edditing rights directly to the verifiers
Verifiers check emission report data
Operators 2a in the FMS and returns signed Verifiers
3
message to plant operator
NCA checks
Operator signs Verifiers approve the
and can request
message and 2b checked emissions
additional
4 forwards it to NCA quantity (Verified
information
emissions)
National Competent
Authority (e.g. DEHSt) Union Registry
Source: DEHSt 22Annual emissions must be reported and “paid” with
certificates in spring of the following year
ETS cycle for example year 2019
2019 Emissions are Corresponding number of
measured between 1st allowances must be held in
Jan and 31st Dec 2019 account by April 30th and are
within each installation deleted by central operator
30.4. Panelty of
€ 100/t for non-
2018 2019 2020 compliance
(+compliance)
31.3.
Free allocation is usually
being handed out Jan-Apr
2019 Emissions must be
reported until 31st March of the
following year to the national
ETS authorities
23Agenda
• Scope and coverage of the EU
ETS
• Allocation
• Market Dynamics
• Market Oversight
• Compliance and Risks
• Overlapping Policies
24ETS is the flagship instrument, but policies overlap
Emissions Renewable Share Energy Efficiency Coal Exit
Renewable energy Less energy Today’s EU
40% Reduction of GHG
emissions vs. 19901 32% share in final energy
consumption
32.5% consumption than
in Base Case
600 TWh coal-fired
generation
In red: planned exit year
Bn tonnes Mtoe
PEC FEC 300 ?
1.842
TWh/a
6 250 2038
RES 1.348 1.243 200
4 32% 910 150
2 100 2029
50 2025
0 68% 2022
1990 2005 2030 0
Baseline 2030 Target
ETS NonETS
Overall (EU-28) Target is 40% Renewable Energy must Target is to be reached either in Some MS already agreed to exit
GHG emission reduction in comprise at least 32% across terms of Primary Energy from coal-fired generation.
2030 vs. 1990 of final energy consumption Consumption (PEC) or Final These commitments cover
(across all sectors) Energy Consumption (FEC) >50% of EU’s coal-fired
This is to be reached by 43%
(vs. baseline scenario) generation
reduction in ETS Sector and Implementation uncertain, as
30% in Non-ETS Sector no targets set on national level Directive includes upward
(measured vs. 2005) revision clause by 2023
Directive includes upward
Cap to be reviewed in 2023 and revision clause by 2023
2028, MSR to be reviewed in
2021 and 2026
25“European Green Deal” to increase climate ambition
Proposing the first European Climate Law,
enshrining the 2050 climate-neutrality
target into legislation
Increasing the EU’s 2030 greenhouse gas
emission reduction target from the current
40% to at least 55% (to be decided in
Trilogue discussions)
Adopting various changes to many EU
Directives in light of increased emission
reduction targets:
ETS Directive to be proposed in July
2021
Expectation that EU ETS will be
extended to more sectors
26Summary
Operates in 31 countries and regulates emissions from 11,000+ installations and all
► intra-EU aviation. It represents 45% of all EU emissions
► Market value of ~130 bn in 2020 (20-30 mn allowances traded daily at €25/t)
► Installations at risk of carbon leakage are allocated allowances for free
EU ETS is comprehensive and highly efficient instrument to reach EU’s climate
► goals in the energy and industrial sector
► EU ETS could become even more important under the “European Green Deal”
27You can also read