Rightmove House Price Index - The largest monthly sample of residential property prices
←
→
Page content transcription
If your browser does not render page correctly, please read the page content below
Rightmove
House Price Index
The largest monthly sample of
residential property prices

    July 2019
  National edition

   Copyright © 2019, Rightmove plc. Released 15th July. For media enquiries and interviews please contact the
   Rightmove press office: T | 020 7087 0605 M | 07894 255295 or E | amy.murphy@rightmove.co.uk
Under embargo for 00.01 hours, Monday 15 th July 2019

First drop in prices this year signals buyers’ market in second half of 2019
• The price of property coming to market falls by 0.2% (-£656), the first monthly fall so far in 2019
• Key metrics indicate a buyers’ market in the second half of 2019:
    • Less property is coming to market, but it is taking longer to secure a buyer, so estate agents’
       average stock per branch is at its highest since July 2015
    • Time to secure a buyer is at the longest at this time of year for six years
• Prices of newly-listed property down by 1.1% this month in the upper sector of four-bedroom-plus
  homes, while lower and middle sectors holding their prices better this month and year-on-year
• Market fundamentals remain sound apart from confidence, and buoyant mortgage approvals indicate
  more resilient activity in the lower and middle sectors. It is buyers at the upper end, who are less likely
  to need a mortgage, who appear most hesitant to engage
                                      National average asking prices
          Month          Avg. asking price    Monthly change      Annual change           Index
        July 2019            £308,692              -0.2%               -0.2%              238.7
        June 2019            £309,348              0.3%                 0.0%              239.2
                 National average asking prices by market sector (excluding Inner London)
          Sector             July 2019           June 2019        Monthly change      Annual change
    First-time buyers        £191,368            £191,364               0.0%               0.1%
    Second-steppers          £278,308            £277,757               0.2%               0.5%
    Top of the ladder        £547,719            £553,680              -1.1%              -0.7%

       Monthly asking price trend

       £320,000

       £315,000

       £310,000

       £305,000

       £300,000

       £295,000

       £290,000

       £285,000
                      Jul-18 Aug-18 Sep-18 Oct-18 Nov-18 Dec-18 Jan-19 Feb-19 Mar-19 Apr-19 May-19 Jun-19 Jul-19

         Rightmove measured 110,663 asking prices this month, circa 90% of the UK market. The properties were put on sale
         by estate agents from 9th June 2019 to 6th July 2019 and advertised on Rightmove.co.uk.

   2
                  Copyright © 2019, Rightmove plc. Released 15th July. For media enquiries and interviews please contact the
                  Rightmove press office: T | 020 7087 0605 M | 07894 255295 or E | amy.murphy@rightmove.co.uk
Overview
The price of property coming to market falls by 0.2% (-£656) this month. This is the first monthly
fall so far in 2019. While prices are traditionally weaker in the second half of the year, this year also
sees the highest total stock per estate agency branch since 2015. With continuing political
uncertainty we expect buyers in market sectors where there is an over-supply to have a stronger
hand negotiating lower prices in the coming months. With sound underlying market fundamentals,
apart from the lack of confidence caused by the uncertain political outlook, there should be a better
bargaining opportunity for those who have hesitated and missed the busier spring market if they
can now find the confidence to engage without waiting for more certainty.
Miles Shipside, Rightmove director and housing market analyst comments: “The housing market
fundamentals remain largely sound in many parts of the country, but the current political climate
means that the crucial ingredient of confidence has been impaired, and that is causing some
potential buyers and sellers to hesitate. With record employment, low interest rates and good
mortgage availability, buyers have a lot in their favour apart from the lack of political certainty.
Those who have postponed their purchase should note that estate agency branches have more
sellers on their books than at any time for the last four years, so there should be more choice of
properties to buy. It could be a good opportunity to negotiate a relative bargain in the second half
of the year, if they can set aside the continuing Brexit distractions.”
Fewer properties are coming to market, down by 7.8% this month compared with the same period
a year ago, and furthermore fewer sales are being agreed (down by 4.6% in the year-to-date
compared to the same period last year). Estate agents’ total average stock per branch is higher
than at any time in the last four years. Average stock is now running at 53.3 properties, the highest
number since the 54.0 that was recorded in July 2015. In addition, the average time to secure a
buyer is at 62 days, the highest at this time of year since 2013. This longer time to secure a buyer,
coupled with higher property stocks, suggest that it will be more of a buyers’ market in the second
half of 2019.
Shipside notes: “Growing numbers of properties on agents’ books even though fewer properties
are coming up for sale are evidence of a more challenging market, with more sellers competing to
get their transaction over the line. With activity and prices often weaker in the second half of the
year, it will be those sellers who are bold enough to price aggressively who will attract buyers with
the confidence to act rather than hesitate. It would appear to be sellers in the upper end of the
market who need to be boldest on pricing, as data shows that the middle and lower sectors are
holding up better.”
Activity is more robust in the mainstream lower and middle markets, made up predominantly of
buyers requiring a mortgage rather than cash buyers. The latest figures from UK Finance show that
the number of mortgage approvals from the main high-street lenders in May was up by 9.1% year-
on-year. New seller asking prices are also holding up better in these sectors, with typical first-time
buyer property the same price as last month at 0.0%, while the typical second-stepper home is up
slightly at +0.2%. The upper end, comprising four bedroom and larger properties where buyers are
less likely to need a mortgage, has dropped by 1.1% month-on-month.
Shipside observes: “While buoyant mortgage approvals indicate more resilient activity in the lower
and middle sectors, it is the cash-rich in the upper end who appear most hesitant to engage. They
are often discretionary buyers, whose needs for more space or the motivation for a change of
location can be postponed. As a result, sellers in the upper end have had to drop their prices more
both month-on-month and year-on-year, suggesting that the best bargain opportunities in the
second half of 2019 for canny buyers could be in this price sector. Buyers in all market sectors in the
less buoyant south and east of the country are also in the driving seat, but greater market
momentum further north means that sellers will still be able to steer clear of buyers who are
looking for too cheap a ride on the back of Brexit uncertainty.”
Miles Shipside, Rightmove director and housing market analyst says: ” The housing market
fundamentals remain largely sound in many parts of the country, but the current political
climate means that the crucial ingredient of confidence has been impaired, and that is causing
some potential buyers and sellers to hesitate.”
3
Copyright © 2019, Rightmove plc. Released 15th July. For media enquiries and interviews please contact the
Rightmove press office: T | 020 7087 0605 M | 07894 255295 or E | amy.murphy@rightmove.co.ukAgents’ views
Lucian Cook, head of residential research at Savills, comments: “Since the Brexit vote,
the market has become driven by sentiment far more than the traditional economic
drivers of affordability. That said, 2016 also coincided with the markets of London and
the higher value parts of the South East hitting up against the limits of more regulation.
As a consequence the slowdown has, to date, been most evident in that part of the
country. There are early indications that this ripple of caution, that is constraining price
growth, is spreading more widely into some of the markets further north. Protracted
political hiatus has added to the sense of caution over the prospects for household
finances, even though mortgage debt remains cheap. These market conditions have
sorted the needs-based movers from the discretionary ones who are often in larger
properties. They also mean that selling in the current market requires a healthy dose of
pragmatism, which is reflected in a decline in asking prices. Where that has been taken
on board, stock has continued to trade. That presents opportunities for those looking to
trade up the ladder, though they need to be as realistic about the value of their own
property as about the one that they want to purchase.”
Shaun Adams, managing director of Sussex-based Cooper Adams and a Fine and
Country branch, said: “I think that what we’re seeing at a local level reflects what the
Rightmove statistics are showing. For us, the market was quite dire at the start of the
year, but things have livened up from June onwards. Maybe lots of people are sick of
waiting for Brexit to happen and are just getting on with things, but we anticipate there
might be another lull in the run up to the October 31st deadline, although thankfully that
hasn’t happened yet. The market right now is still quite buoyant but it is changing.
Beforehand, if a seller was optimistic, they would most likely still get their valuation,
whereas now they could alienate potential buyers and have their property go stale.”
4
Copyright © 2019, Rightmove plc. Released 15th July. For media enquiries and interviews please contact the
Rightmove press office: T | 020 7087 0605 M | 07894 255295 or E | amy.murphy@rightmove.co.ukAsking price trends
Five year asking price trend
£320,000
£310,000
£300,000
£290,000
£280,000
£270,000
£260,000
£250,000
£240,000
£230,000
£220,000
Jul-14 Jan-15 Jul-15 Jan-16 Jul-16 Jan-17 Jul-17 Jan-18 Jul-18 Jan-19 Jul-19
% monthly change in average asking prices
1.5%
1.0% 1.1%
1.0%
0.9%
0.7% 0.7%
0.5%
0.4% 0.4% 0.3%
0.0%
-0.1% -0.2%
-0.5%
-1.0%
-1.5%
-1.5%
-2.0% -1.7%
-2.5% -2.3%
Jul-18 Aug-18 Sep-18 Oct-18 Nov-18 Dec-18 Jan-19 Feb-19 Mar-19 Apr-19 May-19 Jun-19 Jul-19
5
Copyright © 2019, Rightmove plc. Released 15th July. For media enquiries and interviews please contact the
Rightmove press office: T | 020 7087 0605 M | 07894 255295 or E | amy.murphy@rightmove.co.ukAverage time to sell and stock
Average 'time to secure a buyer' (no. of days) - National
85
80 77
75
71
70
70 67
65
64
65 63
62
61 61
60
60 57
56
55
50
45
40
Jun-18 Jul-18 Aug-18 Sep-18 Oct-18 Nov-18 Dec-18 Jan-19 Feb-19 Mar-19 Apr-19 May-19 Jun-19
Average stock per agent (including Under Offer/Sold STC)
60.0
52.5 52.4 52.3 51.9 51.9 53.3
51.7
50.2 49.7
50.0 47.8
45.9 46.3
44.8
40.0
30.0
20.0
10.0
0.0
Jun-18 Jul-18 Aug-18 Sep-18 Oct-18 Nov-18 Dec-18 Jan-19 Feb-19 Mar-19 Apr-19 May-19 Jun-19
6
Copyright © 2019, Rightmove plc. Released 15th July. For media enquiries and interviews please contact the
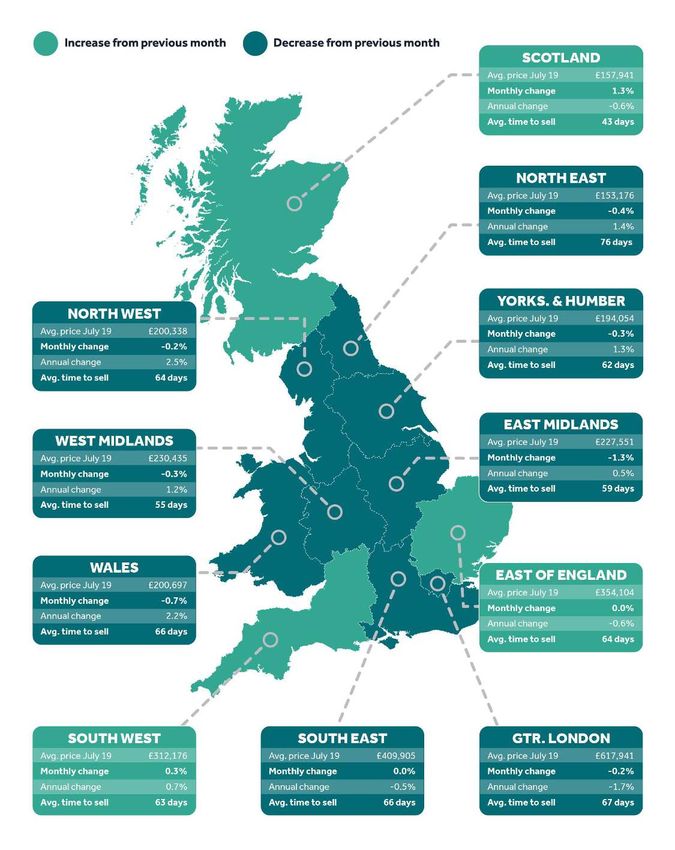
Rightmove press office: T | 020 7087 0605 M | 07894 255295 or E | amy.murphy@rightmove.co.ukRegional trends
7
Copyright © 2019, Rightmove plc. Released 15th July. For media enquiries and interviews please contact the
Rightmove press office: T | 020 7087 0605 M | 07894 255295 or E | amy.murphy@rightmove.co.ukLondon trends
Average 'time to secure a buyer' (no. of days) - London
100
95
89
90
85 82 82
80 78
76
74
75 72 72 71 72
70 67 67 67
65
60
55
50
Jun-18 Jul-18 Aug-18 Sep-18 Oct-18 Nov-18 Dec-18 Jan-19 Feb-19 Mar-19 Apr-19 May-19 Jun-19
8
Copyright © 2019, Rightmove plc. Released 15th July. For media enquiries and interviews please contact the
Rightmove press office: T | 020 7087 0605 M | 07894 255295 or E | amy.murphy@rightmove.co.ukLondon trends
Borough data is based on a three-month rolling average and can be used as an indicator of overall
price trends in each borough over time. It is not directly comparable with the overall London
monthly figures.
Avg. price
Borough Monthly change Annual change
July 2019
Kingston upon Thames £632,790 2.8% 3.7%
Bromley £537,546 1.1% 1.4%
Waltham Forest £489,277 0.7% 0.8%
Southwark £644,187 1.6% 0.7%
Bexley £408,840 -0.4% 0.6%
Barking and Dagenham £317,180 -0.1% 0.5%
Brent £588,096 0.1% 0.1%
Hammersmith and Fulham £915,258 -1.4% -0.1%
Hounslow £540,549 -0.4% -0.1%
Newham £416,542 0.3% -0.1%
Enfield £459,287 0.1% -0.8%
Harrow £559,262 0.1% -0.9%
Havering £405,308 0.1% -1.1%
Hillingdon £488,703 -0.4% -1.2%
Hackney £641,954 2.1% -1.3%
Lewisham £473,391 0.7% -1.3%
Islington £743,810 -1.9% -1.4%
Greenwich £445,214 0.5% -1.5%
Camden £993,953 0.4% -1.6%
Wandsworth £801,173 0.1% -1.9%
Ealing £548,400 -0.2% -2.0%
Croydon £435,272 -0.4% -2.1%
Sutton £470,735 -0.4% -2.2%
Haringey £608,227 -0.5% -2.8%
Barnet £638,178 0.4% -2.9%
Richmond upon Thames £835,862 0.2% -3.1%
Redbridge £454,088 -0.3% -3.7%
Kensington and Chelsea £1,641,242 2.0% -4.0%
Westminster £1,431,053 -0.1% -4.8%
Lambeth £632,300 -0.3% -4.9%
Merton £612,670 -1.9% -6.7%
Tower Hamlets £559,327 -1.2% -7.4%
9
Copyright © 2019, Rightmove plc. Released 15th July. For media enquiries and interviews please contact the
Rightmove press office: T | 020 7087 0605 M | 07894 255295 or E | amy.murphy@rightmove.co.ukEditor’s notes
About the Index:
The Rightmove House Price Index methodology was updated in January 2018. The report now includes data for
Scotland and a number of measures have been refined. The stock per agent figure now calculates the average based
on the number of properties an agent has on Rightmove each day across the month, rather than the average of the
total number of properties each agent advertised in the month. London asking prices are now broken down into travel
zones. For the purpose of historical comparisons, the historical figures have been restated based on the new
methodology.
The Index includes asking price breakdowns in the housing market to offer trends at three different sectors of the
market: first-time buyer, second-stepper and top of the ladder. Inner London prices have been excluded from this
categorisation as the normal housing ladder is not really applicable.
Advertising property for over 90% of all UK estate agents, Rightmove is in a unique position to identify any immediate
changes in the market. Rightmove’s House Price Index is compiled from the asking prices of properties coming onto
the market via over 13,000 estate agency branches listing on Rightmove.co.uk. Rather than being a survey of opinions
as with some other indices, it is produced from factual data of actual asking prices of properties currently on the
market. The sample includes up to 200,000 homes each month – representing circa 90% of the market, the largest and
most up-to-date monthly sample of any house price indicator in the UK. The Index differs from other house price
indicators in that it reflects asking prices when properties first come onto the market, rather than those recorded by
lenders during the mortgage application process or final sales prices reported to the Land Registry. In essence,
Rightmove’s Index measures prices at the very beginning of the home buying and selling process while other indices
measure prices at points later in the process. Having a large sample size and being very up-to-date, the Rightmove
Index has established itself as a reliable indicator of current and future trends in the housing market.
Rightmove measured 110,663 asking prices this month, circa 90% of the UK market. The properties were put on sale
by estate agents from 9th June 2019 to 6th July 2019 and advertised on Rightmove.co.uk.
Market sectors explained:
First-time buyer: This figure represents the typical property a first-time buyer would purchase, covering all two bed
properties and smaller that come to market (houses and flats).
Second-stepper: This figure represents the typical property of a person moving from their first home, covering all
three and four bed properties that come to market (houses and flats) excluding four bed detached houses.
Top of the ladder: This figure represents asking prices at the top end of the market, covering all five bed properties
and above (houses and flats), as well as four bed detached houses.
About Rightmove.co.uk:
Rightmove.co.uk is the UK’s leading property website, displaying details of homes for sale or rent to the largest online
audience. It is consistently ranked the number one property website in the UK (source: Experian Hitwise). It has circa
90% of all properties for sale and at any time displays a stock of over one million properties to buy or rent. The
Rightmove.co.uk site attracts over 130 million visits from home movers each month with time on site averaging over
one billion minutes per month (Rightmove data, July 2017).
10
Copyright © 2019, Rightmove plc. Released 15th July. For media enquiries and interviews please contact the
Rightmove press office: T | 020 7087 0605 M | 07894 255295 or E | amy.murphy@rightmove.co.ukYou can also read