Q2 2019 Earnings Presentation - Dietmar Siemssen, CEO Dr. Bernd Metzner, CFO Duesseldorf, July 11, 2019 - Gerresheimer

Page created by Carlos Roberts
 
CONTINUE READING
Q2 2019 Earnings Presentation - Dietmar Siemssen, CEO Dr. Bernd Metzner, CFO Duesseldorf, July 11, 2019 - Gerresheimer
Q2 2019 Earnings Presentation
Dietmar Siemssen, CEO
Dr. Bernd Metzner, CFO
Duesseldorf, July 11, 2019
Q2 2019 Earnings Presentation - Dietmar Siemssen, CEO Dr. Bernd Metzner, CFO Duesseldorf, July 11, 2019 - Gerresheimer
Disclaimer

     This presentation may contain certain forward-looking statements, including assumptions, opinions and views of the
     Company or cited from third party sources. Various known and unknown risks, uncertainties and other factors could
     cause the actual results, financial position, development or performance of the Company to differ materially from the
     estimations expressed or implied herein.

     The Company does not guarantee that the assumptions underlying such forward-looking statements are free from
     errors nor does the Company accept any responsibility for the future accuracy of the opinions expressed in this
     presentation or the actual occurrence of the forecast development.

     No representation or warranty (express or implied) is made as to, and no reliance should be placed on, any
     information, including projections, estimates, targets and opinions, contained herein, and no liability whatsoever is
     accepted as to any errors, omissions or misstatements contained herein, and, accordingly, none of the Company or
     any of its parent or subsidiary undertakings or any of such person‘s officers, directors or employees accepts any
     liability whatsoever arising directly or indirectly from the use of this document.

     For an overview of abbreviations and definition please see the glossary slide in the backup section

July 2019      Q2 2019 Earnings                                                                                          2
Q2 2019 Earnings Presentation - Dietmar Siemssen, CEO Dr. Bernd Metzner, CFO Duesseldorf, July 11, 2019 - Gerresheimer
Agenda

       1        Dietmar Siemssen
                Q2 2019 highlights

       2        Dr. Bernd Metzner
                Q2 2019 financial review

       3        Dietmar Siemssen
                Conclusion & outlook

       4        Appendix

July 2019   Q2 2019 Earnings               3
Q2 2019 Earnings Presentation - Dietmar Siemssen, CEO Dr. Bernd Metzner, CFO Duesseldorf, July 11, 2019 - Gerresheimer
Another good performance in Q2 2019. Dynamic in the company
remains high. Implementation of Capex program fully ongoing

                                       Strict monitoring of all business and macro drivers

   Q2 2019 Financials                              Markets & Macro                            Operations

      Revenues and profitability                    Good market environment all in all with    P&D reported revenues up 4.4% YoY
      developments in line with expectations        regional differences
                                                                                                 led by Primary Plastic Packaging (in
            Reported revenues up 7.2%               Strong demand in Europe overall              particular South America) and
                                                                                                 sustained strong growth in Syringes
            Adjusted EBITDA at EUR 100.4m           Softer demand in the Glass business in
            (EUR 74.2m + EUR 26.2m)                 the USA essentially led by operational     PPG reported revenues up 6.0% YoY
                                                    issues at one of our customers’ where
      Adjusted net income performance                                                            led by Europe (Pharma &
                                                    we have a high market share
      higher by EUR 10.0m or 43.0% YoY                                                           Cosmetics) and Emerging Markets
                                                    Currency movements result in slight
      Adjusted EBITDA Leverage at 2.3x                                                         Systematic execution of capex plan
                                                    translation tailwinds
      Reconfirming 2019 guidance and                                                             Essen furnace overhaul planned over
      outlook for 2020-2022                                                                      Q3 and Q4
                                                                                                 Brazil ramp up well in plan
                                                                                                 Expansion in Horsovsky Tyn on track
                                                                                                 Installing new RTF lines in Buende

July 2019           Q2 2019 Earnings                                                                                                    4
Q2 2019 Earnings Presentation - Dietmar Siemssen, CEO Dr. Bernd Metzner, CFO Duesseldorf, July 11, 2019 - Gerresheimer
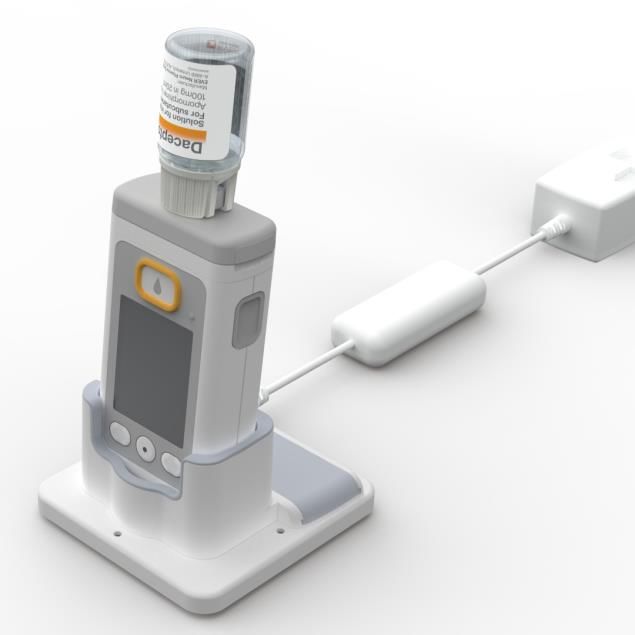
Strong dynamic at Sensile Medical

       SEIZING NEW BUSINESS
       OPPORTUNITIES
                                           SCHEDULING MILESTONES
                                           PAYMENTS FOR
                                           TECHNOLOGY
                                           DEVELOPMENT PROJECTS
       EVER Pharma D-mine® Pump for
       Parkinson commercialized in
       several EU countries
       New partnership with SQ             Confirming milestone payment
       Innovation: development and         regarding the project with EVER
       commercialization of new drug-      Pharma in July 2019
       device combination for treatment
       of edema in patients with heart     Milestone payments determined
       failure                             by achievement of specific
                                           projects criteria
       Continuing to prepare for
       operational readiness in Pfreimd
       for future parts production (P&D)

July 2019       Q2 2019 Earnings                                             5
Q2 2019 Earnings Presentation - Dietmar Siemssen, CEO Dr. Bernd Metzner, CFO Duesseldorf, July 11, 2019 - Gerresheimer
Deployment of current Capex plan is essential to support
Gerresheimer’s future growth and profitability in core business

            Capacity expansion is key for:                           Upgrades are necessary to:

              Actual under capacity
                 — Syringes                                           Process optimization & productivity improvement
                 — Decoration Cosmetics Europe                           — Standardization
                                                                         — Automation
              Global footprint
                 — Emerging Markets: Plastics Packaging Brazil and
                                                                      Maintain competitiveness
                   China
                                                                         — New low cost location: Republic of North Macedonia
                 — Our customers require a global presence in both
                   Cosmetics and Pharma

              Booked business materialization
                 — Inhalation project Czech Republic

July 2019          Q2 2019 Earnings                                                                                             6
Q2 2019 Earnings Presentation - Dietmar Siemssen, CEO Dr. Bernd Metzner, CFO Duesseldorf, July 11, 2019 - Gerresheimer
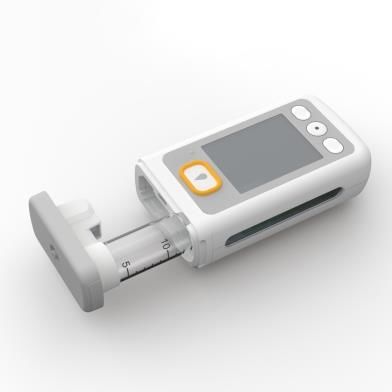
Center of Excellence Gx RTF® Syringes
Upgrade to world class production & capacity expansion
                                 Meet strong demand in RTF syringes in Europe
                                   Adding up to approx. 35% more volume capacity by 2022
                                   New RTF5 and RTF6 lines with high flexibility

                                 Ensure Biotech/ Biosimilar readiness
                                   Gx InnoSafe ® and Gx RTF ® Luerlock add significant value to
                                   syringe portfolio
                                   Gx RTF ® ClearJect ® (COP) completes portfolio
                                   Small batch production ready as needed by biotech customers

                                 Next quality and automation level
                                   Next generation of forming and RTF process to meet highest
                                   quality standards
                                   Higher autonomy and automation by Industry 4.0 technologies
                                   Increase of output quantity – especially for high volume heparin
                                   and vaccine orders

                                           Drive growth & efficiencies

July 2019   Q2 2019 Earnings                                                                          7
Agenda

       1        Dietmar Siemssen
                Q2 2019 highlights

       2        Dr. Bernd Metzner
                Q2 2019 financial review

       3        Dietmar Siemssen
                Conclusion & outlook

       4        Appendix

July 2019   Q2 2019 Earnings               8
Another good performance in Q2 2019

                                                                                                                    CHANGE
   EUR M                                                                           Q2 2019         Q2 2018                                   ANALYSIS
                                                                                                                      in %
   FXN Revenues as per guidance1)                                                     353.3           333.9            5.8%                  Growth across all business units

   Revenues                                                                           356.5           332.6            7.2%                  Slight fx tailwind

   FXN Adjusted EBITDA as per guidance 2)                                              73.2            67.9            7.9%                  Volume growth, operating leverage and mix

   Adjusted EBITDA                                                                    100.4            71.1            41.3%

            Total one-off items                                                        -1.6            -1.0           -63.4%

            Depreciation & Amortization3)                                             -37.4           -33.0            13.3%                 Including FVA of SM‘s technology in Q2 2019

            Net finance expense                                                        -6.3            -9.4           -32.4%                 Bond redeemed in May 2018 lower int. expenses

            Income taxes                                                               -8.0            -8.4            -5.8%

   Net income                                                                          47.1            19.3           144.4%

            Total one-off items (including amortization and tax effects)               12.2            7.2             69.0%

   Adjusted net income                                                                 59.3            26.5           123.9%

   Adjusted net income performance4)                                                   33.1            23.1            43.0%                 Clear earnings improvement YoY
   1. FXN: See page 105 of annual report FY 2018 for currency assumptions regarding FY 2019. For Q2 2018: excluding EUR 1.0m revenues from the loss of the inhaler customer at our plant in Küssnacht.
   2. FXN: See page 105 of annual report FY 2018 for currency assumptions regarding FY 2019. For Q2 2019: excluding a EUR 26.2m positive effect on FXN Adj. EBITDA due to the derecognition of contingent
      purchase price liabilities in conjunction with Sensile Medical acquisition. For Q2 2018: excluding a EUR 5.2m positive effect on FXN Adj. EBITDA linked to the loss of the inhaler customer at our plant in
      Küssnacht and a EUR 1.1m negative effects on FXN Adj. EBITDA relating to the fair value measurement of the Triveni put option.
   3. Including EUR 13.9m (Q2 2018: EUR 7.6m) amortization of fair value adjustments. Q2 2018 includes EUR 1.8m impairment losses unrelated to portfolio optimization.
   4. For Q2 2019: excluding a EUR 26.2m positive effect on Adj. Net Income due to the derecognition of contingent purchase price liabilities in conjunction with Sensile Medical acquisition. For Q2 2018:
      excluding a EUR 4.4m positive effect on Adj. Net Income linked to the loss of the inhaler customer at our plant in Küssnacht and a EUR 1.1m negative effects on Adj. Net Income relating to the fair value
      measurement of the Triveni put option.

July 2019               Q2 2019 Earnings                                                                                                                                                                 9
Broad based growth, especially driven by higher volumes YoY

                              P&D                                                                  PPG                                                          GAT
                                 Adj.                                                                    Adj.
 FXN1),2)                                                               FXN1)
                3.8%            EBITDA            24.9%                               3.8%              EBITDA       20.0%
 Growth                                                                Growth
                                margin3)                                                                margin3)

                     REPORTED EUR M                                                       REPORTED EUR M                                                REPORTED EUR M
                                                  46.7
                  187.6                                                                 162.1                      32.6                           7.2
                                           44.5                                                                           32.3
                               Q2                                                                    Q2
                              2018                                              153.0               2018
                                                                                                                                                                                1.2
          179.7
                               Q2                                                                    Q2
                              2019                                                                  2019

            Revenues                       Adj. EBITDA                           Revenues                          Adj. EBITDA                Revenues                     Adj. EBITDA

     — Very strong quarter in Syringes                                   — Strong growth in Cosmetics, partially led by more
                                                                           Decoration
     — Plastic Packaging boosted by strong growth in South
       America                                                           — European pharma glass up YoY                                — Revenues for Sensile Medical in line with expectations
                                                                         — Good quarter in Emerging Markets                            — Almost exclusively development revenues
     — Medical Plastics Systems and US Prescription stable
       YoY                                                               — Revenues mix temporarily weighs on margins
     — Adj. EBITDA Contract Manufacturing impacted by loss                   — Higher demand in Decoration led to capacity
       of the Inhaler customer in 2018                                         constraints and externalization to third parties with
                                                                               lower margins
                                                                         — US business impacted by operational issues at one of
                                                                           our customers’ where we have a high market share

1.   FXN: See page 105 of annual report FY 2018 for currency assumptions regarding FY 2019
2.   For Q2 2018: excluding EUR 1.0m from the loss of the inhaler customer at our plant in Küssnacht.
3.   Reported.

July 2019               Q2 2019 Earnings                                                                                                                                                          10
Despite almost doubling of Capex, good Free Cash Flow
performance YoY
  EUR M                                                              Q2 2019   Q2 2018   CHANGE

  Adjusted EBITDA                                                     100.4     71.1      29.3    Change in net working capital stable
                                                                                                  YoY
  - Thereof derecognition of contingent purchase price liabilities     26.2       -       26.2
                                                                                                  Implementation of capex program for
                                                                                                  2019 & 2020 drives higher capex
  Change in net working capital                                       -16.6     -17.8      1.2
                                                                                                  spend YoY

  Capital expenditure                                                 - 28.4    -14.8     -13.6   Lower interest paid on the back of
                                                                                                  refinancing subsequent to bond
                                                                                                  redemption in May 2018. Last bond
  Operating cash flow                                                 55.4      38.5      16.9
                                                                                                  interest payment took place in Q2
                                                                                                  2018
  - Thereof derecognition of contingent purchase price liabilities     26.2       -       26.2
                                                                                                  The non-cash effect stemming from
  Net interest paid                                                   -3.2      -15.9     12.7    the derecognition of contingent
                                                                                                  purchase price liabilities of EUR
  Net taxes paid                                                      - 9.4     -12.9      3.5    26.2m is included in Operating Cash
                                                                                                  Flow and subtracted in the “Other”
                                                                                                  position in Q2 2019.
  Pension benefits paid                                               -2.5      -2.8       0.3

  Other                                                               -37.1     -13.6     -23.5

  Free cash flow before acquisitions / divestments                     3.2      -6.7       9.9

July 2019          Q2 2019 Earnings                                                                                                      11
Adjusted EBITDA Leverage temporarily at 2.3x

       NET FINANCIAL DEBT AND ADJ. EBITDA LEVERAGE

            Net Financial Debt                              FCF before acquisitions     Net Financial Debt
                                                                                                                   Nebt Debt practically unchanged from Feb 28, 2019 to
              Feb 28, 2019       Other (incl. FX effect)       and divestments            May 31, 2019             May 31, 2019
                                                                                                                   Starting exploring refinancing strategies ahead of RCF
                                                                                                                   expiry next year
                                                                    3.2
                (939.1)
                                                                                            (940.3)
                                        (4.4)

      Net Financial Debt Summary
       IN EUR M                                            May 31, 2019               May 31, 2018           EXPIRY DATE MAIN FACILITIES
       Drawn portion of RCF                                   328.7                      166.8
                                                                                                             500        450.0                                    RCF
       Promissory loans (2017)                                250.0                      250.0                                                                   Promissory loans
                                                                                                             400
                                                                                                                                         305.5
       Promissory loans (2015)                                425.0                      425.0               300
                                                                                                                             189.5
       Local borrowings and leasing                            30.3                      25.4                200
                                                                                                                                                       109.0
       Cash and cash equivalents                              (93.7)                     (93.5)              100                                               25.5           45.5
       Net Financial Debt                                     940.3                      773.7                 0
                                                                                                                     FY     FY     FY     FY     FY     FY     FY      FY     FY
       Adjusted EBITDA Leverage                                2.3x                      2.6x                       2019   2020   2021   2022   2023   2024   2025    2026   2027

July 2019            Q2 2019 Earnings                                                                                                                                                12
Agenda

       1        Dietmar Siemssen
                Q2 2019 highlights

       2        Dr. Bernd Metzner
                Q2 2019 financial review

       3        Dietmar Siemssen
                Conclusion & outlook

       4        Appendix

July 2019   Q2 2019 Earnings               13
FY 2019 guidance confirmed, FY 2020-2022 indications
unchanged. Focus on execution
                                                                                                                                              At Group
                                                                                                                                               level &
     METRICS                                                           EXPECTED FY 2019 (FXN1)
                                                                                                                                                FXN1
     Revenues                                                          ~ EUR 1.40bn to EUR 1.45bn
                                                                       ~ EUR 295m (plus/minus EUR 5m)
     Adjusted EBITDA                                                   Excluding EUR 118.5m from derecognition of contingent purchase price
                                                                       components
     Capex (% FXN sales)                                               ~ 12%

                                                                                                                                              FY 2020
                                                         EXPECTED ADJUSTED                                                                    — 2022
      EXPECTED TOP LINE                                                                              EXPECTED CAPEX
      GROWTH                                             EBITDA MARGIN                               REQUIREMENTS
                                                         DEVELOPMENT
      4% to 7% FXN1 revenue growth                                                                   Temporary increase of capex
      per annum for the financial years                  ~ 21% in FY 2020                            to revenues in 2019 and 2020
      2020 – 2022 based on                               ~ 23% for the financial years               up to 12%
       Market volume growth                             2021 – 2022                                 Thereafter back to 8% of
       Gx market outperformance                                                                     revenues
       Growth projects
       Sensile Medical

1.   See page 105 of annual report FY 2018 for currency assumptions regarding FY 2019.

July 2019              Q2 2019 Earnings                                                                                                                  14
Agenda

       1        Dietmar Siemssen
                Q2 2019 highlights

       2        Dr. Bernd Metzner
                Q2 2019 financial review

       3        Dietmar Siemssen
                Conclusion & outlook

       4        Appendix

July 2019   Q2 2019 Earnings               15
Broad based growth in Q2 2019. FXN Revenues as per guidance
up 5.8%
 EUR m
                                                                                                  FXN1 growth YoY: +5.8%
 FXN1
                                                                                                                                              7.2                               353.3
     350                                                                                                                       5.8
                                                    334.9                                                                                                       (0.3)
                332.6                                                                    333.9            6.7
                                    2.3

     325                                                             (1.0)

     300
              Q2 2018           Currency         Q2 2018 @       Impact 2018 Q2 2018 FXN                 Δ P&D                Δ PPG         Δ GAT        Δ Internal Sales      Q2 2019
              reported           impact         2019 budget        loss of the Guidance Base                                                                                    FXN
                                                 rate (FXN)          inhaler
                                                                customer (P&D)
              FXN P&D Q2 2019 performance review
                                                                             FXN PPG Q2 2019 performance review                          FXN GAT Q2 2019 performance review
            + 3.8% (excl. 2018 impact loss inhalation)
                                                                                          + 3.8%                                                    EUR 7.2m
                    +3.2% (including impact)

           — Very strong quarter in Syringes                            — Strong growth in Cosmetics, partially led by more           — Revenues for Sensile Medical in line with
           — Plastic Packaging boosted by strong growth in                Decoration                                                    expectations
             South America                                              — European pharma glass up YoY                                — Almost exclusively development revenues
           — Medical Plastics Systems and US Prescription               — Good quarter in Emerging Markets
             stable YoY
                                                                        — US business impacted by operational issues at one
                                                                          of our customers’ where we have a high market
                                                                          share

1.   See page 105 of annual report FY 2018 for currency assumptions regarding FY 2019.

July 2019               Q2 2019 Earnings                                                                                                                                                 16
FXN Adjusted EBITDA as per guidance up 7.9%

 EUR m
                                                                                                  FXN1 growth YoY: +7.9%
 FXN1
                                                                                                                                                                      26.2           99.4
                           0.9          72.0                         1.1                         5.3                            1.2                      73.2
            71.1                                                                  67.9
                                                       (5.2)                                                  (1.2)

          Q2 2018       Currency      Q2 2018 Impact 2018 Impact 2018 Q2 2018                  Δ P&D          Δ PPG         Δ GAT          Δ HQ        Q2 2019 Derecon. Of Q2 2019
          adjusted       impact       adjusted Loss of the Network FXN base for                                                                       FXN (excl. contingent     FXN
           EBITDA                    EBITDA @    Inhaler    Charges      2019                                                                         Derecogn.) purchase     adjusted
          reported                  2019 budget customer    (PPG) &    guidance                                                                                      price     EBITDA
                                     rate (FXN)   (P&D)    Triveni put                                                                                            liabilities
                                                             option
                                                              (P&D)

                 P&D Q2 2019 performance review
               EUR +5.3mYoY (excl. 2018 impacts                               PPG Q2 2019 performance review                                GAT Q2 2019 performance review
               inhalation & Triveni) or EUR +1.2m                                    EUR - 1.2m YoY                                                   EUR 1.2m
                        including impact
          — Contract Manufacturing impacted by the loss of the          — Revenues mix temporarily weighs on margins                  — Adj. EBITDA development in line with expectations
            inhaler customer in 2018                                            — Higher demand in Decoration led to                    given the nature of revenues
                                                                                  capacity constraints and externalization to
          — Other businesses delivering in line with expectations                 third parties with lower margins
                                                                        — US business impacted by operational issues at one
                                                                          of our customers’ where we have a high market
                                                                          share

1.   See page 105 of annual report FY 2018 for currency assumptions regarding FY 2019.

July 2019              Q2 2019 Earnings                                                                                                                                                     17
GXI Key Data

     in EUR per share                   2008           2009           2010           2011           2012       2013    2014    2015    2016    2017    2018
     Dividend                            0.40             –            0.50           0.60           0.65      0.70    0.75    0.85    1.05    1.10    1.15
     Dividend yield                     1.5%              –           1.8%           1.9%           1.7%       1.4%    1.7%    1.2%    1.5%    1.6%    1.8%
     Payout ratio                        22%              –            26%            25%           25%1       23%     26%     25%     25%     27%     20%
     Share price high                   38.20          27.05          29.85          36.62          41.34      50.14   56.42   76.32   76.86   78.01   79.80
     Share price low                    23.99          13.24          22.09          28.30          31.00      37.60   42.31   41.99   57.10   61.03   59.75
     Share price at FY end              27.10          23.05          28.20          31.17          39.41      49.67   44.44   73.90   68.85   67.06   62.90
     Book value per share               15.26          15.29          16.86          17.59          17.14      17.94   19.25   22.23   24.31   25.14   28.35
     P/E ratio2                         14.81          17.20          14.46          12.77         15.041      16.13   15.38   21.67   16.31   16.51   11.09
     Market cap in EUR m                 851            724            886            979           1,238      1,560   1,395   2,320   2,162   2,106   1,975
     MDAX weighting year
                                      11.48%3         1.33%          1.24%          1.40%          1.47%       1.33%   1.01%   1.42%   1.33%   1.00%   0.87%
     end
     Number of shares in
                                         31.4           31.4           31.4           31.4           31.4      31.4    31.4    31.4    31.4    31.4    31.4
     million

1.    Retrospective restatement due to the early adoption of IAS 19 (amended in 2011) from December 1, 2012.
2.    Based on adj. EPS after non-controlling interests.
3.    SDAX weighting at year end.

July 2019                Q2 2019 Earnings                                                                                                                      18
Financial calendar and contact details

 FINANCIAL CALENDAR

 October 10, 2019                Interim Report 3rd Quarter 2019

 CONTACT DETAILS
 Name                            Corporate Investor Relations

 Phone                           +49 211 6181 257
 Fax                             +49 211 6181 121
 E-mail                          Gerresheimer.ir@gerresheimer.com
 IR website                      www.gerresheimer.com/ir

July 2019     Q2 2019 Earnings                                      19
Overview of Abbreviations and Definitions

ABBREVIATIONS AND DEFINITIONS

Adj. EBITDA             Net income before income taxes, net finance expense, amortization of fair value adjustments, depreciation and amortization, impairment losses,
                        restructuring expenses and one-off income and expenses
Adjusted EPS            Adjusted earnings per share after non-controlling interests, divided by 31.4m shares
Adjusted net income Net income before non-cash amortization of fair value adjustments, non-recurring effects of restructuring expenses, portfolio adjustments, the balance of
                    one-off income and expenses – including significant non-cash expenses – and the related tax effects
CAGR                Compound Annual Growth Rate
Capex                   Investments in tangible and intangible assets
EBIT                    Earnings before interest and taxes
EBITA                   Earnings before interest, taxes and amortization
EBITDA                  Earnings before interest, taxes, depreciation and amortization
FXN                     "Foreign currency neutral" - based on budgeted FX-rates
Gx ROCE                 Adjusted EBITA divided by capital employed (total assets minus investments, investments accounted for using the equity method and other loans, minus
                        cash and cash equivalents, minus pensions (without pension provisions), deferred tax liabilities, and income tax liabilities, minus prepayments received,
                        trade payables, and other non- interest bearing liabilities)
Gx RONOA             The ratio of adjusted EBITA to average net operating assets, comprising the sum of property, plant and equipment and net working capital
Adj. EBITDA Leverage The relation of net financial debt to adjusted EBITDA of the last twelve months, according to the credit facility agreement currently in place
Net financial debt   Short and long term debt minus cash and cash equivalents
Net finance expense     Interest income and expenses related to the net financial debt of the Gerresheimer Group. It also includes net interest expenses for pension provisions
                        together with exchange rate effects from financing activities and from related derivative hedges.
Net working capial
(NWC)                   Inventories plus trade receivables minus trade payables plus/minus prepayments

Op. CF margin           Adjusted EBITDA plus/minus the change in net working capital, minus capex and in relation to revenues
Operating cash flow     Adjusted EBITDA plus/minus change in net working capital, minus capex
P/E Ratio               Company's share price divided by the adj. EPS
RCF                     Revolving credit facility
yoy                     year-on-year

July 2019            Q2 2019 Earnings                                                                                                                                               20
Our Vision
Gerresheimer will become the leading global partner
for enabling solutions that improve health and well-being.
Our success is driven by the passion of our people.
You can also read