Credit Lunch Presentation Oddo - Stephane-Paul Frydman, SEVP Finance & Strategy and Group CFO - CGG
←
→
Page content transcription
If your browser does not render page correctly, please read the page content below
Credit Lunch Presentation
Oddo
Stephane-Paul Frydman, SEVP Finance & Strategy and Group CFO

Paris, December 14th 2015

Forward-Looking Statements

This presentation contains forward-looking statements, including, without limitation, statements about
CGG (“the Company”) plans, strategies and prospects. These forward-looking statements are subject
to risks and uncertainties that may change at any time, and, therefore, the Company’s actual results
may differ materially from those that were expected. The Company based these forward-looking
statements on its current assumptions, expectations and projections about future events. Although the
Company believes that the expectations reflected in these forward-looking statements are reasonable,
it is very difficult to predict the impact of known factors and it is impossible for us to anticipate all
factors that could affect our proposed results. All forward-looking statements are based upon
information available to the Company as of the date of this presentation. Important factors that could
cause actual results to differ materially from management's expectations are disclosed in the
Company’s periodic reports and registration statements filed with the SEC and the AMF. Investors are
cautioned not to place undue reliance on such forward-looking statements. The Company assumes
no obligation to update or revise any forward-looking or other statements. Actual results may vary
materially.

2

Industrial & Financial Review

FY 2014 and Q3 2015 are presented before Non-Recurring Charges (NRC), unless stated otherwise
CGG at a glance: An integrated business model in Geosciences
Market leader in geoscience industry globally and in each of its divisions,
providing a comprehensive range of leading geological, geophysical and
Diversified business
reservoir capabilities
Revenues split by activity(2)(3)
Market capitalisation of $0.5bn (as of December 10, 2015)
Around 7,200 staff working across the globe
Equipment
20%
Equipment targeting 25% of revenues
Contractual Data
Sercel, CGG’s Equipment division, is the world-leading designer
and manufacturer of land and marine seismic equipment and Acquisition 48%
3 business activities
reservoir monitoring instruments
GGR 32%
Contractual Data Acquisition targeting less than 15%
revenues
Geophysical data acquisition services include land, marine, multi-
physics and seabed, being operated either directly or through joint
ventures Revenues split by region(2)(3)
Geology, Geophysics & Reservoir (“GGR”) targeting
more that 60% of revenues
Key activities include developing and licensing multi-client seismic
surveys, processing seismic data, data and software management, 25%
reservoir consulting services
44%
9 months 2015 Financials
Revenues: $1,512m EBITDAS(1): $379m 20%
Net Debt: $2,538m OPINC(1): $(2)m 11%
APAC North America
Central and South America EAME
Note: (1) Before Non-Recurring Charges (2) External revenue (3) 9 months 2015
4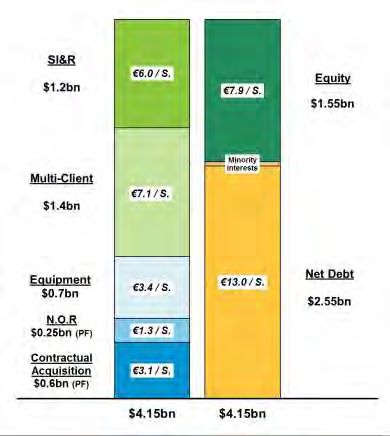
Market environment : A brutal change of paradigm
Price of Barrel seen now durably low within a
$40-60 range (2016-2018)
Different from June Vision where we were anticipating a price
of barrel recovery up to $70+ by year-end 2015 / mid 2016
2016 should be quite similar to 2015
No significant increase of the exploration budgets of the oil
companies during this period
~(10)%
Cut of Exploration programs impacted ~(40)%
significantly the Seismic Market
~(15/20)%
Marine contractual Acquisition market should remain
depressed over the two years
Equipment market should remain low
SI&R Market also expected to be somewhat lower in 2016,
although more resilient
Reshape our portfolio as if the present E&P context would last a few years
5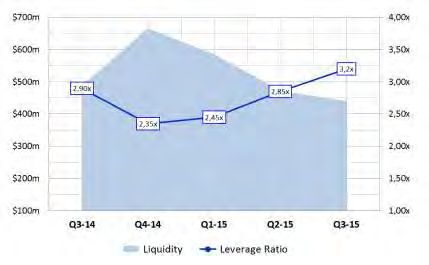
Our long-standing Strategic Rationale
Transform CGG, from a Seismic Acquisition Company into an Integrated
Geoscience Company
We have been pursuing this journey for the last two years
Today, we are intensifying our plan due to market conditions that could be lower for longer
Remain positioned over the three key seismic segments
Far less exposed to Marine Contract Acquisition, the most cyclical and capital intensive part of our
operations
Focused on our high added value businesses
6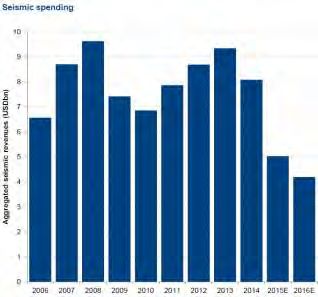
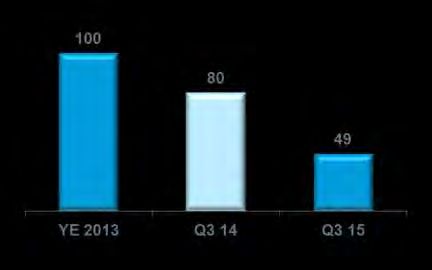
Transformation Plan: what we have delivered so far
                 Marine monthly cost structure                                                                     G&A expenses
Base                                                                                                      (m$)

                                                       (51)%                                                                  (55)%

            Full cost base including Depreciation & Amortization

                              Headcount(2)                                                                         Total Capex(1)
(number of employees)                                                                                     (m$)

                                                                                                                         (46)%
                                         (31)%

                                                                                                                                    [450/475]e
                                                                                                                                                 Q4
                                                                                                                                                 15e

                                                                                                                                                 3Q
                                                                                                                                                 15a

       Source: Company
       (1)     Excluding impact of variation of fixed asset suppliers of $3.5m for FY 2014 and $(3)m for 3Q 2015
7      (2)     Including Manufacturing temporaries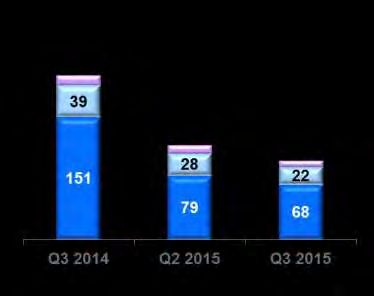
Transformation Plan: The next step
GGR representing more than 60% of revenue and Contractual Data Acquisition less than 15%
Portfolio
Operated fleet 2/3 dedicated to Multi-Client programs
Rebalancing
Focus on high-end added value businesses
Further Marine 3D fleet reduced from 11 to 5 vessels
Restructuring 3 vessels already cold-stacked by October-end, 3 more to come
Further Cost Further cost reduction plan across the Group and worldwide
Reduction Additional reduction of 930 positions worldwide
Capex Industrial Capex further reduced by 20% to $100/125m in 2015(e)
Reduction Multi-Client Cash Capex further reduced by 15% to $275/325m in 2015(e)
Cost of $950m non-cash write off
Transformation $200m of forward cash costs
Financing Group financing requirements: disposal of non-core assets and equity offering
8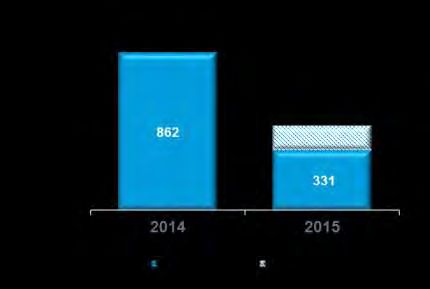
9
Equipment

10
Equipment: Impacted by lower volumes
Revenue
(In million $)
Marine Equipment
Sales at $103m, quite stable sequentially Land Equipment
180
Low volumes impacted by weak marine sales
40
71% Land and 29% Marine
107 103
Resilient OPINC margin at 4.8% 26 29
140
81 74
Year-To-Date
3Q’15 EBITDAs at $57m versus 3Q’14 at $143m Q3 2014 Q2 2015 Q3 2015
7.7% YTD 2015 OPINC margin OPINC
(In million $)
Sercel’s drivers
Continued cost reduction initiatives to lower breakeven 29
point
Land equipement sales driven by intensive production
16.2%
coming from existing and depleting ressources
7
5
6.3%
4.8%
Q3 2014 Q2 2015 Q3 2015
11Contractual Data Acquisition 12
Contractual Data Acquisition1: Deteriorated market conditions
Contractual Data
Acquisition Revenue
(In million $)
Total revenue at $152m, up 17% sequentially Land & MP
Marine
235
Contractual Marine revenue at $110m
60
Higher availability rate at 84%, compared to 74% in Q2
152
130
Land & Multi-Physics total revenue at $42m 42
175 44
110
Operating Income at $(24)m 86
Long-lasting poor pricing conditions in Marine mitigated by cost
cutting and better availibity rate Q3 2014 Q2 2015 Q3 2015
Year-To-Date: a huge year-on-year profitability drop Contractual Data
Acquisition OPINC
3Q’15 EBITDAs at $5m versus 3Q’14 EBITDAs at $92m (In million $)
3Q’15 OPINC at $(103)m versus to 3Q’14 OPINC at $(19)m Q3 2014 Q2 2015 Q3 2015
(4.8)% (15.6)%
With less than 2 vessels fleet, contractual marine (11)
(43.4)%
activity will be very low (24)
Will represent 7/8% of total group revenues
(57)
(1) New segment reporting (Cef. Appendix)
13GGR: Geology, Geophysics and Reservoir 14
GGR: Resilient profitability
GGR Revenue
Total revenue at $227m, down (12)% sequentially (In million $)
SI & Reservoir
MC Revenue
Multi-Client at $84m, down (30)% sequentially
305
Q3 and YTD cash prefunding rate at 83%
257
After-sales at $27m, down (25)% 227
172
137
Subsurface Imaging (SI) & Reservoir at $143m, 143
up 4% sequentially
133 120
Resilient activity in North America 84
Operating income at $47m, a 20.5% margin Q3 2014 Q2 2015 Q3 2015
Solid margin also supported by cost-cutting measures GGR OPINC
(In million $)
Year-To-Date 71
3Q’15 EBITDAs at $369m versus 3Q’14 at $486m
51
47
20% YTD 2015 OPINC margin
23.2% 19.9% 20.5%
Q3 2014 Q2 2015 Q3 2015
15GGR Multi-Client: Key driver for cash generation in 2016-17
Utilize 3 Marine vessels in average: Business Plan based on 36 vessel months Marine Capex
NBV Sep.15-end by age
Market-wise: High end positionning
Before 2013
No 2D Librairy, 100% 3D 13%
Not on the frontier exploration
Library 2014 41%
High number of data / sqkm
46%
Surveys to be
delivered
Harvest and continue to develop :
Strive for high prefunding (70%)
Harvesting our significant investments in Gulf of Mexico, Scandinavia, West Africa
Continuing to develop our core basins (Brazil, North Sea), and establishing large positions on specific basin,
Differentiate with technology (StagSeis, BroadSeis)
Reprocess old libraries, Mexico take-up with reprocessing opportunities
16Subsurface Imaging: a leading position driven by people
and technology
High skilled work force able to produce new algorithms and manage data exponential growth
Processing capacity c. 45 petaflops GOM seismic data density doubles every c.
installed by year-end 11th in the world 3 years requiring
12 000 billion operations per second (equivalent More powerful imaging algorithms
to NASA’s capacity)
Increased computing power
38 processing centers worldwide managing c.
250 petaoctet (10 times the volume of data
exchanged on Google every day)
Land seismic data density increasing with new
Sercel land equipment 508 xt sold in Middle East
1 TB
140 Processing Capability per km²
PBytes 45 StagSeis
PFlops
120 WAZ
40
CPU HD NAZ M-WAZ
100 35 NAZ
1 GB Early 3D
GPU 30 per km²
80 1st 3D
Disks 25
60 20
2D
15
40 1 MB
10 per km²
20 5
2009 2010 2011 012 2013 2014 2015
0
0
Drive the quality of the image sold to the client
17Financial Structure
Q3 2015: Cash management paying off
EBITDAs
(In million $)
EBITDAs at $122m
A 26.0% margin
208
Operating Cash Flow at $145m 112 122
30.0% 23.6% 26.0%
Capex at $98m
Multi-Client cash Capex at $68m, 83% prefunded
CAPEX
Free Cash Flow at $22 m versus $(64)m last Development Cost (In million $)
quarter Industrial and lease pool capex*
Multi-client cash capex
$(3)m including the non-recurring payments related to the on-
going Transformation Plan 202
3Q’15 Free Cash Flow at $(61)m versus $(267)m last year
117
98
* Excluding change in fixed assets payables
19Managing the liquidity and covenant headroom
Net debt and Liquidity by end of
September
Net Debt at $2,538m
o Leverage ratio (Net Debt over LTM EBITDA)
at 3.2x, below the 4.0x Cap
o Coverage ratio (LTM EBITDA over Cash
Interest) at 5.1x, above the 3.0x floor
Solid liquidity at $440m (versus $472m
by June-end)
Managing the Group Liquidity and Covenant headroom
Covenant Holiday by December-end 2015
Unfavorable EBITDAs comparison with record Q4 2014
However FY’15 current Free Cash Flow expected to be stable y-o-y
Preserve the Group Liquidity by proactively addressing Group Financing Needs
Transformation cost to be cashed out mostly in Q2-Q3 2016
20Progress on Refinancing plan
64 Group Net Debt at $2,497m as of
Debt Maturity Profile as of Q3-End 2015
end of September 2015
301
Issue of a Secured 2019 Term
275 650 Loan to refinance (i) part of the
500
47 165
448 2017 HYB (dragged by 2021/2022
39
50
135
47 130 Bondholders) and (ii) the Fugro
30 30 30 Loan (FL)
2016 2017 2018 2019 2020 2021 2022
Nordic Loan Unsecured High Yield Bond Convert. Bond (Debt Part)
Convert. Bond (Equity Part) Fugro Loan Revolving Credit Facilities • Loan 6.5% interest-weighted
and maturing May 2019
64
Targeted Debt Maturity Profile / Step 1
• $341m = $126m 2017 + $45m
301
2021 + $80m 2022 + $90m FL
39
341 605 Maturity at 4.3 years
448 420
275
165
50 130
30 30 30 Cash Cost at 5.30%
2016 2017 2018 2019 2020 2021 2022
Nordic Loan New Term Loan Unsecured High Yield Bond
Convert. Bond (Debt Part) Convert. Bond (Equity Part) Revolving Credit Facilities • 5.35% by end of Q3
21Financing plan: launch of the capital increase
Rationale:
Announced On December 7, 2015 to finance in particular its Transformation Plan
Size related to financing the transformation Plan in 2016-2017
Timing:
AGM on January 11, 2016 to delegate authority to the board of directors to decide on a capital
increase of a maximum amount of €350 million by issuance of ordinary shares with
preferential subscription rights
Subject to the approval of the general shareholders’ meeting and market conditions, this capital
increase will be launched as soon as possible following the general meeting
Publicly supported by Bpifrance (acting in concert with IFPEN) and by Total. Some of our
current shareholders have also expressed interest
22Sept-End 2015 Balance Sheet and breakdown of Capital Employed
$4.15bn Capital Employed by September-end
Net debt at $2.55bn / Minority Interests at $0.05bn
Equity at $1.55bn post Impairment and write-offs
$0.8bn Capital Employed for Contractual Data
Acquisition Post Impairment
$0.6bn on a pro forma basis (6 vessels cold-stacked)
More than half of the pro forma Capital Employed are
related to Investees (ARGAS, SBGS …)
$0.05bn Capital Employed for N.O.R
17
$0.25bn on a pro forma basis (6 vessels cold-stacked) 5
Assets: cold-stacked hulls and streamers in excess
Restructuring liabilities
$0.7bn Capital Employed for Equipment
50% of Inventories
$2.6bn Capital Employed for GGR, post Marine Capital Employed transfer and Impairment
$1.4bn Capital Employed for Multi-Client (including $1.05bn for the sole Library)
$1.2bn Capital Employed for Subsurface Imaging and Reservoir businesses (SI&R)
23Conclusion
A rebalanced company
A reduced exposure to Marine contract acquisition:
Fleet of 5 active vessels
2/3 of our fleet capacity to be dedicated to Multi-Client programs
GGR: A unique integrated geoscience platform with two key businesses
Subsurface Imaging and Reservoir, a global, leading position
Multi-Client: The combination of our latest data acquisition technology and subsurface imaging located in
key places
Equipment business generating cash and profit in very low volume
Overall, a new Group profile with reduced headcount, lower fixed cost base and
lower Capex needs
Additional 13% headcount reduction
Additional $50m cut in capex, leading close to 50% reduction y-o-y
A rebalanced company with GGR representing above 60% of revenue
and Contractual Data Acquisition 15% only
Resilient through a prolonged downturn
Strongly cash generative when the market bounces back
25Appendix
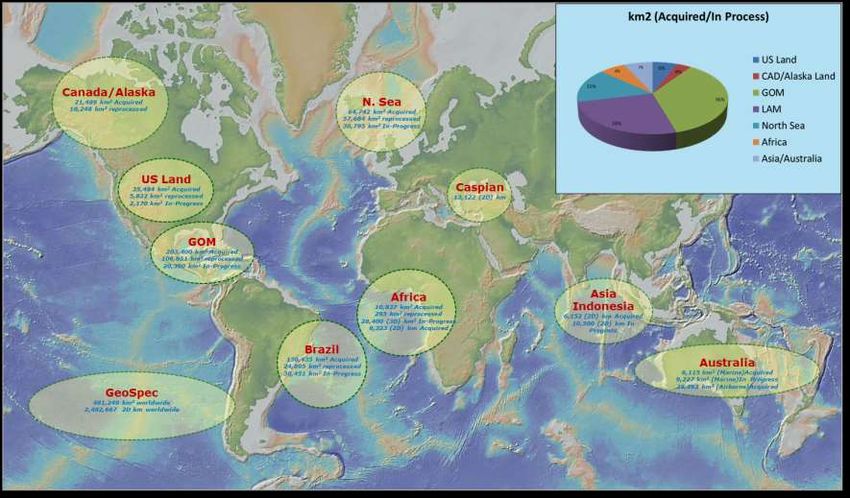
CGG Worldwide Library (End 2014): Focus on safe
harbors (GoM, Brazil, North Sea)

27
New segment reporting
Equipment: seismic equipment used for data acquisition, both onshore and offshore
No change to the existing segment
Contractual Data Acquisition: Marine offshore seismic data acquisition and Land and
Multi-Physics
Solely dedicated to external clients (proprietary market)
Geology, Geophysics & Reservoir GGR: Multi-Client and Subsurface Imaging and
Reservoir (SIR)
Marine capacity dedicated to Multi-Client, merged within Multi-Client BL of “GGR” segment
Representing 2/3 of 5 vessels’ time
Corresponding costs and capital employed directly incorporated within Multi-Client
Non Operated Resources: costs of the non-operated marine assets, as well as the
transformation costs related to cold-stacked assets
This segment will never have any revenue
28Non-Operated Resources (N.O.R)
Creation of this new reporting segment to improve Non-Operated Resources OPINC
quality of reporting (In million $)
60
Scope
Q3 2014 Q2 2015 Q3 2015
Cold-stacked vessels: maintenance costs and Hull
amortization (4)
(6) (5)
Amortization of streamers in excess 179 184
Restructuring current costs and liabilities
Operating Income before NRC at $(5)m in Q3
Amortization of excess streamers
Operating Income after NRC at $(10)m in Q3
29You can also read