Avian response to habitat restoration at Fernhill Wetlands - Interim report to Clean Water Services from Portland Audubon
←
→
Page content transcription
If your browser does not render page correctly, please read the page content below
Avian response to habitat restoration at
             Fernhill Wetlands

Candace Larson

       Interim report to Clean Water Services from Portland
                             Audubon
             Joe Liebezeit, Candace Larson, Jon Plissner, and Jay Withgott

                                   September 2019

                                           1
Introduction
Since the summer of 2015 Portland Audubon (PA) has been working with Clean Water
Services (CWS) to document the bird community response to the restoration effort at Fernhill
Wetlands. This interim report provides an update on this project and includes another year’s
worth of data analysis (through the fall of 2018). This report builds on the previous reports
which covered effort through the fall of 2017. In the interest of brevity we do not repeat a
description of the project background, goals/objectives, study design, and detailed methods in
this report unless something has changed. Please refer to the 2017 interim report for in-depth
project information1.
Methodology
Community science avian surveys
Since last reporting, community science effort at Fernhill Wetland using the protocol
developed by ASOP2 in 2015 has continued at a steady level with at least several surveys
conducted each month by experienced community scientists following the protocol methods.
Since the fall of 2015 when this project was started, 896 checklists have been submitted to
eBird for the Fernhill Wetlands NTS monitoring and 593 Fernhill Wetlands--area outside of NTS
(ASoP/CWS survey) from over 60 community scientists. PA continues efforts to build the
community science team at the site through social media promotion, occasional one-on-one
trainings, and targeted bird walks at the site. However, in the past year, two birders that
contributed a significant number of checklists to this data set (Steve Nord and Jon Plissner)
have moved out of the area. This has led to fewer submitted checklists in the past year (131
versus well over 200/year in previous years). Steve Nord has recently moved back and is
contributing to data collection again!
Formal avian surveys
PA has continued formal avian surveys at the site every fall and spring following the
protocol originally developed in 2015. The formal bird survey protocol includes point count
surveys, a line transect survey, and a separate survey of the large lake. We developed our
protocol based on standard protocols developed by others (Ralph et al. 19953, Lancia et al.
19964, Huff et al. 20005, Conway 20086). Three skilled biologists (Candace Larson, Shawneen
Finnegan, and Joe Liebezeit) conducted the formal surveys. Between fall 2015 and fall 2018 70
formal surveys have been conducted. Please contact Joe Liebezeit for a copy of the formal avian
survey protocol if desired.
1
Available upon request from Joe Liebezeit (jliebezeit@audubonportland.org)
2
Link to the protocol: https://audubonportland.org/wp-content/uploads/2019/04/fernhill_community_sci_protocol_revised_Feb2019.pdf
3
Ralph, C.J., G.R. Geupel, P. Pyle, T.E. Martin, and D.F. DeSante. 1993. Handbook of field methods for monitoring landbirds. Gen. Tech. Rep.
PSW-GTR-144. Albany, California: Pacific Southwest Research Station, Forest Service, U.S. Department of Agriculture. 41 p.
4
Lancia, R.A., J.D. Nichols, and K.H. Pollock. 1996. Estimating the number of animals in wildlife populations. Pps. 215-253 In T.A. Bookhout, ed.
Research and management techniques for wildlife and habitats. Fifth ed., rev. The Wildlife Society, Bethesda, MD.
5
Huff, M.H., K.A Bettinger, H.L. Ferguson, M.J. Brown, and B. Altman. 2000. A habitat-based point count protocol for terrestrial birds,
emphasizing Washington and Oregon. General Technical Report PNW-GTR-501. U.S. Department of Agriculture, US. Forest Service.
6
Conway, C. J. 2008. Standardized North American Marsh Bird Monitoring Protocols. Wildlife Research Report #2008-01. U.S. Geological
Survey, Arizona Cooperative Fish and Wildlife Research Unit, Tucson, AZ.
2Data prep - eBird Data
All available eBird data for Fernhill Wetlands was downloaded from 2010 through October
2018 and criteria for data inclusion in the analysis were maintained as reported in the previous
interim report. Pre-restoration data only included observations from 2010 through 2013 by
known, experienced community scientists whom also contributed post-restoration protocol
surveys. Post-restoration data included eBird data from mid-August 2015 through October
2018.
Data prep - Formal NTS survey data
Formal survey data from fall 2015 through fall 2018 were included in the analysis
constituting seven (four fall: 2015-18 and three spring: 2016-18) seasons. The point count
sampling only included birds up to 50m out from each of the six point count stations; so we did
not include analyses for that data set in this report. While the transect sampling is a better fit at
the Fernhill site we still recommend continued point count sampling at Fernhill in case, in the
future, CWS wants to compare bird communities across sites at a more regional level and only
point count data is available at other sites.
Statistical analysis
We used statistical analysis for this interim report developed for the previous interim report
using multivariate methods and also including a detection probability estimate for abundance
estimates. Multivariate methods (that include year and season as covariates) is a more
appropriate analyses than the previous univariate methods in previous reporting because it
controls for experiment-wise error. With this newer analysis we also control for detection
probability with the formal survey data.
To compare pre and post-restoration species richness we used general linear mixed model
(GLMM), with species richness and Shannon-Weiner index (species diversity) as response
variables, and treatment (pre- and post-restoration), and year as factors. Year post-restoration
is included as a fixed effect.
To compare pre and post-restoration species abundance we used GLMM, assuming a
Poisson distribution, with number of individuals/visit as response variables and season,
treatment (pre- and post-restoration) and year as factors.
To compare post-restoration changes in abundance we first used contingency analysis of
distribution of detections among distance bins for each species group and focal species to
determine detection rates. We then used GLMM (Poisson distribution) for regression of
abundance changes across years. For species diversity comparison we used GLMM with species
richness and Shannon-Weiner indices as response variables and year as factor.
To compare eBird and formal survey methodologies we used pair-wise comparisons (paired
t-test) for species richness and for abundance of all species groups.
3Results
Species richness pre and post restoration
70
2010
2011 eBird surveys
Mean number of species/survey
65 2012 Pre-restoration
2013
60 2015
2016
2017 Post-restoration
55
2018
50
45
40
35
30
Spring Summer Fall Winter
Figure 1. Species richness (# of species/survey) during the pre-restoration period (2010-2013) compared
to the post-restoration period (2015-2018) by season at Fernhill Wetlands.
30
2010
eBird surveys 2011
Pre-restoration
Shannon-Weiner Diverstiy
25 2012
2013
2015
20 2016
Post-restoration 2017
2018
Index
15
10
5
0
Spring Summer Fall Winter
Figure 2. Species diversity (Shannon-Weiner index) during the pre-restoration period (2010-2013)
compared to the post-restoration period (2015-2018) by season at Fernhill Wetlands.
Overall (seasons combined) species richness and diversity were not significantly
different between pre and post restoration periods (Species richness: Z = 0.81, P>0.05;
diversity: F = 1.20, P>0.05). Shannon-Weiner species diversity estimates indicate that
4species diversity varied significantly across seasons (F= 380.3, P
birds in summer during the post-restoration period compared to pre-restoration
(Z=2.23, df=14, P=.04). No other such comparisons indicated a significant difference.
     There were significantly more bird detections in fall and winter during both pre
and post restoration (mean abundance for fall and winter significantly greater than
overall mean, spring and summer abundance significantly less than the overall mean;
all P
At the guild level, seasonal differences in abundance varied per species group. As an example, in the spring, abundances approached statistical significance for higher grebe abundance post- restoration (P=0.05). For rails, post-restoration abundance was significantly higher (p0.05). Songbirds (primarily driven by Red-winged Blackbirds), wading birds (herons, egrets, etc.), and dabbling ducks all had significantly higher post- restoration abundances in the summer (all P
180
                                     2010         Mallard
                              160    2011
  Mean detections/survey             2012
                                                 eBird data
                              140
                                     2013
                              120    2015
                                     2016
                              100
                                     2017
                              80     2018
                              60
                              40
                              20
                               0
                                        Spring            Summer           Fall                  Winter
Figure 9. Mallard eBird detections at Fernhill Wetlands during pre-restoration (2010-13) and post-restoration
(2015-18) periods by season.

                              60
                                     Killdeer                                                   2010
                              50    eBird data                                                  2011
     Mean detections/survey

                                                                                                2012
                                                                                                2013
                              40
                                                                                                2015
                                                                                                2016
                              30                                                                2017
                                                                                                2018
                              20

                              10

                               0
                                        Spring                Summer       Fall                   Winter
Figure 10. Killdeer eBird detections at Fernhill Wetlands during pre-restoration (2010-13) and post-restoration
(2015-18) periods by season.

At the individual species level, we see the most dramatic responses between pre and post
restoration periods, and for many species, the patterns fit the predictions we made on species
group response to the restoration (see Table 1 in the 2017 report). For example, Red-winged
Blackbirds overall were detected significantly more post restoration versus pre-restoration (Z =
70.34, p < 0.001; Figure 8). Other species, like the Mallard, did not exhibit a clear overall
(seasons combined) difference in abundance pre and post restoration; although in the case of
Mallards, summer abundances were higher post-restoration (Figure 9). Similarly, for Killdeer,
overall annual differences in pre and post-restoration abundances were not significantly
different although there do appear to be some seasonal differences (e.g. higher detections in
spring post-restoration) (Figure 10). Virginia Rail abundances were also dramatically higher
                                                                       8
post-restoration however sample sizes are low so statistical test results to determine
significance are not possible at this point.
Post-restoration changes in species richness
40
Species richness from line-transect + lake surveys
Mean number of species/survey
35
30
25 2015
2016
20
2017
15 2018
10
5
0
Fall Spring
Figure 11. Species richness within the Natural Treatment System at Fernhill Wetlands post-restoration
period during fall and spring seasons (no formal surveys conducted spring of 2015).
In the fall, species richness has increased significantly in the four years post-restoration (Z=-
2.52, pPost-restoration changes in bird abundance
1200
Numbers of birds observed during fall transect + lake
surveys
1000
Mean detections/survey
2015
2016
800 2017
2018
600
400
200
0
Geese Dabbling ducks Songbirds All Birds
Figure 12. Average detections for all birds and most common bird guilds in the Fernhill
Wetlands NTS post-restoration during fall.
500
Numbers of birds observed during spring transect + lake surveys
450
Mean detections/survey
400 2016
350 2017
2018
300
250
200
150
100
50
0
Geese Dabbling ducks Songbirds All Birds
Figure 13. Average detections for all birds and the most common bird guilds at the Fernhill
Wetlands NTS post-restoration during spring (no formal surveys conducted spring of 2015).
1020 800
2015 Red-winged Blackbird
Virginia Rail
Mean detections/survey
2016 700
Mean detections/survey
15 2017 600
2018
500
10
400
5 300
200
0 100
Fall Spring 0
Fall Spring
250 12
Mallard Killdeer
Mean detections/survey
10
Mean detections/survey
200
8
150
6
100
4
50 2
0 0
Fall Spring Fall Spring
Figure 14. Select individual species detections at Fernhill Wetlands NTS during post-restoration (2015-18) during
fall and spring (no formal surveys conducted spring of 2015).
Overall bird abundance increased from year 1 post restoration (2015) to year 4 (2018) during
both the fall and spring although this trend was not a statistically significant (Figure 11 and 12).
We did not conduct formal bird surveys in the spring of 2015 as that was prior to the
partnership with PA and CWS. The increasing abundance during the post-restoration period is
likely explained by increasing habitat complexity as the vegetation planted during restoration
activities in 2014-15 has reached or is nearing maturation.
At the individual species level, for some species we documented increasing abundance
during the post-restoration period in fall (see Virginia Rail, Mallard, Red-winged Blackbird in
Figure 14) while others actually showed a less clearly defined response (see Killdeer in Figure
14). This is likely related to individual species life history and habitat preferences. Virginia Rail
and Red-winged Blackbirds require vegetation structure for cover and nesting. Killdeer prefer
more open habitats which was more prevalent early during the post-restoration period
although there appears to be a spike in this species abundance in fall 2018.
11Comparisons of eBird and formal survey - Species Richness
45
eBird surveys Comparison of survey methods for
40 species richness (n=63 survey dates)
Mean number of species/survey
Formal surveys (line-
transect+lake)
35
30
25
20
15
10
5
0
Fall 2015 Fall 2016 Spring Fall 2017 Spring Fall 2018 Spring All surveys
2016 2017 2018
Figure 15. Species richness comparison between eBird surveys and formal surveys (line-transect+lake) for each
season/year in the Fernhill NTS.
Overall species richness estimates are not significantly different between eBird and formal line-
transect surveys (T=-1.81, df=62, P=0.07). This suggests these two estimates are comparable.
Conversely, comparison of Shannon-Weiner index estimates (which combines species richness
and species evenness) indicates eBird surveys provide a significantly higher species diversity
estimate than formal surveys (T=5.51, df=62, PComparisons of eBird and formal survey - Species Abundance
1400
Comparison of survey methods for
1200
abundance of species groups (n=57 survey dates)
Mean detections/survey
eBird survey
1000
Formal survey (line-
transect+lake)
800
600
400
200
0
Dabbling ducks Geese&swans Songbirds All species All species excl. geese
Figure 16. Species abundance comparison between eBird surveys and formal surveys (line-transect+lake) for each
season/year in the Fernhill NTS.
Overall eBird survey estimates provided a higher abundance estimate compared to the formal
survey estimate although this was not statistically significant (T=1.66, df=56, P=0.10). When
geese were removed (almost entirely Cackling Geese) abundance estimates between the two
survey types are very similar and also not statistically different (T=0.24, df=56, P=0.81) (Figure
16).
13NTS wetland water levels
2.5 Spring 2016
Average Water Level in NTS Fall 2016
2
wetland (Feet) Spring 2017
Fall 2017
1.5
Spring 2018
Fall 2018
1
0.5
0
1 2 3 4 5 6 7 8 9 10
Survey replicate #
Figure 17. Average water levels in the NTS area (in Feet) as measure by three staff gauges during the bird
monitoring periods in spring (early April to early June) and fall (mid-August to mid-October) in 2016-18.
The average water level in the wetland NTS area (as measured from 3 water gauges placed
within 10m of the transect line – one in each NTS cell) during the bird survey period was less
than 1 foot except for in early April of 2017 and in both seasons in 2018 when levels rose to
over 2 feet during the early part of the survey period (Figure 17).
We originally intended to include water level information in our analyses as a predictor of
bird abundance. However, the data are not robust enough (only from 3 gauges) to include in
statistical analyses. This data still may be useful to CWS to provide a rough estimate on how
differences in water level may influence bird abundance and diversity.
Summary of key results
Surveys indicate no significant difference in species richness and species diversity
between the pre and post-restoration periods. Despite this, species richness numbers
are appear to be shifting higher in the most recent years. Species diversity was lower in
the winter seasons compared to spring and summer across pre and post-restoration
periods.
Overall bird abundance was not significantly different between the pre and post-
restoration periods. However, there were strong seasonal differences with more
detections of all birds in summer during the post-restoration period.
At the individual species level, we document significant differences between pre and
post restoration period abundance levels. For many species, the patterns fit the
predictions we made on species’ responses to the restoration based on individual
14species life history characteristics. Many species that require complex vegetation
structure showed a strong positive response (e.g. Virginia Rail, Red-winged Blackbird)
while other species that prefer open water or less vegetated habitat showed a negative
response.
In the fall, species richness has increased significantly in the four years post-restoration.
In the spring the trend is also increasing but not statistically significant. This is the first
year since monitoring began that we’ve documented a significant trending toward
increasing species richness. The gradual increase in avian species richness corresponds
to maturation of restored native vegetation at the site.
Overall bird abundance increased from year 1 post restoration (2015) to year 4 (2018)
during both the fall and spring although this trend was not a statistically significant. The
increasing abundance during the post-restoration period is likely explained by increasing
habitat complexity as the vegetation planted during restoration activities in 2014-15 has
reached or is nearing maturation (pers. comm. J. Kinnear).
At the individual species level, some species increased in abundance during the post-
restoration period (e.g. Virginia Rail and Red-winged Blackbird) while others showed the
opposite or neutral response (e.g. Mallard and Killdeer). This is likely related to
individual species life history and habitat preferences.
Overall species richness estimates were not significantly different between eBird and
formal surveys suggesting these two estimates are comparable. However, eBird surveys
provided a significantly higher species diversity estimate than formal surveys suggesting
that species diversity for the eBird surveys is likely driven largely by greater species
evenness since species richness is similar between the formal and eBird surveys.
Overall eBird and formal survey estimates of species abundance were not statistically
different indicating these two methods are comparable.
Future Direction
We expect vegetation conditions within the NTS are reaching maturity, particularly, the
shrub-scrub wetland habitat matures (J. Kinnear, pers. comm.). Presently it is unknown
what affects this may have on species patterns, so we recommend continued support of
these monitoring and assessment efforts for at least 5 years post-restoration (through
Spring 2020) so we can better understand the bird response to the NTS restoration. A 5-
year data set would provide more statistical rigor and better capture the range of inter-
annual variability at the site.
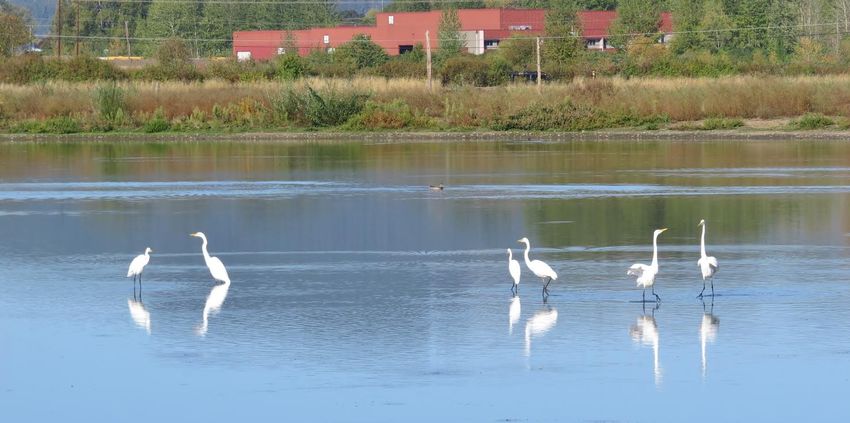
At Fernhill Wetlands we are learning important information for some species of
conservation concern including the Virginia Rail and shorebirds (as a group) that will
help inform broader restoration and conservation work with these species.
At the site level, habitat improvement is more of a question of trade-offs. Creating and
managing for more mud flat habitat (and the water levels that would be necessary to
maintain mudflats) during spring and fall migration on the big pond would provide more
15shorebird stopover habitat. Many shorebird species are experiencing declines and so,
from a conservation perspective, this could be a productive way for CWS to manage the
site. However, given limited space, expanding one type of habitat is going to be
decreasing other types of habitat.
Beyond the site scale, we recommend CWS manage its extent of properties in a way
that will maximize connectivity for birds and other wildlife species, and again, where
possible create habitats important for bird groups and species that are currently of
conservation concern. At some point CWS may want to consider restoring properties
adjacent to the Fernhill site to a more natural state. If birds have more habitat in the
immediate region around them, then it won’t matter as much if they get flushed from
the NTS area.
In terms of minimizing human disturbance at Fernhill Wetlands, at this time we don’t
recommend any new actions. The area of highest disturbance, particularly for
waterfowl, is on the perimeter of the big pond. At some point, CWS may want to
evaluate setting up a blind at the north end of the wetlands that offers good views of
the big pond.
Our results indicate the eBird community science counts can act as a good surrogate for
the formal counts when looking at overall bird abundance and species richness. It may
be in the interest of CWS to continue support and promotion eBird surveys beyond the
5-years post restoration if keeping track of the avifauna at this site is of interest in the
long-term.
16You can also read