Supplementary Information - GMD
←
→
Page content transcription
If your browser does not render page correctly, please read the page content below
Supplementary Information

     Supplementary Information 1

     Descriptions of the CNN model, employed computer, and parameter settings

     A CNN consists of multiple layers: an input layer, multiple hidden layers, and a single output layer. Information (data map)
 5   flows forward from the input layer, through the hidden layers and toward the output layer, which shows classification of the
     information. The building block of CNN is the artificial neuron. Each neuron receives one or more input signals, and
     calculates a weighted sum of input signals, and the resultant signal is transmitted to neurons in the next layer and so forth.
     Hidden layers of the CNN contain convolution layer(s), which is a learnable filter that activates when it detects some specific
     type of feature at some spatial position in the data map. Another important component of a CNN is the pooling layer(s),
10   which reduces the data map through down-sampling.

     We employed the LeNet CNN for this study. This CNN is composed of eight layers, one input, two sets of convolution and
     pooling layers, two fully connected layers, and one output layer. Intuitively, the convolution and pooling layers function as a
     feature extraction block, while fully connected layers function as a classification block. LeNet was originally developed for
     classifying handwritten digits (10 categories). Recent CNNs such as AlexNet and GoogLeNet contain a larger number of
15   hidden layers and were designed for classifying data maps into tens of thousands of categories. Here, as we categorize VCEs
     into only 15 categories, LeNet provides be a reasonable option for balancing capability and computational load.

     Besides the number of hidden layers, LeNet has some differences compared to other modern CNNs. In fully connected CNN
     layers, information is converted by an activating function before transmitting to the next layer. LeNet uses Sigmoid as an
     activation function, while other CNNs typically use the rectified linear unit (ReLU), which only transforms negative input
20   values into zero. For reducing the size of data map in the pooling layers, LeNet uses the subsampling approach, while other
     modern CNNs use the max pooling approach, which selects the maximum values in the assigned local data-map. Therefore,
     other CNNs should be explored for increasing accuracy for training, although this will increase the computational load.

     The computer employed to execute the learning had Ubuntu 16.04 LTS installed as the operating system and was equipped
     with an Intel Core i7-8700 CPU, 16 GB of RAM, and an NVIDIA GeForce GTX1080Ti graphics card, which accelerates the
25   learning procedure. On the computer, the NVIDIA DIGITS 6.0.0 software (Caffe version: 0.15.14) served as the basis for
     CNN execution, and LeNet was employed to train the CNN via the TensorFlow library. Parameter settings remained set to
     the default values, except for the “% for validation” parameter, which determines the fraction of training data to be allocated
     for validation of the trained model. Since different climatic datasets are used for validation purposes as described in the main
     text, the default value of 25% for the parameter was changed to 0%, thereby allocating the entirety of the data to training.

                                                                    1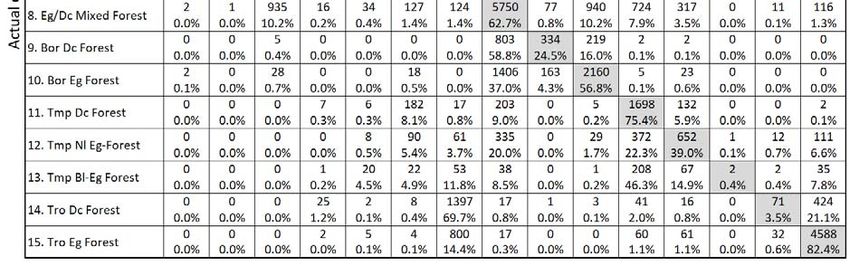
30   Unchanged parameters include the training epochs, which determine how many passes through the training data are
     performed, and the base learning rate, which determines how quickly the CNN learns. In the training of a CNN, neuron
     weights and biases were updated and adjusted repeatedly by using the supervised learning back-propagation algorithm along
     with the Stochastic-Gradient-Descent solver, which is the optimization function for adjusting weights according to the error
     they caused. The amount that the weights are updated during training is referred to as the learning rate. Learning rates that
35   are too small result in lower training efficiency and may get stuck on a local-optimal solution. By contrast, learning rates that
     are too large result in a less optimal solution, may cause oscillation of model performance over training epochs, and may
     result in a numerical overflow in the worst case. Here, we employed the step down procedure for the learning rate: it starts
     from 0.01, and when 33% of training epochs pass, the learning rate is multiplied by 0.1 (in the DIGITs implementations,
     policy is "Step Down", base learning rate is 0.01, step size is 33%, and gamma is 0.1). As we conducted 30 training epochs,
40   the learning rate was 0.01 during the 1st to 10th epochs, 0.001 during 11th to 20th epochs, and 0.0001 for 21th to 30th epochs.
     For all training in this study, we visually confirmed that the model performance gradually increases through training epochs,
     and no oscillation pattern was observed.

                                                                    2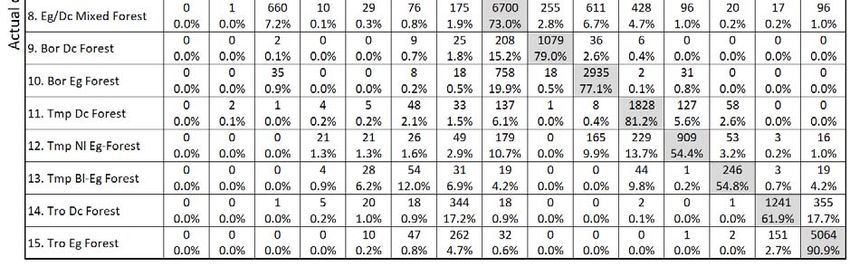
Table S1

45   Global climate datasets used in this study.

            Data ID                              Description                           Citation                   URL
     CRU TS                   Observation-based climate dataset. Monthly,                                 http://www.cru.uea.a
                              0.5° grid. Period available: 1901–2015.             Harris et al. (2020)
     v. 4.00                                                                                              c.uk/cru/data/hrg/
                              Climate dataset incorporating observations and
     NCEP/NCAR                numerical weather prediction model output.                                  https://rda.ucar.edu/d
                              Daily, T62 (latitude 94 × longitude 192). Period    Kalnay et al. (1996)
     reanalysis                                                                                           atasets/ds090.0/
                              available: 1948–present.
                               Output of the Hadley Centre Global
                              Environment Model version 2. Monthly,                                       https://esgf-
     HadGEM2-ES               latitude 1.25 degree × longitude 1.875 degree.      Collins et al. (2011)   node.llnl.gov/project
                              Period available: 1861–2005 (historical) and                                s/cmip5/
                              2006–2100 (future scenarios).
                               Output of the MIROC Earth System Model
                              version 2010. Monthly, T42 (latitude 64 ×                                   https://esgf-
     MIROC-ESM                longitude 128). Period available: 1861–2005        Watanabe et al. (2011)   node.llnl.gov/project
                              (historical) and 2006–2100 (future scenarios).                              s/cmip5/

     Reference
     Collins, W. J., Bellouin, N., Doutriaux-Boucher, M., Gedney, N., Halloran, P., Hinton, T., Hughes, J., Jones,
     C. D., Joshi, M., Liddicoat, S., Martin, G., O'Connor, F., Rae, J., Senior, C., Sitch, S., Totterdell, I., Wiltshire,
50   A., and Woodward, S.: Development and evaluation of an Earth-System model-HadGEM2, Geoscientific
     Model Development, 4, 1051-1075, 10.5194/gmd-4-1051-2011, 2011.
     Harris, I., Osborn, T. J., Jones, P., and Lister, D.: Version 4 of the CRU TS monthly high-resolution gridded
     multivariate climate dataset, Sci Data, 7, 109, 10.1038/s41597-020-0453-3, 2020.
     Kalnay, E., Kanamitsu, M., Kistler, R., Collins, W., Deaven, D., Gandin, L., Iredell, M., Saha, S., White, G.,
55   Woollen, J., Zhu, Y., Chelliah, M., Ebisuzaki, W., Higgins, W., Janowiak, J., Mo, K. C., Ropelewski, C.,
     Wang, J., Leetmaa, A., Reynolds, R., Jenne, R., and Joseph, D.: The NCEP/NCAR 40-year reanalysis project,
     B. Am. Meteorol. Soc., 77, 437-471, 1996.
     Watanabe, S., Hajima, T., Sudo, K., Nagashima, T., Takemura, T., Okajima, H., Nozawa, T., Kawase, H.,
     Abe, M., Yokohata, T., Ise, T., Sato, H., Kato, E., Takata, K., Emori, S., and Kawamiya, M.: MIROC-ESM
60   2010: model description and basic results of CMIP5-20c3m experiments, Geoscientific Model Development, 4,
     845-872, 10.5194/gmd-4-845-2011, 2011.

                                                                   3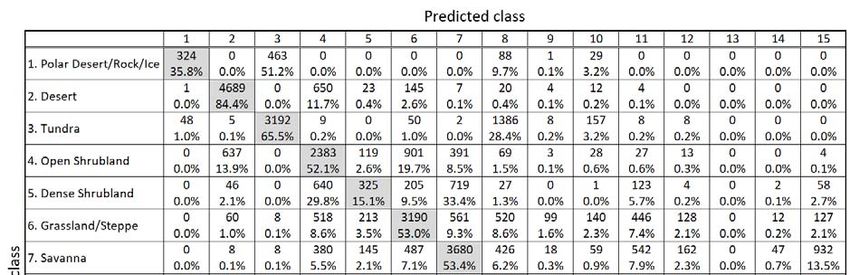
Table S2

     Influence of VCEs on training and test accuracies for simulation of the geographical distribution of terrestrial biomes using a
65   selection of different climate datasets. The values in brackets indicate the computational time for training. For each climate
     dataset, the annual mean bio-temperature and the annual precipitation from 1971 to 1980 were standardized and log
     transformed, then employed for drawing VCEs.

            Examples of VCE, representing                                      Test accuracy for each climatic data set
                                                    Training
        mean annual bio- temperature and                               NCEP/        HadGEM2            MIROC
                                                    accuracy                                                            Average
                    precipitation.                                     NCAR            -ES              -ESM
     A RGB colour tile. Red and green ranges
      were used to represent temperature and
      precipitation, respectively [15 minutes]
                                                     58.3%             45.6%          48.6%             41.3%            48.5%

     Two tiles using the “Topo.colour” colour
            scheme of R [34 minutes]

                                                     59.1%             45.2%          48.5%             41.6%            48.6%

      Two tiles using the “Gray.scale” colour
            scheme of R [23 minutes]
                                                     58.5%             45.4%          48.6%             41.8%            48.6%

            Two pie charts [22 minutes]

                                                     59.7%             45.2%          47.9%             41. 4%           50.9%

                                                                   4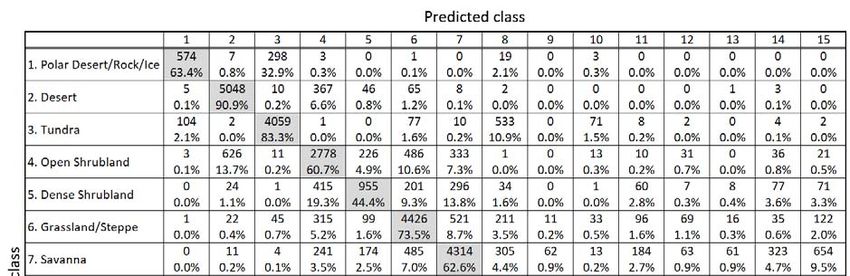
Table S3

70   Design of combination experiment of annual means of climatic variables and its resulting accuracies. “Air Temp” is the
     annual average of bio-temperature. “Prec.” is the annual precipitation. “Rad Short” is the annual average of downward
     shortwave radiation (whole day mean). “Humid” is the annual average of the volumetric humidity of air. For models with
     one climate variable, the selected climatic variable was allocated to the R channel. For models with two climate variables,
     the R and G channels were used. For models with three climate variables, all RGB channels were used.

                    Combinations of climate variables
                                                                                 Test accuracy for each climatic data set
      Model                 (annual means)                    Training
       no.         Air                 Rad                    accuracy      NCEP/        HadGEM2         MIROC
                             Prec                 Humid                                                                Average
                  Temp                 Short                                NCAR            -ES          -ESM
         1          ○                                          38.1%         34.3%         34.7%          31.5%         33.5%

         2                    ○                                35.2%         29.5%         31.8%          28.9%         30.1%

         3                              ○                      35.8%         30.9%         23.5%          21.0%         25.1%

         4                                          ○          36.3%         29,4%         33.2%          25.7%         29.5%

         5          ○         ○                                57.3%         45.6%         48.8%          41.4%         45.3%

         6          ○                   ○                      48.7%         39.9%         33.3%          30.8%         34.7%

         7          ○                               ○          54.3%         41.4%         45.6%          40.7%         42.6%

         8                    ○         ○                      52.1%         39.8%         40.5%          36.5%         38.9%

         9                    ○                     ○          52.3%         42.2%         46.5%          35.4%         41.4%

        10                              ○           ○          50.9%         38.4%         31.4%          27.6%         32.5%

        11          ○         ○         ○                      63.0%         46.4%         48.2%          44.6%         46.4%

        12          ○         ○                     ○          62.5%         45.1%         49.6%          42.2%         45.6%

        13          ○                   ○           ○          58.5%         41.5%         38.9%          35.3%         38.6%

        14                    ○         ○           ○          61.3%         42.0%         41.9%          36.6%         40.2%
75

                                                                 5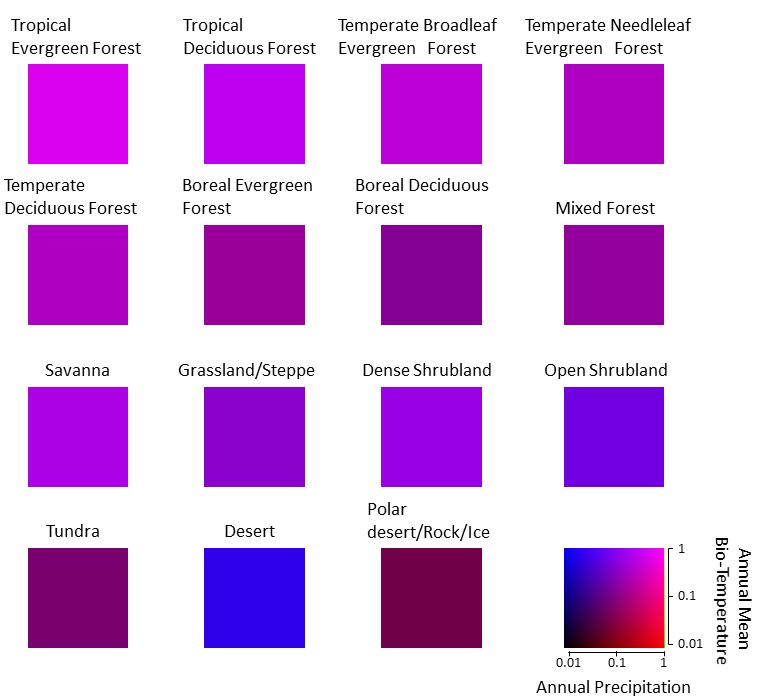
Table S 4

     Design of combination experiment of monthly means of climatic variables and its resulting accuracies. “Air Temp” is the

                     Combinations of climatic variables
                                                                                    Test accuracy for each climate data set
       Model                (monthly means)                     Training
        no.         Air                  Rad                    accuracy       NCEP/        HadGEM2          MIROC
                              Prec                  Humid                                                                Average
                   Temp                  Short                                 NCAR            -ES           -ESM
          1          ○                                           61.8%         51.3%          51.3%          39.2%        47.3%

          2                    ○                                 79.4%         41.7%          36.8%          33.9%        37.5%

          3                               ○                      61.2%         39.5%          29.7%          31.3%        33.5%

          4                                           ○          68.3%         39.7%          40.7%          34.8%        38.4%

          5          ○         ○                                 83.2%         52.7%          51.5%          43.5%        49.2%

          6          ○                    ○                      72.2%         51.8%          39.8%          36.9%        42.8%

          7          ○                                ○          73.7%         52.4%          49.4%          41.8%        47.9%

          8                    ○          ○                      80.5%         48.3%          43.4%          36.3%        42.7%

          9                    ○                      ○          81.5%         47.4%          48.7%          40.1%        45.4%

         10                               ○           ○          75.0%         48.4%          43.0%          38.6%        43.3%

         11          ○         ○          ○                      82.4%         52.1%          51.5%          42.6%        48.7%

         12          ○         ○                      ○          81.8%         51.8%          51.3%          41.2%        48.1%

         13          ○                    ○           ○          77.9%         54.9%          44.4%          42.9%        47.4%

         14                    ○          ○           ○          82.6%         49.7%          51.0%          41.8%        47.5%
     monthly average of the air temperature. Other climatic items are as described in the caption in table S3.

80

                                                                    6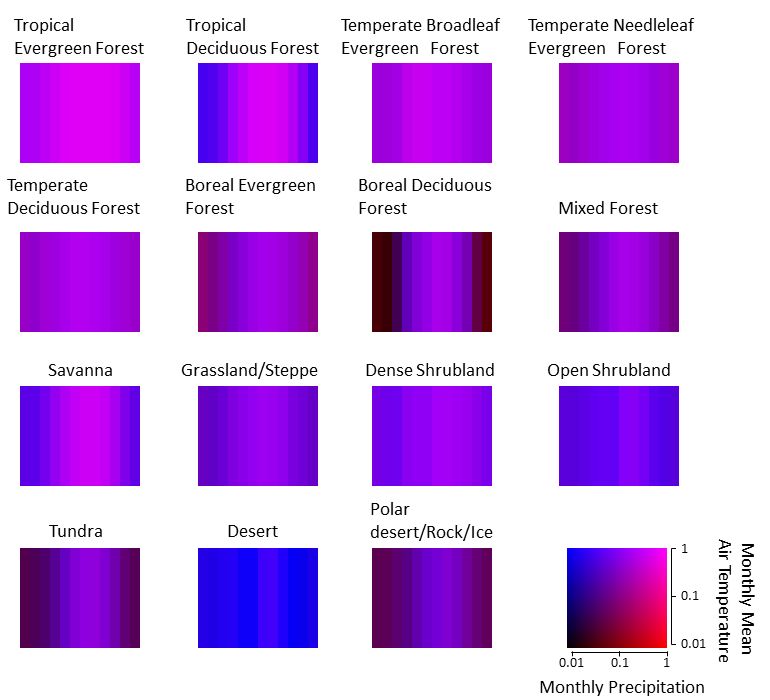
Table S5

     Influence of transformation of climatic variables for drawing VCE on training and test accuracies of the biome mapping
     simulations. Before drawing the VCE, each climatic item was standardized to between 0.0 and 1.0. These standardized
85   climatic variables were then transformed by one of the four transformation schemes for each experiment. Graphs on the
     leftmost column show how the original variables (horizontal axis) were transformed. This experiment employs VCE with a
     RGB colour tile, in which the red and green ranges represent the annual mean bio-temperature and annual precipitation,
     respectively.

             Scheme to transform                                     Test accuracy for each climatic data set
                                        Training
      climatic variables for drawing                     NCEP/          HadGEM2               MIROC
                                        accuracy                                                                Average
                   VCE                                   NCAR               -ES                -ESM
                  Linear

                                         57.8%           45.5%             41.3%              48.6%             45.1%

                  Log

                                         56.9%           45.9%             41.6%              48.2%             45.2%

            Sigmoid (gain=5)

                                         56.9%           45.3%             40.9%              48.5%             44.9%

           Sigmoid (gain=10)

                                         56.2%           44.5%             41.0%              48.3%             44.6%

90

                                                               7
Table S6
Design of how the monthly mean air temperature and monthly precipitation were superimposed to colour channels for
drawing VCE, and its resulting accuracies. “R”, “G”, and “B”, respectively, represent the red, green, and blue channels, of
the RGB colour representation. Although there are no major differences in the models of either the training or test accuracies,
95 we selected model no. 4, which has the highest average test accuracy.
Colour channel Test accuracy for each data set
Model Training
NCEP/ HadGEM2 MIROC
no. Air temp Prec accuracy Average
NCAR -ES -ESM
1 R G 81.2% 53.2% 52.2% 42.7% 49.4%
2 R B 81.8% 52.4% 52.3% 42.8% 49.2%
3 G R 81.3% 53.2% 50.5% 43.2% 49.0%
4 B R 81.4% 52.9% 52.4% 43.6% 49.6%
5 G B 82.7% 53.6% 52.3% 42.3% 49.4%
6 B G 81.4% 52.7% 51.0% 44.0% 49.3%
8Table S7
Confusion matrix for biome classification for training accuracy with annual mean bio-temperature and annual precipitation.
100 Columns represent the true classes, while rows represent the CNN model prediction. The shaded cells along the upper-left to
lower-right diagonal represent correct classifications. For each cell, the upper line indicates the number of simulation grids,
while the lower line indicates its percentage within the column, which in turn indicates the fraction of correct classifications
of the corresponding biome class.
105 Percentage of correct classification for all grids: 57.7%.
Abbreviations: Bor, boreal; Tmp, temperate; Tro, tropical; Eg, evergreen; Dc, deciduous; Nl, needleleaf; Bl, broadleaf.
9Table S8
Same as table S7, but confusion matrix for biome classification for training accuracy with monthly mean air temperature and
110 monthly precipitation.
Percentage of correct classification for all grids: 73.6%.
Abbreviations: Bor, boreal; Tmp, temperate; Tro, tropical; Eg, evergreen; Dc, deciduous; Nl, needleleaf; Bl, broadleaf.
10115 Table S9
CNN model accuracies for biome distribution simulations. These accuracies were obtained using the model trained by the
climatic dataset on the row, with the climate dataset on the column as an input reconstruction. Therefore, the shaded cells
show the accuracy when the climate datasets for training and reconstruction were identical. For each climate dataset, the
monthly mean-temperature and monthly precipitation during 1971 to 1980 were standardized and log transformed, then used
120 for drawing the RGB-colour tile VCEs.
CRU NCEP/NCAR Miroc-ESM HadGEM2-ES
CRU 0.736 0.559 0.478 0.512
NCEP/NCAR 0.553 0.704 0.431 0.485
Miroc-ESM 0.540 0.394 0.701 0.417
HadGEM2-ES 0.430 0.505 0.450 0.712
Table S10
Results of the sensitivity test in which training and test accuracy were compared among models trained and validated using
monthly climate averaged over one of three time periods.
Test accuracy
Training
Time period NCEP/ HadGEM2 MIROC
accuracy Average
NCAR -ES -ESM
10 years (1971-1980; Control) 81.4% 52.9% 52.4% 43.6% 49.6%
20 years (1961-1980) 77.5% 52.2% 52.4% 44.8% 49.8%
30 years (1951-1980) 76.0% 52.4% 52.7% 43.7% 49.6%
Table S11
125 Results of the sensitivity test in which training and test accuracy were compared among models trained using one of four
aggregation grains of training data grids. Test accuracy for the CRU dataset in this analysis was obtained by model
evaluation for grains not used in training.
Aggregation grain Test accuracy
Training
of CRU data grids NCEP/ HadGEM2 MIROC
accuracy CRU
NCAR -ES -ESM
1×1 (0.5°) 80.2% 80.4% 53.1% 50.5% 43.5%
2×2 (1.0°) 80.6% 78.2% 53.3% 51.4% 42.9%
4×4 (2.0°) 81.2% 76.1% 52.8% 51.7% 43.9%
8×8 (4.0°) 81.0% 72.2% 52.7% 51.2% 42.6%
11Figure S1
130 Examples of training images representing annual mean bio-temperature and annual precipitation of the CRU dataset.
Climatic conditions averaged over 1971 to 1980 for each biome type were employed. The bottom-right image shows how the
panel colour was determined by standardized climatic variables.
12135 Figure S2
Examples of training images representing monthly mean air temperature and monthly precipitation from the CRU dataset.
Climatic conditions, averaged from 1971 to 1980, for each biome type were employed. For the Northern hemisphere, the
leftmost pillar represents the January climate, while rightmost pillar represents the December climate for each image. For the
Southern hemisphere, the leftmost pillar represents the July climate, while the rightmost pillar represents the June climate for
140 each image. The image at the bottom-right corner shows how the pillar colour was determined from the standardized climatic
variables.
13Figure S3
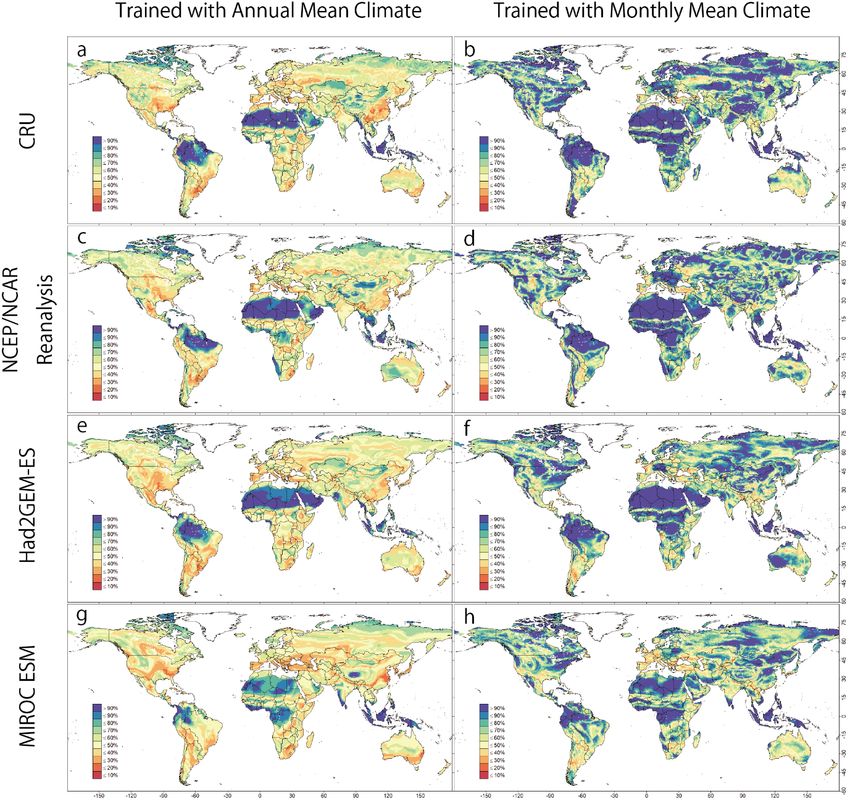
145 Geographical distribution of certainty of the most plausible biome from the CNN model that was trained with either annual
(a, c, e, g) or monthly (b, d, f, h) mean climate images from the CRU dataset. Four climatic datasets were employed to
generate these maps. (a, b) CRU dataset; (c, d) NCEP/NCAR dataset; (e, f) output of the Had2GEM-ES dataset; (g, h) output
of the MIROC-ESM dataset.
150
14Figure S4
(a) Annual mean air temperature and (b) annual precipitation averaged from the 1971–1980 period of the CRU dataset. (c)
Differences in annual mean air temperature (1971–1980 average) and (d) annual precipitation (1971–1980 average) between
the CRU dataset and the NCEP/NCAR reanalysis data. The CRU and HadGEM2-ES dataset outputs for mean air
155 temperature and annual precipitation are presented in (e) and (f), respectively. Similarly, the CRU and MIROC-ESM dataset
outputs for mean air temperature and annual precipitation are presented in (g) and (h), respectively.
15Figure S5
160 Global biome compositions computed by the CNN model using monthly means of two climate models (Had2GEM-ES and
MIROC-ESM) under historical (1971–1980) and future (2091–2100) climatic conditions. Future climatic conditions were
further divided into two scenarios (RCP2.6 and RCP8.5). Differences in grid areas along the latitude were taken into
consideration. Colour definitions are available in figure 1.
165
16Figure S6
(a) Mean annual air temperature and (b) annual precipitation averaged from the 1971–1980 period of the HadGEM2-EM
dataset. Changes in (c) mean annual air temperature and (d) precipitation from 1971–1980 to 2091–2100 under the RCP2.6
scenario. Changes in (e) mean annual air temperature and (f) precipitation from 1971–1980 to 2091–2100 under the RCP8.5
170 scenario.
17Figure S7
Same as figure S6, but with the MIROC-ESM dataset.
175
18Figure S8
Same as figure 4, but certainty map of the predicted biome.
19You can also read