Alaska Statewide Climate Summary April 2020
←
→
Page content transcription
If your browser does not render page correctly, please read the page content below
Alaska Statewide Climate
Summary
April 2020
APRIL 2020 HIGHLIGHTS:
• THE APRIL TEMPERATURES WERE 4º TO 8ºF HIGHER THAN AVERAGE FROM THE
ALEUTIAN ISLANDS ALONG THE BERING SEA COAST TO ALASKA’S ARCTIC AND THE
NORTH SLOPE.
• UTQIAĠVIK SET A NEW DAILY RECORD FOR LOWEST MINIMUM TEMPERATURE OF -
20°F ON APRIL 29TH. THIS IS THE FIRST RECORD COLD LOW SET IN UTQIAĠVIK SINCE
DECEMBER 2007.
• SNOWPACK IS ABOVE NORMAL IN THE INTERIOR, WESTERN ALASKA, SOUTHEAST
ALASKA AND THE SUSITNA BASIN. THE SNOWPACK ACROSS THE TANANA BASIN
EXCEEDS 2.5 THE NORMAL VALUE.
• LATE SPRING SNOWFALL CONTRIBUTED TO 400% OF THE NORMAL PRECIPITATION
AMOUNT FROM THE NORTH SLOPE TO PARTS OF ALASKA’S INTERIOR. THE WEST
COAST RECEIVED TWO TO THREE TIMES THE NORMAL PRECIPITATION
• FLOOD HAZARDS ARE SIGNIFICANT DUE TO RIVER ICE BREAKUP.
• A RECORD BREAKING ARCTIC OZONE HOLE DISAPPEARED AGAIN DURING APRIL. THE
HOLE REACHED ITS MAXIMUM MID-MARCH AND GREW TO COVER AN AREA ABOUT
THREE TIMES THE SIZE OF GREENLAND BEFORE SHRINKING.
The following report provides an overview of the April weather. The report is based on data from
selected weather stations throughout the state of Alaska. “Departure from normal” refers to the
climatological average over the 1981-2010 period.
Temperature
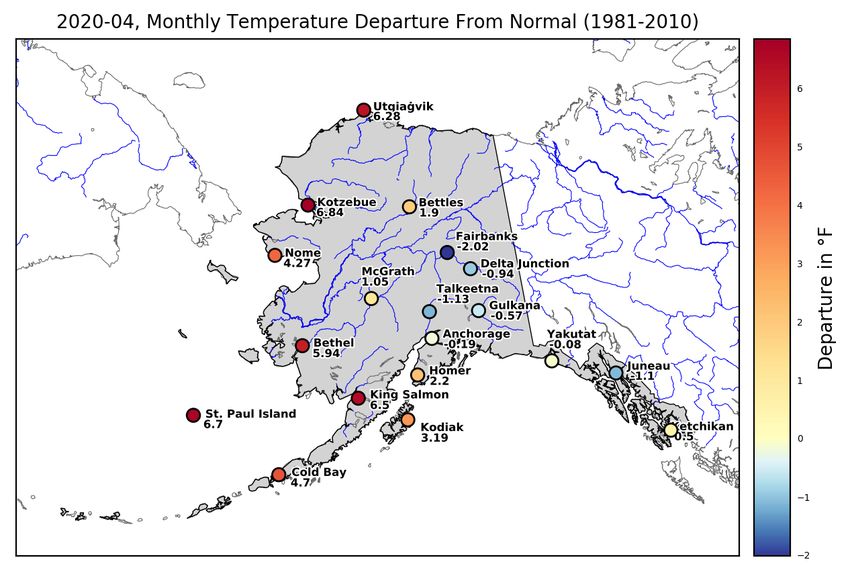
In April 2020, the North Slope and West Coast of Alaska were significantly warmer than normal
(Figure 1, Table 1). The warmer than normal temperatures extended to the Interior as far as
McGrath and Bettles. Atqasuk and Umiat were 9.8ºF warmer than normal. The observed
monthly average temperatures at Kotzebue were 20.1°F, 6.8°F above normal. St Paul Island
followed closely with temperatures 6.7°F above normal. King Salmon and Utqiaġvik recorded
1
Alaska Climate Research Center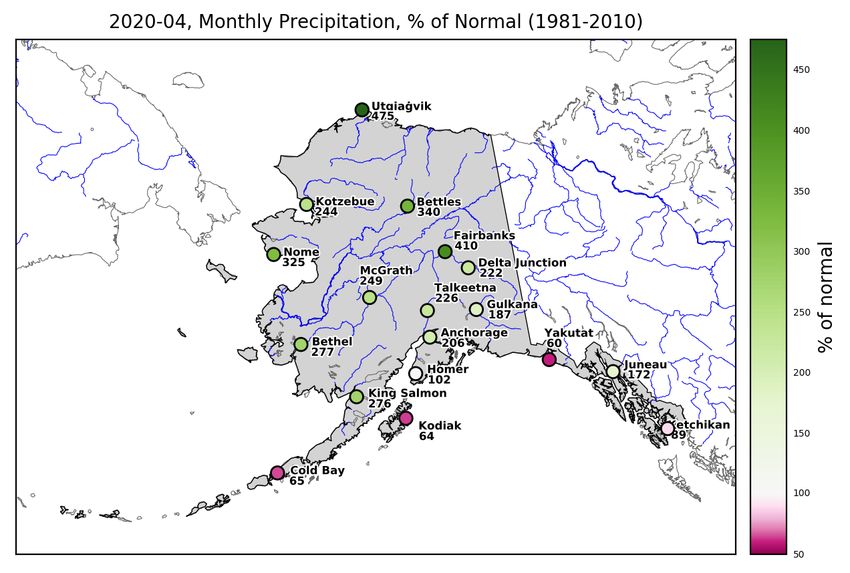
temperatures 6.5°F and 6.3°F above normal respectively. On the other hand, parts of the Interior,
including Fairbanks and Delta Junction recorded colder than normal temperatures. The colder
than normal temperatures extended south into Talkeetna and Anchorage and to Yakutat and
Juneau in the Panhandle. Two cold periods observed during the beginning and end of April
caused an average Fairbanks temperature of 30.5°F, 2°F colder than normal. Juneau and
Talkeetna followed with average temperatures 1.1°F below normal in both locations.

Multiple stations set new records for mean, minimum, and maximum daily temperatures on
specific days during April 2020. Cold Bay set a new daily record for highest maximum
temperature on April 4th of 57°F, 8°F higher than the old record of 49°F set last year. King
Salmon set new daily records for highest average temperature over multiple days, notably setting
a new record on April 16th of 50.5°F, 8°F higher than the previous record of 42°F set in 1940. A
similar record of 53°F was set the next day, 9°F higher than the previous record of 44°F set in
1998. Utqiaġvik set a new daily record for lowest minimum temperature of -20°F on April 29.
The previous record was -19°F in 1968. This was the first record lowest minimum daily
temperature set in Utqiaġvik since December 21, 2007. All values and dates are listed in Table
A1, A2 and A3 in the appendix.

            Figure 1: Monthly mean temperature departure from normal, April 2020.

Figures 2 and 3 show mean daily temperature departures from normal for 2020 in Ketchikan and
King Salmon. While red and blue bars represent positive and negative departures from normal
                                                                                                2
Alaska Climate Research Center
mean daily temperatures, red and blue lines represent the highest and lowest values of mean daily
temperature on record for each day of the year. Days in which red bars (positive departures) are
higher than the red line indicate high mean daily temperature records (Figure 2, Table A1). As an
example, King Salmon set new daily records for maximum mean temperature on April 14th, April
16th through the 18th, and April 20th (Figure 3, Table A1). The observed King Salmon temperatures
were above normal except for 4 days throughout the month.

Table 1: Mean monthly air temperature, normal (1981-2010) and departure for selected stations
throughout the state, April 2020.

             Station            Observed (°F)     Normal (°F)      Departure (°F)
             Anchorage               36.6              36.8              -0.2
             Bethel                  32.8              26.9               5.9
             Bettles                 25.2              23.3               1.9
             Cold Bay                38.7               34                4.7
             Delta Junction          31.4              32.2              -0.9
             Fairbanks               30.5              32.6               -2
             Gulkana                 31.3              31.9              -0.6
             Homer                   39.1               37                2.2
             Juneau                  39.8              40.9              -1.1
             Ketchikan                43               42.5               0.5
             King Salmon             40.2              33.7               6.5
             Kodiak                  40.8              37.6               3.2
             Kotzebue                20.1              13.3               6.8
             McGrath                 30.8              29.7               1.1
             Nome                    24.8              20.5               4.3
             St. Paul Island         35.8              29.2               6.7
             Talkeetna               34.7              35.8              -1.1
             Utqiaġvik                8.1               1.8               6.3
             Yakutat                 37.7              37.8              -0.1

                                                                                                3
Alaska Climate Research Center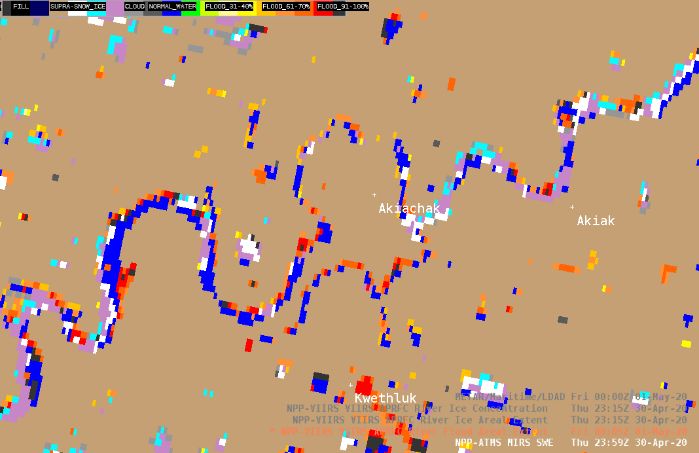
Figure 2: Ketchikan daily mean temperature departures from normal (1981-2010) for 2020. Red
and blue bars represent positive and negative temperature departures. Grey line represents the
mean normal temperature, red and blue lines represent respectively the historic highest and lowest
records of mean daily temperature.

Figure 3: King Salmon daily mean temperature departures from normal (1981-2010) for 2020. Red
and blue bars represent positive and negative temperature departures. Grey line represents the
mean normal temperature, red and blue lines represent respectively the historic highest and lowest
records of mean daily temperature.

                                                                                                4
Alaska Climate Research Center
Figure 4: Daily mean temperature departures for each day in April 2020, at the selected stations.
April started out colder than normal over Anchorage and the Panhandle, while the North Slope,
Interior, and West Coast were warmer than normal. On the 4th through the 6th, a winter storm
brought colder air blowing from the north with gusts up to 28 knots (32 mph) into the West
Coast and Interior causing temperatures in those regions to fall below normal. Storm systems
moved across the Yukon Delta through the Interior and brought snow into the interior on the 9th
through the 11th. On the 13th, warm air moved into the Southcentral region from the southeast
while storms moved across the Interior bringing warmer air blowing from the south and
southeast. Another low pressure system moved through the West Coast and into the Interior on
the 15th; warmer air and rain was observed across most of Alaska. The week of the 20th,
Fairbanks and parts of the Interior were again cooler and drier due to high pressure over the
5
Alaska Climate Research Centerregion. On April 27th, the high pressure extended to the south, bringing clearer skies and cooler
than normal temperatures to Anchorage and the West Coast.
Precipitation
Precipitation in April, similar to that in March, was significantly above normal across most of
Alaska. The North Slope received regionally more than 300% of the normal snowfall amount.
Precipitation along the northern Pacific was decreased. Snowfall events and some rain events
from the Interior to the Bering Sea caused observed precipitations sums to amount to 200% to
300% of the average precipitation
Regions along the Gulf of Alaska and the Aleutian Islands were drier than normal. These drier
regions include Cold Bay, Kodiak, and Yakutat. Only 65% of the normal April precipitation was
recorded along the Southern Aleutians.
Utqiaġvik recorded 0.8 inches (Snow Water Equivalent or SWE) of snow, 475% of normal
precipitation. Fairbanks received 1.3 inches of precipitation as a combination of SWE and
rainfall, 409.7% of normal. The precipitation in Fairbanks included 7.9 inches of snowfall, 272.4
percent of long-term normal snowfall for April. It snowed in Fairbanks on April 3rd through the
7th and on the 10th. On April 13th, Fairbanks received 0.08 inches of freezing rain. Fairbanks
received a tenth of an inch or less of rainfall per day on April 15th through the 20th; 0.12 inches of
rain fell on the 21st. Bettles similarly was wetter than normal; 12.7 inches of snowfall were
measured in Bettles exceeding the long-term normal snowfall by 201.6%. Nome received 325%
of normal precipitation, as a mix of snow and rain. Bethel and King Salmon reported 277% and
276.3% of normal precipitation. McGrath and Kotzebue received 248.6% and 244.4% of normal
precipitation respectively. Anchorage received 1.0 inch of precipitation, 206.4% of normal; this
included 5 inches of snow, 125% of normal snowfall. It snowed in Anchorage on April 2nd
through the 5th. On April 12th, there was a mix of snow and rain in Anchorage. On the 13th, it
rained 0.03 inches. There was 0.12 inches of rain on the 15th and 0.01 inches on the morning of
the 16th. There was a trace of rain in Anchorage on the 17th and 18th. There was at least 0.1
inches of rain each day from April 21st through the 24th. The 25th through 29th were dry and it
rained 0.07 inches on the 30th. Juneau received 5.1 inches of mostly rain and little snow, 172.4%
of normal; this included 0.1 inches of snowfall, 9.1% of normal. There was a mix of rain and
snow on the 6th, with Juneau receiving 0.01 inches of precipitation. It rained in Juneau April 13th
through the 17th and April 20th through the end of the month. The wettest days in Juneau were
April 22nd with an inch of rainfall, followed by April 27th with 0.79 inches of rainfall.
Yakutat was drier than normal, reporting 5.5 inches of precipitation, 60.2% of the long-term
normal for the month. Kodiak and Cold Bay similarly received 64.0% and 64.9% of normal
precipitation respectively.
Comparisons of precipitation (rain plus SWE) measurements with the 1981-2010 normal data are
provided in Table 2 and Figure 6. Nome set a new record for April precipitation with a total of
2.47 inches for the month. The previous record was 2.15 inches in 1961.
6
Alaska Climate Research CenterNoteworthy snow events:
There were some days in early April with high snowfall amounts as strong systems passed
through the state. On April 2nd, Anchorage received 2.4 inches of snowfall followed by another
2.0 inches on April 3rd. The 1981-2010 normal snowfall for April in Anchorage is 4.0 inches. On
April 4th, Bettles reported 3.7 inches of snowfall, more than half of the 6.3 inches that Bettles
normally receives in April. The same day, Fairbanks received 2.8 inches of snowfall, almost
equal to the average of 2.9 inches of snowfall in Fairbanks normally receives in April. On April
5th and 6th, Bettles reported 2.0 inches and 1.6 inches of snowfall respectively. On April 10th,
Fairbanks received 3.6 inches of snowfall and Bettles received 2.4 inches of snowfall.
Figure 5: Monthly precipitation sums expressed as percent of normal (1981-2010), April 2020.
7
Alaska Climate Research CenterTable 2: Monthly precipitation sum, normal (1981-2010) and departure expressed as a percentage
of the normal (1981-2010) for selected stations throughout the state, April 2020.
Station Precipitation (in) Normal (in) % of normal
Anchorage 1.0 0.5 206.4
Bethel 2.0 0.7 277
Bettles 2.0 0.6 340
Cold Bay 1.6 2.4 64.9
Delta Junction 0.5 0.2 221.7
Fairbanks 1.3 0.3 409.7
Gulkana 0.4 0.2 187.5
Homer 1.1 1.1 101.9
Juneau 5.1 2.9 172.4
Ketchikan 8.4 9.4 89.3
King Salmon 2.7 1.0 276.3
Kodiak 3.7 5.8 64
Kotzebue 1.3 0.5 244.4
McGrath 1.8 0.7 248.6
Nome 2.5 0.8 325
Talkeetna 2.9 1.3 226.4
Utqiaġvik 0.8 0.2 475
Yakutat 5.5 9.2 60.2
8
Alaska Climate Research CenterFigure 6: Monthly precipitation sums for April 2020 at the selected stations compared to the
normal (1981-2010), in inches.
Table 3: Monthly snowfall sum, normal (1981-2010) and departure expressed as a percentage of
the normal (1981-2010) for the selected stations that measure snowfall, April 2020.
Station Snowfall (in) Normal (in) % of normal
Anchorage 5.0 4.0 125
Bettles 12.7 6.3 201.6
Fairbanks 7.9 2.9 272.4
Juneau 0.1 1.1 9.1
Snowpack
The Interior, western Alaska, Southeast Alaska, and the Susitna Basin all have above normal
snowpack (NRCS Alaska Snow Survey Report, May 2020). The Tanana Basin has above normal
snowpack, averaging 256% of median across the basin (Table 4). With 14.4 inches of water
9
Alaska Climate Research Centercontent, Cleary Summit Snow Course set a new all-time record high snowpack. The previous
record was 13.8 inches set in April 1993. The Koyukuk Basin has above normal snowpack, but
less than last year. Portions of the Kuskokwim basin have much above normal snowpack.
McGrath has twice the normal snowpack. The Upper Yukon Basin has above average snowpack,
with 136% of median 1981-2010 snowpack. The measured snowpack in the Central Yukon
Basin is above normal. The Koyukuk Basin has 132% above median snowpack, but less than last
year when there was 178% of median snowpack. The Seward Peninsula received much above
normal precipitation during April, but snowpack there is less than the last two years. Storms in
the Susitna Valley kept snowpack there at above normal levels. The snow sites in the Susitna
Valley averaged 151% of normal snowpack. Southeast Alaska averaged 130% of median
snowpack for April, compared to 34% last year.
The Kenai Peninsula and portions of Southcentral Alaska have below normal snowpack.
Snowpack in the Northern Cook Inlet area is well below normal, with sites averaging 57% of
normal. The snowpack on the Kenai Peninsula is the lowest across the state, with stations
averaging 24% of median snowpack.
Table 4: Current and previous year Basin Index (% of 1981-2010 median snowpack water
content) for selected river basins throughout the state, May 1, 2020. (source: NRCS Alaska Snow
Survey Report, May 2020)
Basin Index Basin Index
Basin Current % of Median Last Year % of Median
Upper Yukon Basin 136 53
Central Yukon Basin 156 143
Tanana Basin 256 93
Koyukuk Basin 132 178
Kuskokwim Basin 240 90
Copper Basin 129 81
Matanuska-Susitna Basin 151 79
Northern Cook Inlet 57 54
Kenai Peninsula 24 60
Western Gulf of Alaska 52 54
Southeast Alaska 130 34
Drought Conditions
Alaska continued to be free of abnormal dryness and drought through April 2020 (Figure 7). In
the April 7, 2020 drought summary, National Resources Conservation Service SNOTEL stations
across the Interior reported above normal SWE levels, while numerous stations further south on
the Kenai Peninsula were well below normal. (source: https://droughtmonitor.unl.edu/).
10
Alaska Climate Research CenterFigure 7: U.S. Drought Monitor map for Alaska, updated on April 28, 2020. The table on the right
shows the percent area affected by different categories of drought intensity. Figures and data
produced and released by the U.S. Drought Monitor, a partnership between the National Drought
Mitigation Center at the University of Nebraska-Lincoln, the United States Department of
Agriculture, and the National Oceanic and Atmospheric Administration
(https://droughtmonitor.unl.edu).
RIVER ICE
After a cold winter with above normal snowfall, the National Weather Service (NWS) and the
State Emergency Operations response manager have warned villages to prepare for an increased
risk of flooding during the spring breakup. At the same the Coronavirus has made surveys from
aircraft more difficult. This has put more reliance than ever on Direct Broadcast satellite
products to monitor flooding along major rivers. The following information has been derived by
the Geographic Information Network of Alaska (GINA, http://www.gina.alaska.edu/), which
received direct broadcast satellite data in real time and processes satellite products to monitor
11
Alaska Climate Research Centerriver ice breakup for flood monitoring. Two specialized satellite products have been developed to
help monitor river flooding and ice concentration.
Figure 8: River Flood Areal Extent product (left) and River Ice Concentration product (right).
Left: The yellow, orange, red colors indicate the percentage of water in inundated areas. Blue
designates liquid water within normal river and lake banks. Magenta refers to river/lake ice,
white indicates supra snow/ice, and cyan indicates snow (left image product developed at George
Mason University). Right: Colors from blue -> green -> yellow -> orange -> red represent
increasing concentrations of detected ice in the rivers. White indicates snow (product developed
by Community College of New York).
The image on the left above (Figure 8) is an example of the River Flood Areal Extent product.
The above product indicates some flooding on portions of the Kantishna River where it joins the
Tanana River.
Figure 8-right is an example of the River Ice Concentration. Here the This product is for the
same satellite pass as the image on the left and it shows some ice near the confluence of the
Kantishna and Tanana Rivers which could be a factor in some of the elevated water levels.
On April 30, 2020, a Flood Warning caused by Ice Jams was issued by NWS River Forecast
Center for the Kuskokwim River from Napaimute to Kalskag that included Aniak. The image
shows the River Flood product for a portion of the Kuskokwim River at that time. Repeated
observations from satellite aid to assess rapid changes in river ice causing flood conditions.
12
Alaska Climate Research CenterFigure 9: River Flood product for a portion of the Kuskokwim River on April 30, 2020.
Arctic Sea Ice
Over the weeks of March 26th to April 9th, sea ice decreased by 4.23% to 13.826 M km2. During
the weeks of April 9th to April 23rd, sea ice decreased by 2.01%, about half the decrease rate of
the previous two-week period, to 13.548 M km2. Sea ice extent decreased by 6.16% from March
26th to April 23rd. The sea ice extent (light blue line in figure 10) is about even with the 2016
level (red line). As of May 2nd, 2020, sea ice extent is extremely low in the Bering Sea (Figure
11).
13
Alaska Climate Research CenterFigure 10: Time series of daily Arctic sea ice extent. This year’s data (light blue) are updated until
April 23, 2020. The median sea ice extent for the 1981-2010 reference period is depicted in blue.
Specific years are highlighted in colors. Plot Compiled by: Howard J. Diamond, PhD; Climate
Science Program Manager at NOAA's Air Resources Laboratory Data Source: National Snow &
Ice Data Center (NSIDC; https://nsidc.org/).
14
Alaska Climate Research CenterFigure 11: Daily Arctic Sea Ice concentration for May 2, 2020. Median ice edge for the 1981-2010
reference period is depicted in yellow. Image: NSIDC (nsidc.org)
Newsworthy information
The Nenana Ice Classic ended at 12:56 PM AST on Monday, April 27th according to
www.nenanaiceclassic.com. The classic is an Alaska tradition, which started in 1917 when
railroad engineers bet $800 to guess when the ice on the river would break up
(https://nsidc.org/data/NSIDC-0064/versions/1). Last year was the earliest break up date, April
14th. The latest ice breakups on record were on May 20 in both 1964 and 2013
(https://www.ktuu.com/content/news/The-tripod-has-fallen-on-the-Tanana-River-
569968521.html).
Rapid snow melt and river breakups caused flooding in low-lying areas across the Interior. The
Taylor Highway was closed after an overflowing river washed out a section of the road at Mile
54 on April 22nd. An ice jam in the Chena River resulted in a 2-feet rise in water levels in
downtown Fairbanks and minor river overflows along the Chena Hot Springs Road, the Dalton
Highway, the Elliott Highway, and the Taylor Highway on April 23rd.
(http://www.newsminer.com/news/local_news/river-breakups-cause-minor-flooding-across-
interior-alaska/article_a098253c-85cb-11ea-847a-53cf445ed743.html).
A wildfire at Point MacKenzie is thought to have been human caused. The Trumpeter fire was
130 acres as of May 1st and was estimated to be 75% contained. Firefighters responded to a
15
Alaska Climate Research Centersmall one-acre debris burn grass fire earlier in the week. Officials say the occurrence of two
burns within the same week is an indication that the valley is extremely dry.
(https://www.ktuu.com/content/news/Firefighting-crews-working-on-wildfire-off-KGB-Rd--
570065221.html)
A record-breaking Arctic ozone hole has closed. The Earth’s ozone layer acts as protection
between the sun’s harmful UV radiation and the Earth’s surface. The ozone hole opened up in
March before becoming the largest stratospheric ozone hole observed over the Arctic. The hole
was driven by an unusually strong and long-lived polar vortex. Earlier in April, scientists from
the European Space Agency said that the hole covered an area about three times the size of
Greenland. The hole disappeared as temperatures increased, breaking down the Arctic polar
vortex and allowing ozone-depleted air to mix with ozone-rich air from lower latitudes.
Copernicus Atmosphere Monitoring Service announced the closure on April 23rd. Paul Newman,
chief scientist for Earth Sciences at NASA’s Goddard Space Flight Center said that if people
hadn’t stopped putting chlorofluorocarbons into the atmosphere because of the Montreal
Protocol, the ozone hole would have been much worse. (https://www.cbsnews.com/news/arctic-
ozone-hole-largest-closed/)
This information consists of climatological data compiled by the Alaska Climate Research Center,
Geophysical Institute, University of Alaska Fairbanks. For more information on weather and
climatology, visit the center website at http://akclimate.org. Please report any errors
to webmaster@akclimate.org. River ice information has been received from GINA, the Geographic
Information Network of Alaska, Geophysical Institute, University of Alaska Fairbanks.
16
Alaska Climate Research CenterAppendix
Table A1: April 2020 daily records of mean daily temperature, i.e. highest/lowest values of mean
daily temperature ever recorded on specific days. Records are computed since the beginning of the
respective time series. Only highest records were set this month.
Highest Mean Daily Temperature on record
Station Date New Record (°F) Year of old record Old record (°F)
Bethel 2020-04-16 40.0 1988 39.0
Bethel 2020-04-18 42.5 1999 42.0
Cold Bay 2020-04-04 46.5 2019 43.0
Cold Bay 2020-04-21 44.0 1979 43.0
Gulkana 2020-04-18 43.5 1953 42.0
Gulkana 2020-04-20 43.0 2005 42.5
Homer 2020-04-16 44.0 2016 43.5
Homer 2020-04-19 47.5 2014 46.5
King Salmon 2020-04-14 48.5 2016 43.5
King Salmon 2020-04-16 50.5 1940 42.0
King Salmon 2020-04-17 53.0 1998 44.0
King Salmon 2020-04-18 48.0 1993 45.0
King Salmon 2020-04-20 48.0 2016 46.0
Kodiak 2020-04-04 47.5 1948 45.5
St. Paul Island 2020-04-03 39.0 1979 38.5
St. Paul Island 2020-04-25 42.0 2016 41.0
17
Alaska Climate Research CenterTable A2: April 2020 daily records of minimum daily temperature, i.e. highest/lowest values of
minimum daily temperature ever recorded on specific days. Records are computed since the
beginning of the respective time series. One lowest record and multiple highest records were set
this month.
Highest Minimum Daily Temperature on record
Station Date New Record (°F) Year of old record Old record (°F)
Anchorage 2020-04-15 36.0 1970 35.0
Bethel 2020-04-17 38.0 1936 36.0
Bethel 2020-04-18 38.0 1999 35.0
Bettles 2020-04-15 34.0 1978 33.0
Bettles 2020-04-18 35.0 1998 34.0
Cold Bay 2020-04-17 41.0 1965 36.0
Gulkana 2020-04-20 37.0 2005 36.0
Homer 2020-04-19 41.0 1990 40.0
King Salmon 2020-04-14 40.0 1951 37.0
King Salmon 2020-04-15 41.0 1951 38.0
King Salmon 2020-04-16 40.0 1988 37.0
King Salmon 2020-04-17 45.0 1945 38.0
King Salmon 2020-04-19 39.0 2016 38.0
King Salmon 2020-04-20 40.0 2001 39.0
Kodiak 2020-04-14 41.0 1979 40.0
Kotzebue 2020-04-17 33.0 1951 32.0
Kotzebue 2020-04-18 32.0 1988 31.0
Nome 2020-04-17 34.0 1912 32.0
St. Paul Island 2020-04-03 37.0 1967 36.0
St. Paul Island 2020-04-20 35.0 1951 34.0
Talkeetna 2020-04-15 36.0 1996 35.0
Talkeetna 2020-04-20 36.0 1928 35.0
Lowest Minimum Daily Temperature on record
Station Date New Record (°F) Year of old record Old record (°F)
Utqiaġvik 2020-04-29 -20.0 1968 -19.0
18
Alaska Climate Research CenterTable A3: April 2020 daily records of maximum daily temperature, i.e. highest/lowest values of
maximum daily temperature ever recorded on specific days. Records are computed since the
beginning of the respective time series. Only highest records were set this month.
Highest Maximum Daily Temperature on record
Station Date New Record (°F) Year of old record Old record (°F)
Cold Bay 2020-04-04 57.0 2019 49.0
Cold Bay 2020-04-19 49.0 1979 47.0
Cold Bay 2020-04-20 51.0 1981 49.0
Cold Bay 2020-04-22 51.0 1964 49.0
Gulkana 2020-04-18 60.0 1953 55.0
Juneau 2020-04-18 61.0 1953 59.0
King Salmon 2020-04-16 61.0 2016 57.0
King Salmon 2020-04-17 61.0 1965 55.0
King Salmon 2020-04-18 59.0 1930 57.0
Kodiak 2020-04-04 58.0 1948 53.0
St. Paul Island 2020-04-14 42.0 1978 41.0
St. Paul Island 2020-04-25 49.0 2016 46.0
19
Alaska Climate Research CenterYou can also read