GST Ground surface temperature - Guide lines for monitoring
←
→
Page content transcription
If your browser does not render page correctly, please read the page content below
Guide lines for monitoring

                                                 GST
                           Ground surface temperature

Definition

Ground Surface Temperature (GST) is defined as the surface or near-surface temperature of the
ground (bedrock or surficial deposit), measured in the uppermost centimeters of the ground.

GST has to be distinguished from the Bottom Temperature of Snow cover (BTS), which is measured at
the snow/ground interface.

GST is not a measure of permafrost in the strict sense, and corresponds to the temperature at the
top of the active layer. However, it is an important parameter for the understanding of the thermal
evolution of both active layer and permafrost, or of frozen ground in general.

Relevant parameters

Thermal regime

The monitoring of GST is not focused on absolute temperature values, but on the seasonal evolution
of ground temperature, known as the thermal regime of the ground (Ishikawa, 2003; Delaloye,
2004). The typical thermal regime of a soil in a permafrost area can be decomposed in four phases
(fig. 1) :
     1. During the snow free phase, from late spring to autumn, the GST is strongly linked to air
           temperature variations, and shows diurnal cycles.
     2. In late automn and early winter, GST will cool down as air temperature becomes negative, as
           long as there is no snow or only a thin snow cover, and may even experience an overcooling
           due to the high albedo of snow and the emission of long wave radiation through a very
           shallow snow cover.
     3. When the snow cover thickens and provides a partial isolation, GST will show attenuated
           variations (typically series of cold/warm days).
     4. In winter, when the snow cover reaches a sufficient depth for a complete isolation from
           atmospheric vairations, the GST will stabilize and progressively reach an equilibrium value
           depending on the heat flux coming up from the subsurface, called Winter Equilibrium
           Temperature (WEqT).
     5. During snow melt, the snow cover will first loose its isolation capacities by both the
           compaction of the snow and the increase of its water content, leading to a progressive
           warming of the GST. When melt water percolates to the ground surface, the GST will enter a
           phase at 0 °C, lasting until complete snow melt, and called zero curtain.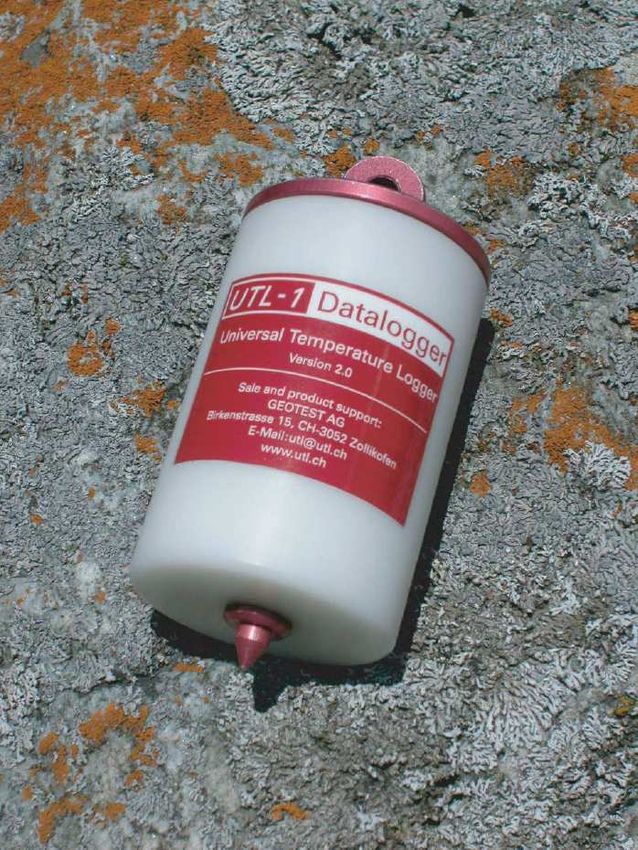
PermaNET – Guide lines for monitoring

Fig. 1 – Typical thermal regime of GST in a permafrost area.

This sequence can show significant variations, i) from year to year, depending on the history of the
snow cover, and ii) from one location to another, depending mainly on parameters controlling snow
accumulation such as microtopography and wind.

The analysis of the thermal regime gives valuable informations about cooling/warming episodes of
the ground, and on the relative contribution of air temperature and snow cover to the evolution of
GST.

Mean annual ground surface temperature

The Mean Annual Ground Surface Temperature (MAGST) is a usual parameter for the caracterization
of ground surface temperature conditions on a given location. It is dependent on the mean air
temperature, but also on site specific parameters such as direct radiation balance, duration and
height of snow cover and surface caracteristics of the ground, especially its colour/albedo and
thermal conductivity.

The MAGST can be used as a unique average value, that can be compared to the MAAT. In active
permafrost areas, MAGST should theoretically be negative, but can be close to or above zero in
permafrost boundary conditions, or where there is a high thermal gradient in the active layer.

Where pluriannual monitoring data are available, it has become usual to express the MAGST as a
running 12 month average (fig. 2). This kind of data shows the « thermal memory » of the ground,
that is the heat accumulated during the previous 12 months. It allows to identify periods of
cooling/warming of the ground surface.
Ground Surface Temperature

Fig. 2 – Running 12 month average of MAGST (from Permos 2009). The data points correspond to the
average of the 12 previous months (and not to centered values). This kind of representation expresses
best the accumulated heat during the previous 12 months period. The cumulated effect of the hot
summer 2003 and the snow rich winter 2003-2004 is clearly visible, as well as that of the cold and
snow poor winters 2004-2005 and 2005-2006.

Winter equilibrium temperature

The most relevant parameter for the interpretation regarding permafrost and climate influence is the
Winter Equilibrium Temperature (WEqT). The WEqT will depend i) on the presence/absence of
permafrost, and ii) on the history of the snow pack on the measurement location.

In presence of permafrost, the negative heat flux coming up from the cold frozen subsurface will lead
to strongly negative WEqT (typically less than -2 °C), whereas on non frozen soil, the WEqT will be
close to 0 °C or moderately negative (Haeberli 1973, 1985). Thus the WEqT can be a good indicator of
permafrost occurrence and can help to discriminate permafrost from non-permafrost areas,
provided that the snow cover developped early in the winter and remained sufficient to isolate the
soil surface from atmospheric influence.

Classically, the following typical threshold values of WEqT were used as indicators :
    - GST > 2 °C : permafrost unlikely.
    - GST 2-3 °C : permafrost possible, uncertainty range.
    - GST < 3 °C : permafrost probable.

However, the WEqT is strongly influenced by the snow height and duration. It is usually admitted
that a snow depth of 80 to 100 cm is necessary to provide a sufficient isolation against air
temperature variations. Thus WEqT is not reached every year, neither at every location. In addition,
the snow cover must be established since the beginning of the winter. If a sufficient snow cover is
lacking, especially during the cold days of November-December, the soil will cool down drastically,
leading to deep seasonal frost, and very negative values of WEqT can be measured even in non-
permafrost areas.

As a result, WEqT at a given location may vary by 2-3 °C from one winter to the other, depending on
snow cover history. Thus the threshold values have been abandonned, and the discrimination of
permafrost/non-permafrsot areas relies on the contrasts of WEqT, usually well marked if WEqT is
reached.

More generally, the evolution of WEqT from year to year is a valuable parameter of the thermal
regime, and therefore for the heat transfer from the atmosphere to the permafrost.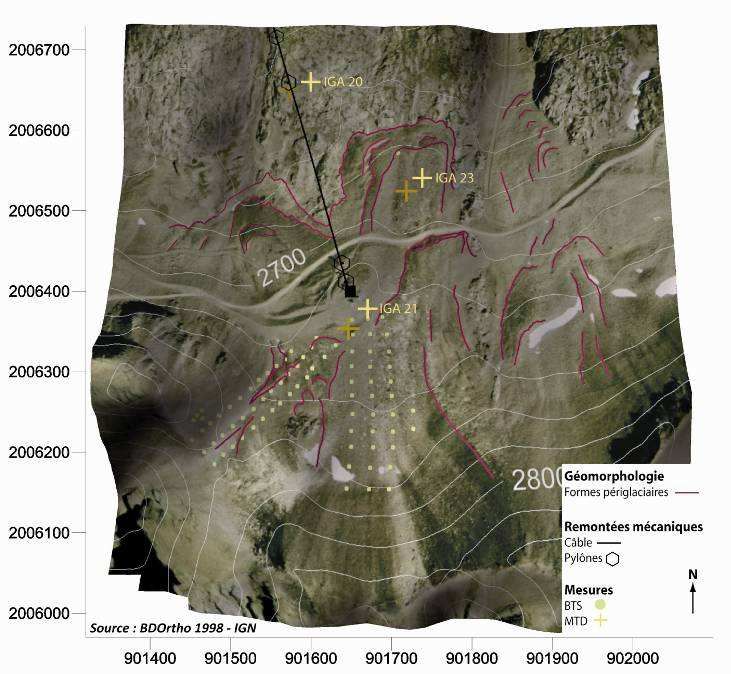
PermaNET – Guide lines for monitoring

Ground freezing index

The Ground Freezing Index (GFI) is defined as the annual sum of negative daily mean temperatures,
expressed as cumulated negative degree-days (°C.day). It is a measure of the cooling of the ground
during the cold season. The annual GFI values allow comparison between the winters (fig. 3), and can
provide a quantified input for modelling.

Fig. 3 – Ground Freezing Index (GFI) from 1995 to 2006 on monitored sites (from Permos 2009).

An alternative parameter is the sum of the temperature difference between daily mean air
temperature and GST, expressed as cumulative degree-days (°C.day). It expresses the degree of
decoupling between air and ground surface temperatures, and highlights the effect of the snow
cover (fig. 4). This can be an overcooling effect for a shallow snow cover resulting in a positive offset
(air warmer than ground), or an isolation effect for a thick snow cover, resulting in a negative offset
(air colder than ground).

Fig. 4 – Cumulated difference between daily mean air temperature and GST during winter months,
compared to air temperature (from Bodin 2007). Positive trends indicate that air is warmer than
ground, negative trends that air is colder than ground.

Zero curtain and snow melt

The onset date, duration and end of the zero curtain can also be interpreted in terms of snow melt.
The date of snow melt is an important parameter, controlling the date from which the ground is
submitted to direct solar radiation and sensible heat flux.
Ground Surface Temperature
Measurement techniques
GST can be measured by a temperature probe connected to a multichannel logger. This method will
be used where a multichannel logger is installed for other purposes, e.g. when GST is measured at
the location of a automated weather station, in the surroundings of a borehole equipped for
temperature profile measurement, or if ground temperatures are monitored at various depths for
active layer or seasonal frost depth monitoring.
As GST is usually monitored at distant points dispersed over an area, the most frequently used
technique are autonomous miniature temperature data loggers (MTD’s). These devices contain in a
single compact, waterproof container the temperature probe, the driving electronics, the data
memory and a battery. They can be programmed for the chosen sampling interval and buried in the
field. After complete snow melt, they can be exhumed, the data downloaded and the MTD reset for
the next season.
As temperature amplitudes are usually high, and because the focus is not so much on absolute
temperatures but rather on its evolution through the season, the measurment accuracy is not
crucial : a resolution of 0.1 to even 0.5 °C is sufficient. An extra calibration is not necessary, as in
most cases the « zero curtain » during snow melt allows a perfect calibration to 0 °C.
Most usual MTD are the following (fig. 5 and 6, for details see attachments):
- UTL-1, produced and distributed by Geotest AG (Switzerland – www.utl.ch) : resolution of
0.27 °C, accuracy ±0.1 °C. The memory limitation to 7944 values allows a sampling interval of
2 hours for a measurment duration of over a year, or 1 hour for a duration of about 11
months. The battery has to be changed every year. These loggers are in use since more than
10 years and have proved to be totally reliable. No longer available.
- UTL-2, same as UTL-1, but with the probe on a 60 to 180 cm long cable connected to the box.
No longer available.
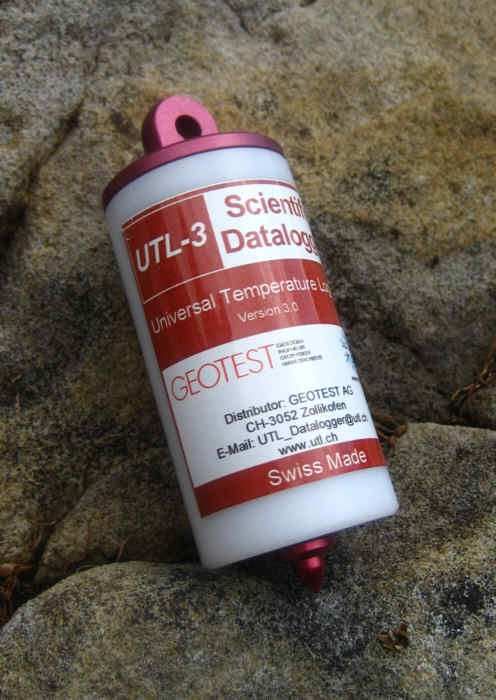
- UTL-3, produced and distributed by Geotest (www.utl.ch): resolution of 0.02 °C, accuracy <
0.1 °C. The extended memory capacity allows more than five years of measurement at 1 hour
interval, or much closer intervals in places where needed (e.g. convection phenomena, …).
The battery has a duration of theoretically 5 years. This new device allows monitoring at
places visited only every few years. This new model is used since only one year, so that
operating capacities in real conditions have still to be tested. Price : ca 350 €/piece.
Fig. 5 – Miniature temperature data loggers (MTD) currently used for ground surface temperature
measurements. From left to right : UTL-1, UTL-2, UTL-3.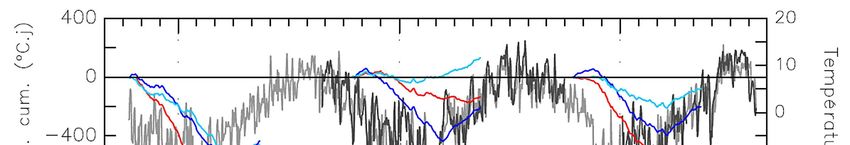
PermaNET – Guide lines for monitoring
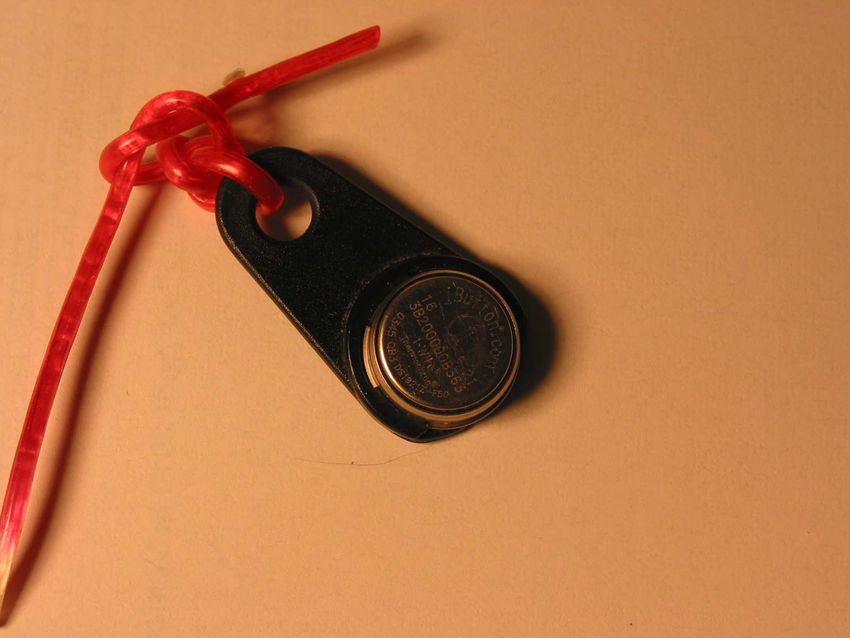
- I-buttons, produced and distributed by Dallas (USA – www.i-button.com) : resolution of
either 0.065 or 0.5 °C, accuracy of ±0.5 °C. The memory capacity allows 8192 records at 0.5
°C resolution (= more than a year at 2 hour interval), or 4096 records at 0.065 °C resolution.
The memory can be downloaded and reset. The battery has a duration of up to 5 years,
depending on sampling interval, but the device has to be dashed when battery is over. I-
buttons can show a significant offset compared to more accurate loggers, but as they can be
calibrated with the zero curtain, it doesn’t matter, as the relative accuracy is good. There are
various models, the suitable one for frozen ground studies is the DS1922L. Price : ca 30-40
€/piece.
Fig. 6 – i-button MTD, with plastic holder (right).
- Hobo data loggers with 4 sensors have also been used by some researchers. The advantage
of this type of logger is that one can link 4 sensors to a single autonomous logger, with cable
lengths of up to … m. This permits for instance to measure temperature profiles at 4 depths,
or to distribute sensors on surroundings in order to investigate the influenc of topography.
However, experiences show that the device is not reliable in harsh environment, resulting in
discontinuous datasets. Price :
Measurement strategies
GST is usually not measured on the ground surface, but in the near sub-surface, at depths of one to a
few centimeters, in order to avoid direct radiation influences. There is no standardized depth for GST
measurement. In addition, it must be pointed to the fact that, i) the measurement depth can not be
set very accurately with MTD’s, ii) the exact level of the ground surface can not be determined in
coarse blocky material. We suggest a standard depth of around 5 (or 10 ?) cm below the closed
soil/stone cover (i.e. not considering outrising blocks), allowing a complete burial of the MTD in order
to protect it from undesirable removal. In blocky material, the MTD or the probe should be placed
whenever possible in fine material patches, in order to avoid ventilation effects.
Due to the spatial and temporal variability of GST, a measurement at a single point has low
signification. Therefore, GST should be monitored on a set of points distributed over the investigated
area. A set of 3 to 4 MTD’s is a minimum and has proved to be a good compromise between cost and
representativity. In contrasted topography, the number must be increased accordingly.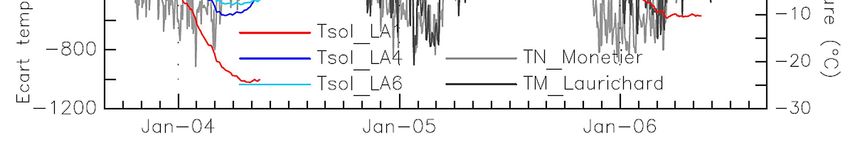
Ground Surface Temperature
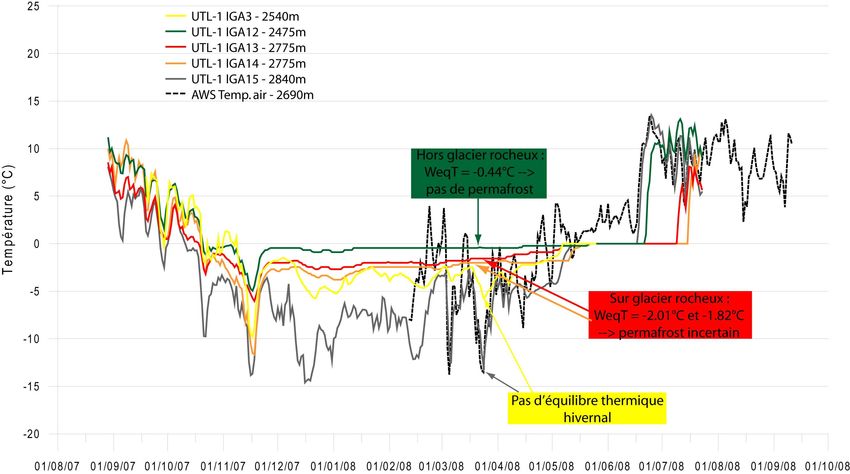
Fig. 7 – Typical thermal regimes recorded on and around a rockglacier. Logger 12 lies outside the
rockglacier, the WEqT of -0.44 °C indicates the absence of permafrost. Loggers 13 and 14, with a
WEqT around -2 °C, lie on the rockglacier. The contrast of 1.5 °C with logger 12 allows to consider the
presence of permafrost as probable. Logger 11 and 15 have been insufficiently covered by snow and
didn’t reach a WEqT, and are therefore not interpretable.
On a rock glacier, the MTD’s will be best distributed as follows (fig. 7 and 8) :
- Three MTD’s on the rock glacier surface, placed on the root zone, the center and the frontal
lobe respectively.
- One MTD outside of the rock glacier, best below the front, in order to assess the contrast
between permafrost/non-permafrost areas. This can be done also at the location of the
weather station if there is any.
Fig. 8 – Distribution of a set of MTD’s on
a rock glacier. MTD IGA 21 and 23 are
on the rock glacier, MTD IGA 20 is
outside of the rock glacier, in an area
not affected by permafrost.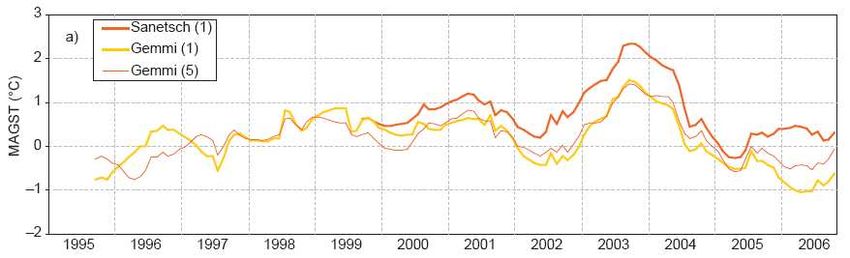
PermaNET – Guide lines for monitoring

On a cold scree slope, MTD’s should be placed at least :
   - In the lower part of the scree, at the expected cold air summer vents.
   - In the upper part of the scree, at the expected warm air winter vents.
   - Additional points in the middle part.

The use of UTL type loggers is recommended. It is not recommended to rely on i-buttons for strategic
measurements. But due to their low cost (about 10 times cheaper than UTL), i-buttons can represent
a good means to extend the network to additional points. A combination of 3 UTL and a set of i-
buttons could be a good solution.

References :

Bodin X. (2007) – Géodynamique du pergélisol de montagne : fonctionnement, distribution et
         évolution récente. L'exemple du massif du Combeynot (Hautes Alpes). Thèse, Département de
         géographie, Université de Paris-Diderot, Paris 7.
Delaloye R. (2004) – Contribution à l'étude du pergélisol de montagne en zone marginale. GeoFocus,
         vol 10, Université de Fribourg. 240 p.
Haeberli W. (1973) – Die Basis-Temperatur der winterlichen Schneedecke als möglicher Indikator für
         die Verbreitung von Permafrost in den Alpen. Zeitschrift für Gletscherkunde und
         Glazialgeologie, 9, p. 221-227.
--- (1985) – Creep of mountain permafrost : internal structure and flow of alpine rock glaciers. Zürich,
         Mitt. VAW/ETHZ, Vol. 77, 142 p.
Ishikawa M. (2003) – Thermal regimes at the snow-ground interface and their implications for
         permafrost investigation. Geomorphology, 52, p. 105-120.
PERMOS (2009). Permafrost in Switzerland 2004/2005 and 2005/2006. Noetzli, J., Naegeli, B., and
         VonderMuehll, D. (eds.), Glaciological Report Permafrost No. 6/7 of the Cryospheric
         Commission of the Swiss Academy of Sciences.

Version 3 – 2.2.2011 – P. Schoeneich
You can also read