A wear study on plasma transferred arc hardfaced structural steel with titanium carbide
←
→
Page content transcription
If your browser does not render page correctly, please read the page content below
ISSN 1 746-7233, England, UK
                                                                        World Journal of Modelling and Simulation
                                                                                  Vol. 10 (2014) No. 2, pp. 108-115

       A wear study on plasma transferred arc hardfaced structural steel with
                                 titanium carbide

                                               S. Balamurugan∗ , N. Murugan
    Department of Mechanical Engineering, Coimbatore Institute of Technology, Coimbatore 641014, TamilNadu, India
                                     (Received August 1 2013, Accepted March 24 2014)

       Abstract. In the present study, plasma transferred arc hardfacing (PTA) technique was employed to deposit
       wear-resistant titanium carbide (TiC) on IS: 2062 structural steel. The wear test was conducted in a pin on
       roller wear testing machine of different experimental conditions by PTA hardfacing process. An attempt was
       made to design of experiments based on the factorial technique to obtain the required information about the
       direct and interaction effects of the input parameters on the response. The experiments based on the central
       composite folded design matrix of three factors three level factorial techniques. The mathematical model
       employed to predict the wear rate and wear track obtained from the microscope. It is found that the wear
       resistance of the PTA hardfaced surface is better than that of the substrate.
       Keywords: PTA hardfacing, DOE, wear rate and wear track

1     Introduction

      Wear related failure of mechanical components is considerable as one of the major reasons for ineffi-
ciency of a variety of engineering applications. It was reported that wear resistance could be improved when
hard particles were embedded in a tough, metallic matrix[2, 6] . Hardfacing is a technique used to improve
the surface properties of metallic mechanical parts, such as the resistance against wear and correction. Sur-
face properties and quality depend upon the selected alloys and deposition processes[1, 3] . Depending on the
applied technique, common problems encountered in hardfacing are combination of a poor bonding of the ap-
plied surface layer to the base material, the occurrence of porosity of the thermal distortion of the workspiece,
the mixing of the layer with the base material and the inability of a very local treatment[8] . According to the
literature, coatings obtained by PTA present a very good alternative to other hardfacing processes, such as
conventional techniques or more recent ones like laser cladding[4, 5] . A significant advantage of PTA surfacing
over traditional surface welding processes arises from the fact that the consumable material used is in the
powder form. This fact enables a wide range of composition for the coating materials and even mixtures of
different material powders. Wear rate experiments are conducted using DOE which deals with the procedure
of selecting number of trials and conditions for running those[7] . In this paper, details about the development
of mathematical models for predicting the direct and interaction effects of process parameter variables for TiC
hardfacing wear rate and wear track from the experimental data obtained.

2     Experimental procedure

     Materials: In the present study, TiC has been deposited on IS: 2063 structural steel using PTA technique.
TiC is a very hard refractory material finding increasing usage for wear-resistant applications such as bearings,
nozzles, cutting tools, and jet engine blades. It has relatively low electrical resistivity and can be used as a
 ∗
     corresponding author E-mail address: balu74 cit@yahoo.co.in.

 Published by World Academic Press, World Academic Union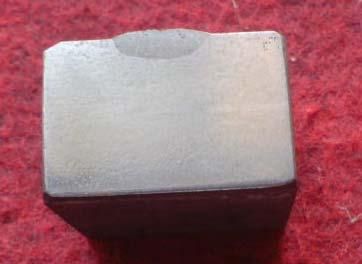
World Journal of Modelling and Simulation, Vol. 10 (2014) No. 2, pp. 108-115 109
conductor for electricity, especially at elevated temperatures. Thus, TiC is a suitable choice for deposit on a
structural steel. The substrate material selected for the PTA hardfacing method was IS: 2062 structural steel.
It is shown in the Tab. 1.
Table 1. Chemical composition of base metal and hardfacing alloy
Elements, Weight %
Sl.No Material Used
C Si Mn S P Mg Ti Fe
1 IS:2062 (Base Metal) 0.18 0.18 0.98 0.016 0.016 - - bal
2 Titanium Carbide (TiC)(PTA Powder) 17.6 0.03 0.03 - - 0.09 81.9 0.12
Table 2. PTA hardfacing experimental conditions
Parameters
Sl.No % Dilution Heat Input, kJ/mm
I S F H T
1 160 140 16 10 290 36.11 15.14 Low Heat Input(LHI)
2 205 130 14 9 260 34.49 18.85 Medium Heat Input(MHI)
3 190 120 16 10 290 29.81 20.98 High Heat Input(HHI)
Hardfacing Process: Using PTA hardfacing system, Titanium Carbide (TiC) was deposited onto the struc-
tural steel plate by hardfacing technique. The system had five modules to facilitate the process effectively, viz.
the transverse carriage unit, oscillator unit, powder feeder unit, water cooling unit and the torch unit. The
independently controllable process parameters are identified based on their significant effect on weld bead
geometry were Welding Current (I), Welding Speed (S), Powder feed rate (F), Oscillation Width (H), Pre heat
temperature (T).The working ranges of all selected parameters were fixed by conducting trial runs. It is shown
in the Tab 2. This was carried out by varying one of the parameters while keeping the rest of them at con-
stant values. The design matrix chosen to conduct the experiment was a central composite rotatable design.
Titanium Carbide (TiC) was deposited over structural steel plates of size 150 mm X 100 mm X 25 mm. The
deposited plates were covered immediately with vermiculite powder to ensure slow cooling to avoid cracking
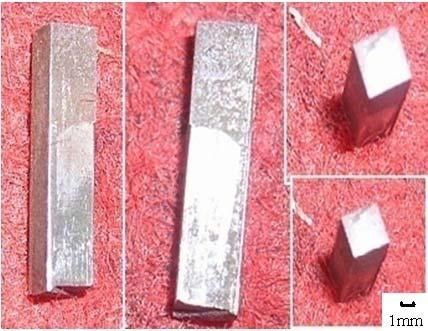
in the hardfacing. The hardfaced plates were cross sectioned at their midpoints to get the test samples. PTA
hardfaced surfaces and a typical cross section are shown in Fig. 1 and Fig. 2.
ÿÿÿÿ
Fig. 1. Photograph of hardfaced plate
Sliding Wear test: The pin-on-disc wear testing apparatus is used for conducting wear tests, under varying
sliding speed and samples were 25 mm length and 3 mm X 3 mm in size is shown in Fig. 3. The surface of
the pin sample and the steel disc were ground using emery paper (grit size 240) prior to each test. A set of
WJMS email for subscription: info@wjms.org.uk110 S. Balamurugan & N. Murugan: A wear study on plasma transferred
ÿ
Fig. 2. Typical cross section of hardfaced plate
pins of low, medium and high heat input was subjected to running in wear for an applied load and sliding
velocity as per design of experiments. In order to ensure effective contact, during sliding, the load is applied
on the specimen through cantilever mechanism and the specimens brought in intimate contact with the rotating
disc at a track radius of 90 mm. The test was integrated with WINDUCOM software and the wear loss was
recorded. The initial weight of the specimen was measured in a single pan electronic weighing machine with
an accuracy of 0.001 g. After the test, the specimen was removed, cleaned with acetone and weighted prior to
and after each test to determine the weight loss. The difference I weight gives the wear loss of the specimen.
The wear rate was calculated from the weight loss measurement and expressed in terms of volume loss per
unit sliding distance as given below.
Wear Volume, m3 = Weight loss / density
Wear rate, m3 /m= Wear Volume / Sliding distance
Tab. 3 and 4 shows that the wear control parameters and design of matrix observed values of wear rate.
The wear tracks of the specimens were obtained on Optical microscope and are presented in the results.
ÿ
Fig. 3. Pin Samples for wear test
Mathematical Models: The experiments were based on the central composite folded design matrix of
three-factor, three level factorial techniques, it shown in Tab. 3. The selected design matrix, shown in Tab. 4.It
consists of 15 sets of coded conditions comprising of 6 factorial points, 6 star points and 3 central points. All
input variables at the intermediate level (0) constitute the central points, and the combinations of each of the
variables at its lowest level (−1) or highest level (+1) constitute the star points. Thus, the 15 experimental
runs allowed the estimation of the linear, quadratic and two-way interactive effects of the input variables.
The response function representing any of the weld bead dimensions like penetration, reinforcement,
width and dilution etc can be expressed as Y = f (L, V, Q) Where, Y is the response. The second order
WJMS email for contribution: submit@wjms.org.ukWorld Journal of Modelling and Simulation, Vol. 10 (2014) No. 2, pp. 108-115 111
Table 3. Wear control parameters and their levels
Levels
Parameters Notations
−1 0 +1
Normal Load, kg L 3 5 7
Sliding Velocity, m/s V 2 3 4
Heat Input, kJ/mm Q 15.14 (LHI) 18.84 (MHI) 20.98 (HHI)
Table 4. Design matrix and observed vales of wear studies
S.No Normal Load(L) Sliding Velocity (V) Heat Input (Q) Wear rate X 1008 , m3 /m
1 0 −1 −1 1.17
2 −1 0 −1 1.07
3 0 −1 1 1.45
4 1 0 1 1.58
5 0 0 0 1.03
6 0 1 −1 1.11
7 −1 −1 0 1.09
8 0 1 1 1.13
9 −1 1 0 1.07
10 0 0 0 1.05
11 1 −1 0 1.07
12 −1 0 1 1.04
13 1 0 −1 1.41
14 1 1 0 1.10
15 0 0 0 1.09
polynomial (regression) used to represent the response surface for k factors is given by
k
X k
X k
X
y = b0 + bi xi + bii x2i + bij xi xj , (1)
i=1 i=1 i,j=1,j,i
where, b0 is the free term of the regression equation, the coefficients b1 , b2 , · · · bk are linear terms, the
coefficients b11 , b22 , · · · bkk are quadratic terms and coefficients b12 , b13 , · · · bk−1 , k are the interaction terms.
For five factors, the selected polynomial could be expressed as
Y = b0 + b1 L + b2 V + b3 Q + b11 L2 + b22 V 2 + b33 Q2 + b12 LS + b13 LQ + b23 V Q. (2)
The values of the coefficient of the above polynomial were calculated by regression analysis with the
help of the technique was employed to determine significant coefficients. The final mathematical model was
constructed using the significant coefficients. The final mathematical models determined by the regression
analysis are as follows
Wear =1.057 + 0.111L − 0.046V − 0.055Q + 0.043L2
− 0.017V 2 − 0.175Q2 + 0.050LQ − 0.013V L + 0.065V Q. (3)
The significant coefficient for the reduced wear rate model was calculated. It was found that the reduced
mathematical model was better than the full model because of higher adjusted square multiple R and lower
standard error of estimate values compared to that of full model as shown in Tab. 5.
WJMS email for subscription: info@wjms.org.uk112 S. Balamurugan & N. Murugan: A wear study on plasma transferred
Table 5. Adjusted R2 and standard error of estimate values
Full model Reduced model
Sl.No Wear Parameter
2 2
Adjusted R Standard error of estimate Adjusted R Standard error of estimate
1 Wear rate 0.373 0.618 0.508 0.549
For the purpose of plotting graph and for further analysis of the results only reduced mathematical model
was considered. The final mathematical model reduced to predict the wear rate is given below:
Wear rate(W r) = 1.057 + 0.111L − 0.055Q + 0.043L2 − 0.017V 2 . (4)
3 Validation of the models
The adequacy of the model was then tested by the analysis of variance techiques (ANOVA) and the results
are given in Tab. 6. From the table, it is evident that the wear rate model is adequate.
Table 6. ANOVA for testing adequacy of models developed
Wear Parameter Regression Residual Lack of fit Errors of Terms
F-Ratio R2
S.S D.F S.S D.F S.S D.F S.S D.F
Wear rate 2.165 9 0.902 5 0.902 3 0 2 0.821 0.647
Validity of the model was tested by drawing scatter diagram, which shows that the degree of closeness to
450 line between observed and predicted values of wear rate indicating good fit of the development empirical
model. Scatter diagram for wear rate is shown in Fig. 4.
ÿ
Fig. 4. Scatter diagram for wear rate model
4 Result and discussion
From Fig. 5, it is found that the wear rate increase with the increase in normal load. It is evident from the
figures that wear rate increases with the increase in heat input. It may be important to explain the difference
in wear behavior of hardfacing produced under different heat input conditions. Wear rate is marginally higher
WJMS email for contribution: submit@wjms.org.ukWorld Journal of Modelling and Simulation, Vol. 10 (2014) No. 2, pp. 108-115 113
Fig. 5. Direct effect of wear parameters on wear rate
ÿ
at low heat input conditions which could be attributed to fracturing of surface due to more hardness and less
ductility resulting from low dilution.
It is from the wear track Fig. 6 to 8. Obtained from the microscope, the depth of abrasion scoring marks
is more on the wear surfaces at low heat input hardfacing than that of high heat input hardfacing, which could
be due to effect of low dilution for low heat input. It is also found that the wear rate increases with increase in
sliding velocity upto middle level and then wear rate decrease for further increasing in sliding velocity. It may
attributed to the fact that under influence of increasing sliding velocity.
Fig. 6. SEM photomicrograph of low heat input specimen
WJMS email for subscription: info@wjms.org.uk114 S. Balamurugan & N. Murugan: A wear study on plasma transferred
Fig. 7. SEM photomicrograph of medium heat input specimen
Fig. 8. SEM photomicrograph of high heat input specimen
5 Conclusion
Hardfaced surface produced under low heat input conditions are subjected to lower weight loss than high
heat input conditions.
SEM analysis revealed that the depth of scoring marks was observed more on the wear surfaces of high
heat input hardfaced that that of low heat input.
And also, from the analysis, it was confirmed that wear rate less at low load as compared to high load.
WJMS email for contribution: submit@wjms.org.ukWorld Journal of Modelling and Simulation, Vol. 10 (2014) No. 2, pp. 108-115 115
References
[1] E.Lugscheider, U.Morkramor, A. Ait-Makideche. Advances in pta surfacing, proceeding of the fourth national
thermal spray conference, pittsburgh, pa,usa. 1991.
[2] A. K. Jha, B. K. Prasad, et al. J.mater.eng. Perform, 1999, 8(2): 190–196.
[3] J.R.Davis, Associates. Hardfacing, weld cladding and dissimilar metal joining in; asm handbook - welding. in:
Brazing and Soldering, Vol.6, 10th Ed, ASM metals Park, OH, 1993, 699 – 823.
[4] D. Oliveira, A. Yaedu, et al. Influence of dilution on microstructure and mechanical properties of cobalt-based alloy
deposited by plasma transferred arc welding. International Conference on Advanced materials, their processes and
applications, materials week, 2002.
[5] A. .Surian, L. A. de vedia. Effect of welding procedure on wear behavior of a modified martenstic tool steel
hardfacing deposit. Materials & Design, Elsevier, 2011.
[6] U.Draugelats, B. Bouaifi, T. Plegge. Weld res. Abroad, 1996, 42(11): 39 –41.
[7] W.G.Cochran, G. Cox. Experimental design. Asia Publishing House, 1963.
[8] W. Whal, Stuttgart. Trends for hardfacing. www.engineers.org.il/ uploads/1683/drwhal0206.pdf.
WJMS email for subscription: info@wjms.org.ukYou can also read