REINJECTION OF CONSTRUCTION DEWATERING WATER AT THE UNIVERSITY OF CANTERBURY
←
→
Page content transcription
If your browser does not render page correctly, please read the page content below
REINJECTION OF CONSTRUCTION
DEWATERING WATER AT THE UNIVERSITY OF
CANTERBURY
H. Lough and A.Brough, Pattle Delamore Partners Ltd, Christchurch, New Zealand
R. Oudshoorn and P. Molony , University of Canterbury, Christchurch, New Zealand

ABSTRACT
The University of Canterbury is situated above a shallow semi-confined aquifer. Dewatering is required during
construction of the basements of multi-storey buildings. Previously, dewatered water has been discharged to
local waterways.

During the recent construction of the Biosciences building, concerns raised during the resource consent process
meant it was not practicable to discharge all dewatering water to the local Okeover Stream. Alternative options
evaluated included reinjecting the dewatering water to ground. The shallow aquifer is high yielding, which is a
challenge for site dewatering due to the high pumping rates required, but also means reinjection can occur
without raising groundwater levels excessively.

The results from testing of a trial bore indicated reinjection was feasible. Groundwater modelling was carried out
to estimate where additional reinjection bores could be placed to minimise the mounding and the impact on the
dewatering system.

Eight additional bores were drilled, tested and connected into a pipe network from the excavation site. The
reinjection was successfully completed over the 6 month dewatering period while maintaining groundwater levels
below ground level and minimising interference.

This paper discusses the investigations and the reinjection system, and illustrates the effectiveness of this
solution through groundwater level monitoring data collected during construction.

KEYWORDS
Site Dewatering, Reinjection Bore s, Aquifer Testing, Groundwater Modelling

1     INTRODUCTION
Dewatered groundwater from a construction site is usually discharged into a surface waterway or a stormwater
sewer.

Groundwater levels at the University of Canterbury’s Ilam campus are shallow, which means that for
construction of buildings which require basements, it is necessary to dewater the site to allow the basement, plus
sufficient building structure, to be completed so that the building does not uplift out of the ground due to the
groundwater pressure. Previously the University of Canterbury has used the option of discharging to one of the
local waterways.

The University began construction of a new building to accommodate the Biosciences Department in 2008. The
building included a basement and a lift shaft. The planned final floor elevation of the basement was 2.6 metres
below ground level (mbgl) and the construction process involved working to a depth of 3.2 mbgl for the
footings. Due to the shallow water table (between 0.9 and 2.2 mbgl), dewatering was required to reduce the water
table elevation by between 1 and 2.3 m. The construction of the lift shaft required depression of groundwater
levels to 5 mbgl for a period of around 48 hours.
The nearest surface waterways are the Okeover Stream and the Avon River. Both the Okeover and the Avon
receive inflows from surface runoff during rainfall, groundwater recharge when the groundwater pressure is
sufficiently high and discharges associated with activities at the University such as cooling water discharges.

The University applied for a consent to discharge all dewatering water into the Okeover at a rate of up to
300 L/s, based on preliminary estimates of the required dewatering rate.

During the processing of the application, some concerns were raised over the potential for the discharge to
increase water levels in the Okeover downstream of the University during high rainfall events, and to result in
flooding of neighbouring properties and increased risk of erosion. I t would not have been possible to stop
dewatering for several days during high flows in the Okeover, as inundation of the working area had the potential
to result in irreversible damage to the building. To address these concerns, consideration was given to other
discharge options. As a stormwater sewer was not available, the alternative of reinjecting the water into the
same shallow aquifer from which it was abstracted was explored. It was proposed that this could either
compliment the surface water discharge during high flows or be a stand alone method of discharge.

This paper describes the testing, analysis and subsequent assessments that were undertaken to determine the
feasibility of discharging the dewatering water into a number of injection bores located several hundred metres to
the south-east of the building site.

                New Biosciences Building

                                                                       Okeover Stream

                                                         Avon River

       Figure 1: Location of Biosciences building and surface waterways at the University of Canterbury
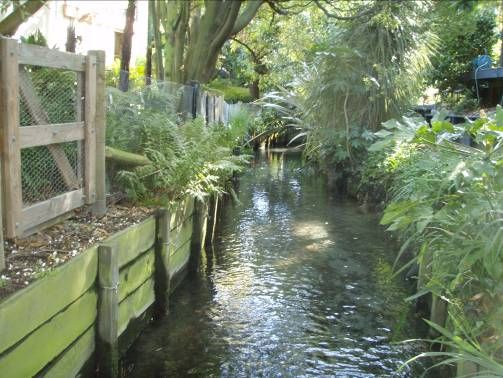
Photograph 1: Okeover Stream

2     HYDROGEOLOGY
The first stage in the investigation to confirm the feasibility of the reinjection involved reviewing bore logs in
the local area. This review indicated that a shallow aquifer exists beneath the site within a 5-10 m thick layer of
permeable gravels and sandy gravels. This layer is overlain by 2-4 m of fine grained sediments that provide a
low permeability cap over the shallow gravel aquifer. The bore logs also indicated the presence of low
permeability sediments at the base of the permeable gravel layer. These sediments are expected to separate the
shallow aquifer from the deeper aquifer, commonly referred to as Aquifer 1, that exists in the Riccarton Gravels.
The bore logs indicate that in places there may be permeable gravel deposits that lie between this shallow aquifer
and the deeper Riccarton gravels. The bore log information was used to define a target depth for a trial injection
bore of between 7-14 m deep.

3     GROUNDWATER INVESTIGATIONS AND ANALYSIS

3.1      STEP INJECTION TEST AND CONSTANT RATE INJECTION TEST
The trial injection bore was drilled to a depth of 13 mbgl, with a 6 m screen extending from 7 m to 13 mbgl.
T wo observation bores were installed at 5 m and 15 m from the injection bore. These bores are screened between
8 m and 10 mbgl.

The first test carried out on the injection bore was a step injection test, the purpose of which was to determine a
sustainable injection rate for the bore for a subsequent constant rate injection test. The step test involved
injecting water into the bore at successively increasing injection rates. It was anticipated that as the rate of
injection increased with each step, the water level in the bore would increase. However, an interesting
phenomenon was observed whereby the water level during the third and fourth steps actually dropped lower than
the static water level in the bore prior to testing.

Because of the unusual response, the step test could not be analysed with any standard analysis method.
However, the minimal change in water levels in the injection bore during the test did demonstrate that the
shallow aquifer is very permeable and suggested that it would be capable of receiving much higher rates of
injection, without creating any significant mounding effects. The step test indicated that a 48 hour constant rate
injection test could easily be carried out at an injection rate of 18 L/s.
Manual measurements of water levels in the two observation bores were also taken over the course of the step
test. The small increases in water levels (
Measured drawdown in pumped aquifer
                                        Calculated drawdown in pumped aquifer
                      0.30              Calculated recovery in pumped aquifer
                                        Calculated drawdown at water table
                                        Calculated recovery at water table
                      0.25
  Mounding (metres)

                      0.20

                      0.15

                      0.10

                      0.05

                      0.00
                        0.00001      0.0001         0.001          0.01          0.1           1                10
                                                              Time (days)

                      Figure 2: Measured and calculated drawdown in observation bore 5 m from injection bore

                                         Measured drawdown in pumped aquifer
                                         Calculated drawdown in pumped aquifer
                      0.30               Calculated recovery in pumped aquifer
                                         Calculated drawdown at water table
                                         Calculated recovery at water table
                      0.25
Mounding (metres)

                      0.20

                      0.15

                      0.10

                      0.05

                      0.00
                        0.00001      0.0001         0.001          0.01          0.1           1                10
                                                              Time (days)

                      Figure 3: Measured and calculated drawdown in observation bore 15 m from injection bore
4 GROUNDWATER MODELLING
Modelling was carried out to assess the potential changes in groundwater levels for scenarios where the water
abstracted from the dewatering area was reinjected into a number of bores. Iterative modelling was carried out to
determine the required number of, and ideal locations for, the bores subject to constraints such as existing
buildings and underground services.
It was important to carry out the modelling in a conservative manner as, if the reinjection system caused ground
levels to rise higher than expected or even to ground level, it could have resulted in surface flooding, flooding of
basements and damage to underground services and paved surfaces.
A number of different scenarios were modelled. Using the parameter set that resulted in the maximum predicted
water level changes provided a conservative prediction of the increase in water levels around the injection bores.
It was acknowledged that, while no interaction with surface waterways was observable over the 48 hour injection
test, some interaction could occur with longer reinjection. It is expected that groundwater emerges in the
Okeover Stream when groundwater levels are sufficiently high. However, by not accounting for any interaction,
the predicted changes in groundwater levels would be conservatively high.
The available depth for mounding to occur was set based on the highest water level recorded in a 6.5 m deep bore
with regular water level measurements available over a 5 year period, although it was recognised that there would
be localised differences in the depth to groundwater across the site.
The modelling was carried out using the Boulton (1973) solution and the principle of well superposition to
model reinjection into multiple bores.
Three scenarios were modelled with the set of parameters that predicted the maximum mounding. These were as
follows:
1. Long-term reinjection of the dewatered water into groundwater at 200 L/s for 6 months. This value of
200 L/s was chosen as it represented the likely average rate of dewatering. This option represented the
situation of reinjecting all dewatering water during construction.
2. Short-term reinjection of the dewatered water into groundwater at 300 L/s for 5 days. This scenario
represented the situation that could occur if, during construction of the lift shaft (greatest drawdown
required), the discharge to the Okeover was restricted.
3. Short-term reinjection of the dewatered water into groundwater at 200 L/s for 2 days. This option
represented the situation of the dewatering water being continually discharged to the Okeover Stream
except for when the Okeover was above a certain stage height. During these times of restrictions the
dewatering water would be reinjected into the aquifer. For this modelling, it was assumed that dewatering
at the building site had been taking place prior to reinjection occurring. This was to incorporate the
background drawdown caused by the dewatering that could be expected to exist prior to the short-term
reinjection of the water.
The modelling indicated that the reinjection could be managed via the number and location of injection bores to
ensure that aquifer pressures remained below ground level for both the short-term and long-term scenarios. It was
identified that some variation in the injection rates between bores could be made to minimise the mounding.
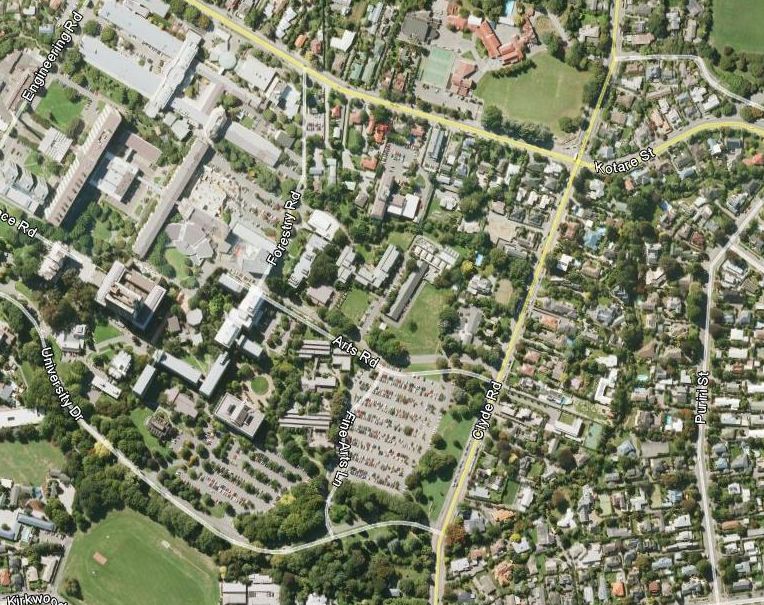
Figure 4 is an example of the model output. This shows the predicted drawdown around the construction site and
mounding around the reinjection bores after 6 months of continuous dewatering and reinjection at a rate of
200 L/s, using the parameter set that resulted in the maximum change in groundwater levels.
While the level of mounding was shown to be acceptable, the modelling did indicate that the reinjection of water
could create some interference with the dewatering by causing a mounding effect in the construction area.Given the potential for the reinjection of dewatered water to result in a rise in groundwater levels in the
dewatering area, further modelling was carried out using the set of parameters that resulted in the minimum
change in groundwater levels in the excavation area. The purpose of this was to assess the minimum drawdown
that could be achieved at the proposed dewatering rates. A dewatering system must achieve a sufficiently large
drawdown in the excavation area. Using the set of parameters with a higher aquifer transmissivity provided the
minimum change in groundwater level that could occur at the proposed dewatering rates, which is the worse case
scenario for the dewatering process.
This modelling indicated that the proposed dewatering rates could depress groundwater levels to the required
level, even with reinjection of the water occurring. Because of the potential for interference between the
reinjection and the dewatering, the reinjection was considered more suitable for short term durations to minimise
pumping costs, for example when discharge to the Okeover Stream was not possible due to high flows. However,
the modelling indicated that both short-term and long-term reinjection was feasible.
Figure 4: Drawdown at 6 months and 200 l/s continuous dewatering and reinjection using parameter set that
resulted in maximum change in groundwater levels5 RESOURCE CONSENTS
On the basis of the modelling results, bore permits were sought for a total of eight additional bores at the
optimum locations determined through the modelling. Concurrently, consent applications were lodged for
further testing of the bores and to discharge the dewatering water to the reinjection bores upon completion of
the testing.
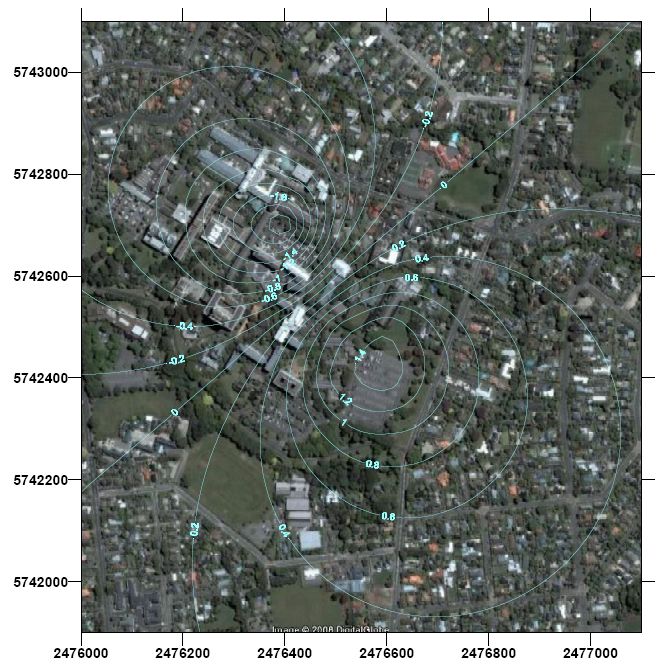
Consents were granted non-notified and the additional bores were drilled, tested and connected into a pipe
network from the excavation site. A schematic of the scheme is shown in Figure 6. Also shown on Figure 6 are
the locations of the six extraction bores for the dewatering located on the perimeter of the excavation site.
Consent conditions on the consent to reinject the dewatering water included the following requirements:
- Maximum discharge rate not to exceed rate of dewatering
- Maximum duration of 1 year
- Reinjection to reduce or cease if groundwater levels rise to within 0.5 mbgl on campus (measured at
two piezometers)
The consent application to discharge to the Okeover proceeded to a hearing, and was subsequently granted.
Consent conditions on the Okeover Stream discharge consent included the following requirements:
- Maximum discharge of 300 L/s for a maximum of one week during the lift shaft construction
- Maximum discharge of 200 L/s at all other times
- Minimum specified freeboard during dry weather (specified at particular property)
- Discharge to cease when water level exceeds set RL (specified at particular property)
- Maximum duration of 6 months
With the restrictions on the consent to discharge to the Okeover, it was necessary to have the reinjection
system in place for periods of high flow in the Okeover.
6 RESULTS FROM THE DEWATERING PERIOD
Reinjection of the dewatering water was successfully completed during construction of the basement, the lift
shaft and the first storey. The reinjection system proved to be a necessity as the dewatering rate required to
allow construction was 275 L/s, while the consent to discharge to the stream only permitted 200 L/s. In
addition, there was one day when restrictions were in place on the Okeover discharge consent, which meant all
water had to be discharged to the reinjection system during this time to ensure that the construction site was not
inundated.
Figure 5 shows the groundwater levels in two piezometers monitored on site over the dewatering period. Also
plotted on this graph is the combined injection rate (total discharge flow rate across all reinjection bores) and
the combined abstraction rate (total abstraction flow rate across all abstraction bores). The difference between
these two lines represents the rate of discharge to the Okeover. Discharge to the Okeover commenced on 8
September 2008 and ceased on 29 January 2010. The peak abstraction rate was 280 L/s. The peak rate of
discharge to the reinjection system was 233 L/s.T he Okeover stream stage is also plotted on Figure 5. There is a small increase in stream stage over the period
where dewatering water was being discharged to the stream and subsequent decrease at the end of this period.
The groundwater level data for the piezometers in Figure 5 shows that the levels remained below the required 0.5
metre below ground level over the course of the reinjection. A decreasing trend can be seen in the water levels.
This is likely to be a combination of a natural decline due to decreasing aquifer recharge over the summer
months, and the net abstraction from the aquifer. More water was being abstracted from the dewatering bores
than being discharged to the reinjection bores, with the difference being the discharge to the Okeover Stream.
0 300
0.5
Pumping rate (L/s) and stream stage (cm)
250
1
Difference = discharge
rate to the Okeover
1.5 Stream
200
Depth to water (mbgl)
2
2.5 150
3
100
3.5
4
50
4.5
5 0
4 Nov
29 Jul
16 Sep
23 Sep
30 Sep
16 Dec
23 Dec
30 Dec
6 Jan
12 Aug
19 Aug
26 Aug
2 Sep
9 Sep
2 Dec
9 Dec
14 Oct
21 Oct
28 Oct
5 Aug
10 Feb
17 Feb
24 Feb
10 Mar
17 Mar
7 Oct
11 Nov
18 Nov
25 Nov
3 Feb
3 Mar
13 Jan
20 Jan
27 Jan
5 m obs Piezo 1 DW3 Piezo DW7 Stream gauge Combined injection rate (L/s) Combined abstraction rate (L/s)
Figure 5: Monitoring results
7 CONCLUSIONS
The reinjection system was a successful solution to discharge the dewatering water that could not be discharged
to the Okeover Stream.
The aquifer testing proved that the reinjection was feasible. It also provided critical information on the aquifer
properties, which was required to determine the layout of the reinjection system through the groundwater
modelling.
The groundwater modelling was a fundamental part of the design process. This ensured that the appropriate
number of bores were installed at the optimal locations to prevent raising groundwater levels excessively. The
modelling also minimised the costs of the bore installation and pipework by determining the critical number of
bores required and the minimum spacing.
This project demonstrated that, with appropriate investigations and analysis, the reinjection of dewatering water
can be a feasible alternative to surface water discharges.
REFERENCESBoulton, N. S. (1973). ‘The influence of delayed drainage on data from pumping tests in unconfined aquifers.’ Journal of Hydrology, 19, 57-169
Figure 6: Abstraction and reinjection system
You can also read