ANALYSIS OF ESTIMATED DOPPLER RADAR RAINFALLS. CASE STUDIES FOR NORTH-WESTERN ROMANIA USING TWO WSR-98D DOPPLER RADARS
←
→
Page content transcription
If your browser does not render page correctly, please read the page content below
How to cite: Nițoaia, A., Maier, N., Kocis, I. (2021) Analysis of Estimated Doppler Radar Rainfalls. Case Studies
for North-Western Romania Using Two Wsr-98d Doppler Radars. 2021 ”Air and Water – Components of the
Environment” Conference Proceedings, Cluj-Napoca, Romania, p. 209-224, DOI: 10.24193/AWC2021_20.

      ANALYSIS OF ESTIMATED DOPPLER RADAR RAINFALLS.
     CASE STUDIES FOR NORTH-WESTERN ROMANIA USING TWO
                   WSR-98D DOPPLER RADARS

                      Andrei NIȚOAIA 1, Narcis MAIER1, István KOCIS2
                                        DOI: 10.24193/AWC2021_20

      Abstract: This paper aims to analyse the precipitation quantities measured during
      August, 2020 at the meteorological stations and gauging stations in north-western
      Romania, compared to the WSR-98D Doppler weather radar estimations. This study
      was motivated by the presence of major differences in the precipitations field between
      both radar estimations and gauging stations measurements, and this paper aims to
      identify the factors that led to these differences. The results showed that during
      convective and pre-frontal situations, the WSR-98D Oradea (RDOD) and WSR-98D
      Bobohalma (RDBB) weather radars detected the water amounts and their maximum
      quantities. Hence, RDOD detects precipitation with a higher accuracy for the Apuseni
      Mountains and the western part of Cluj and Sălaj counties, while RDBB detects the
      amounts of precipitations for about the entire area. During frontal situations, when the
      frontal systems occur early in the morning, the estimations are less accurate, but once
      more, RDBB detects the area with important rainfall amounts, yet underestimated.

      Keywords: north-western Romania, Doppler weather radar, precipitations.

 1. INTRODUCTION

     The rainfall forecast is one of the most difficult, but also the most important
 activity for meteorology and hydrology. Estimating rainfalls using the weather radars
 and the gauge stations represents different measurement methods.
     Rain gauges are traditionally used to measure the amount of rainfall at a given
 location, while weather radars detects rainfalls for an entire area, usually within a
 radius of 250 km.
     Espinosa et al. (2015) analyzes two heavy rainfall situations using three Doppler
 radars, in order to identify the accuracy, according to the distance and topographic
 influence.
     Burcea et al. (2012) in their study for the Moldavian Plateau (north-eastern
 Romania), using one Doppler radar compared the rainfall amounts estimated by

 1
   National Meteorological Administration – Northern Transylvania Regional Meteorological Center,
 Cluj-Napoca, Romania, nitoaia.andrei@gmail.com , narcis.maier@gmail.com
 2
   Babeș-Bolyai University, Faculty of Geography, 5-7, Clinicilor Street, Cluj-Napoca, 400006, Cluj
 Country, Romania, kfistvan@yahoo.com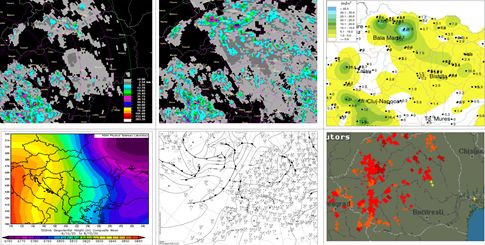
weather radar and also recorded within gauge stations. The result was that the best
radar accuracy is within a radius of 150 km.
    Kreklow et. al. (2020) realized a climatological radar study for Germany, getting
results meant to ease the climatic studies of the precipitation, according to the season,
orography and rainfall intensity.
   Unfortunately for the forecasters, the weather radar is limited, which often
represents a difficulty for nowcasting rainfall weather forecast, especially in terms
of estimating the quantities.
   The study area natural frame is characterized through heterogeneity, being
present all the major landforms (mountains, plateaus, hills, plains), the hills and the
plateaus being predominant.

2. DATA AND METHODS

    In this study, a comparative analysis regarding the rainfall amount estimated by
RDOD and RDBB weather radars and measured at the gauging stations was made,
in north-western Romania, for August, 2020 period.

                      Fig. 1. Northwestern Romania – the study area

   The data used in the present study consists of daily rainfall amount maps. The
radar data was collected from Doppler Weather Radar database, RDOD, situated in
Bihor county and RDBB, situated in Mureș county, the study area being entirely
within the scanning radius of the both radars. The USP (User Selectable Precipitation
- 24 hrs) radar product was used.
   The USP radar product from both radars were compared with the rainfall amounts
measured at the gauging stations from the analyzed area. It is important to mention
that during 11th to 20th August 2020, the USP radar product from RDOD was
unavailable because of technical issues, so for this interval only the USP radar
product from RDBB was used.
                                         210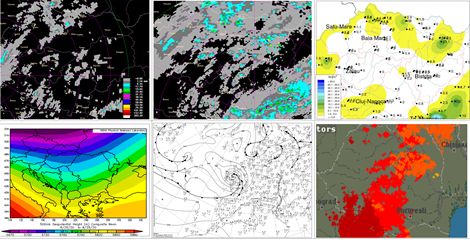
For the case studies identification of the rainy days from the weather stations
subordinated to the Northern Transylvania Regional Meteorological Center was
performed. The result was 14 cases (days) with precipitations.
Afterwards, a daily synoptic weather conditions associated with air instability
was made. For this classification, the http://www.wetter3.de/Archiv/, and
http://www.esrl.noaa.gov archives were consulted. For this stage, we consulted
distribution field of the geopotential height at 500 hPa level (gpdam) and the
distribution of the surface pressure level and associated frontal systems.
For the entire month, the 4th-5th, 7th-8th, 9th-11th, 15th-16th, 17th-19th, 23rd-25th of
August rainy days cases were identified.
3. THE ANALYSYS Of THE INSTABILITY SITUATIONS. CASE STUDIES
3.1. 4th - 5th of August, 2020
The weather during 4th to 5th of August, 2020 was influenced by the presence of
a Mediterranean depression, centered on the Adriatic Sea, visible on the distribution
field of the geopotential height at 500 hPa level and also on the distribution of the
surface pressure level and associated frontal systems (Fig.2). For the analysed
region, the southern mid-altitude air circulation prevailed, in 4th of August, 2020, in
the Cluj and Sălaj counties mountain area, the initiation of some convective systems
who migrated north-northwest and brought isolated rainfalls, the maximum amount
being 8.8 mm, at Supuru de Jos station.
The images of the RDOD and RDBB quantitative rainfall estimations identify the
Apuseni (Cluj County) and Plopiș (Sălaj County) Mountains as convective systems
initial spot development, but a difference regarding the quantitative rainfall
estimations for the Satu Mare county is obvious. Thus, RDBB estimates quantities
up to 25 mm, while RDOD only 6.5 mm for the area of interest.
The distances between precipitation area and RDBB was approximately 125 km,
while RDOD was just 70 km far. Thereby, for Supuru de Jos station, RDBB detected
a 6.5-12.5 mm pixel, and RDOD a 2.5-6.5 mm pixel, so the accuracy is better for
RDBB, despite the great distance. Both radars rainfall estimations were similar for
the Vlădeasa Mountain area.
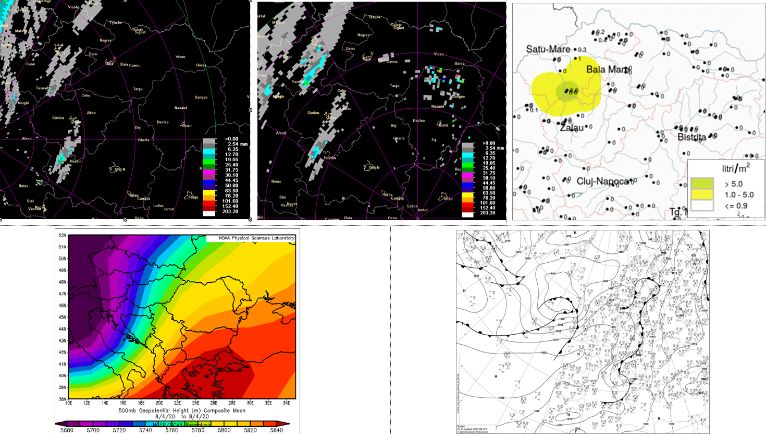
On the 5th of August, the atmospheric conditions are changing, with the advance
of a ”cut-off” low, blocked by the anticyclonic ridge, centered on the area of interest
(Fig.3). This ”cut-off” low generated the ascending of the air masses, across the Oaș-
Gutâi-Țibleș mountain range from Satu Mare and Maramureș counties.
In this atmospheric conditions, the convective cells migrated along the mountain
range, on a SE-NW direction, generating on the southern slope water amounts up to
29.7 mm/24 hrs (Lăpușel gauging station). RDBB estimated a maximum water
amount of around 40 mm, while RDOD only 9-10 mm/24 hrs. Both radars are
situated within a radius of 150 km. The water amount estimated by RDBB for the
Lăpușel area is almost 35 mm/24 hrs. Also, compared to the previous day, because
of the dynamic convection, lightning was detected. Again, the quantitative rainfall
estimations for the Vlădeasa Mountains are similar for both radars.
211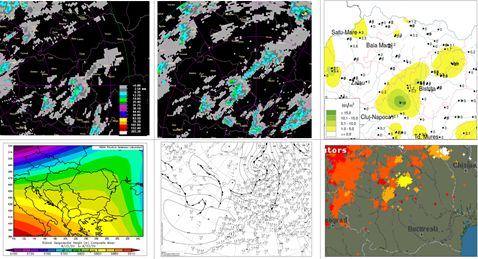
Fig. 2. The USP radar product for RDOD (up-left) and RDBB (up-center), The 24 hrs
 water amounts recorded at the gauging stations map (up-right), distribution field of the
geopotential height at 500 hPa level (gpdam, down-left), sea level pressure and associated
 frontal systems on the 4th of August, 2020, 06 GMT (down-right). Source: Cluj Weather
             Forecast Regional Service Radar Archive (2020), N.M.A. Archive,
                 http://www.wetter3.de/Archiv/, http://www.esrl.noaa.gov

    Fig. 3. The USP radar product for RDOD (up-left) and RDBB (up-center), the 24 hrs
 water amounts recorded at the gauging stations map (up-right), distribution field of the
geopotential height at 500 hPa level (gpdam, down-left), sea level pressure and associated
     frontal systems on the 5th of August, 2020, 12 GMT (down-center), the electrical
  discharges map (down-right). Source: Cluj Weather Forecast Regional Service Radar
              Archive (2020), N.M.A. Archive, http://www.wetter3.de/Archiv/,
        http://www.esrl.noaa.gov, https://www.blitzortung.org/en/archive_data.php

   3.2. 7th-8th of August, 2020
   The synoptic analyses of the 7th to 8th of August, 2020 highlights a Mediterranean
depression passing the southern flank of Romania. If the convective activity is very
                                          212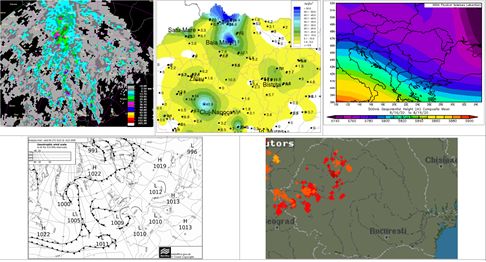
intense in the Balkan area, it is opposite in the analysed area (the prove being the
missing lightning phenomena, especially on 7th of August). (Fig 4) The estimated
water amounts on 7th of August highlights a migration on a east-west direction of the
cloud formations, initially developed in Mureș and Târnava (Mureș County)
hydrographical basins. Both radars detected the cloud systems and water amounts
fallen in Cluj County and afferent mountain area.

    Fig. 4. The USP radar product for RDOD (up-left) and RDBB (up-center), The 24 hrs
 water amounts recorded at the gauging stations map (up-right), distribution field of the
geopotential height at 500 hPa level (gpdam, down-left), sea level pressure and associated
 frontal systems on the 7th of August, 2020, 12 GMT (down-right). Source: Cluj Weather
             Forecast Regional Service Radar Archive (2020), N.M.A. Archive,
                 http://www.wetter3.de/Archiv/, http://www.esrl.noaa.gov
    On the 8th of August, the low pressure system was positioned on Romania`s
southern side, and the interest area was at the contact between the depression and the
Scandinavian anticyclonic ridge, situated in north-western flank. The electrical
discharges (Fig. 5) highlights the intense convective activity.
    Thus, the water amounts registered were about 31 mm/24 hrs (at Răzoare gauging
station, Maramureș County), located west of Târgu Lăpuș weather station. Despite
the significant distance (120 km for RDBB and 150 km for RDOD), the estimations
of both radars were accurate (around 30-32 mm/24 hrs). For Cluj County, even
though the distances are different (120 km for RDOD and 70 km for RDBB), the
estimations were quite similar.
    3.3. 9th-11th of August, 2020
    For the aforementioned period, the distribution field of the geopotential height at
500 hPa level highlights the passage of an upper backward low towards Black Sea,
materialized through a north-north-eastern air circulation. On the 9th of August, the
cloud formations, initially developed on northern flank of the Eastern Carpathians,
moved towards southern zone, generating water amounts below to 15 mm/24 hrs
                                         213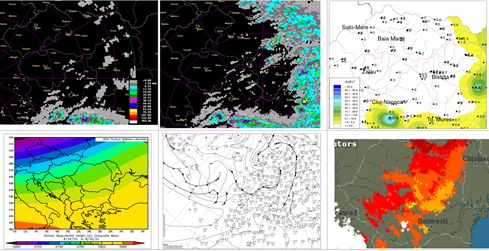
(Oaș Depression, Fig. 6). The RDOD and RDBB, situated between 150-200 km
distance from the precipitations area, estimated rainfalls for small areas.

    Fig. 5. The USP radar product for RDOD (up-left) and RDBB (up-center), the 24 hrs
 water amounts recorded at the gauging stations map (up-right), distribution field of the
geopotential height at 500 hPa level (gpdam, down-left), sea level pressure and associated
     frontal systems on the 8th of August, 2020, 12 GMT (down-center), the electrical
  discharges map (down-right). Source: Cluj Weather Forecast Regional Service Radar
              Archive (2020), N.M.A. Archive, http://www.wetter3.de/Archiv/,
        http://www.esrl.noaa.gov, https://www.blitzortung.org/en/archive_data.php
    The RDBB weather radar estimates water amounts between 6.5 to 12.5 mm, while
RDOD does not estimate the precipitations area located in north-eastern side of Satu
Mare County and gives an underestimated water amount for Baia Mare weather
station (less than 5 mm, while the water amount recorded was 12.5 mm). Also, the
north-western part of the Bistriţa-Năsăud county is well estimated by RDBB,
situated between 100-150 km distance, and less estimated by RDOD (located to more
than 200 km distance).
    On the 10th of August, the convective activity was intensified, especially in the
mountain area, where the rainfall amounts exceeded 15 mm, with a maximum of
45.2 mm in 24 hrs at Firiza gauging station, respectively 34.0 mm in 24 hrs at
Pășunea Mare (Fig. 7). The radar estimations highlight a major difference between
RDOD and RDBB radars, especially for Maramureș and Satu Mare counties.
    Thereby, RDBB estimated water amounts of approximately 45-50 mm in 24 hrs
in the area of Firiza (MM), and for Satu Mare County (Oaș Depression zone), mean
quantities of 35-40 mm. Opposite to RDBB, the RDOD radar underestimated the
water amount fallen in the area, with an isolated spot of 25 mm in 24 hrs (Maramureș
County). For Cluj and Sălaj counties western part, both radars have a good
correlation within precipitations area.

                                          214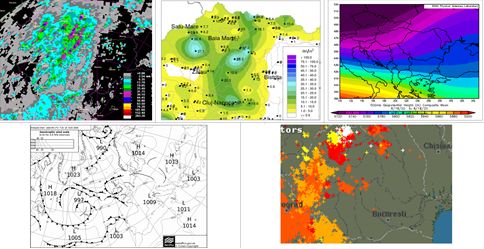
Fig. 6. The USP radar product for RDOD (up-left) and RDBB (up-center), the 24 hrs
 water amounts recorded at the gauging stations map (up-right), distribution field of the
geopotential height at 500 hPa level (gpdam, down-left), sea level pressure and associated
     frontal systems on the 9th of August, 2020, 12 GMT (down-center), the electrical
  discharges map (down-right). Source: Cluj Weather Forecast Regional Service Radar
              Archive (2020), N.M.A. Archive, http://www.wetter3.de/Archiv/,
        http://www.esrl.noaa.gov, https://www.blitzortung.org/en/archive_data.php

  Fig. 7. The USP radar product for RDOD (up-left) and RDBB (up-center), the 24 hrs
 water amounts recorded at the gauging stations map (up-right), distribution field of the
geopotential height at 500 hPa level (gpdam, down-left), sea level pressure and associated
    frontal systems on the 10th of August, 2020, 12 GMT (down-center), the electrical
  discharges map (down-right). Source: Cluj Weather Forecast Regional Service Radar
              Archive (2020), N.M.A. Archive, http://www.wetter3.de/Archiv/,
        http://www.esrl.noaa.gov, https://www.blitzortung.org/en/archive_data.php

                                          215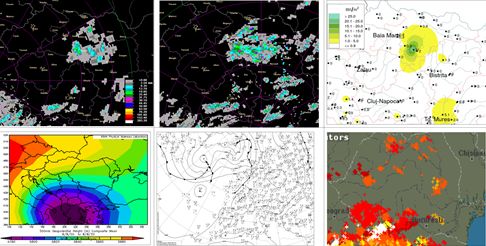
Fig. 8. The USP radar product for RDBB (up-left), the 24 hrs water amounts recorded at
 the gauging stations map (up-right), distribution field of the geopotential height at 500
  hPa level (gpdam, down-left), sea level pressure and associated frontal systems on the
  11th of August, 2020, 12 GMT (down-right). Source: Cluj Weather Forecast Regional
      Service Radar Archive (2020), N.M.A. Archive, http://www.wetter3.de/Archiv/,
                                http://www.esrl.noaa.gov

   On the 11th of August, the precipitations area is diminishing, while the air instability
continues within the mountain area. A major difference is obvious in this day, the
maximum water amount estimated by RDBB in the mountain zone was 35 mm,
compared to the 4.8 mm quantity, recorded at Băișoara weather station. The RDOD
database was unavailable for this period of time due to technical issues. (Fig. 8)

     3.4. 15th-16th of August, 2020
     For this period, the synoptic analysis highlights the passage of a Mediterranean
depression located west of the country, while at the 850 hPa level, the air temperature
decreases. On the distribution field of the geopotential height at 500 hPa level map,
Romania was on the downward slope of an upper anticyclonic ridge, present above
the central-north flank of the European continent (Fig. 9). The air instability
increases, starting with Apuseni Mountains and gradually evolving to the eastern
side of the studied region. In this conditions, on the 15th of August, 2020, the
maximum water amount recorded at Recea Cristur gauging station (Cluj County)
was 95.4 mm. For this rainfall amount, RDBB detects in the area a pixel between
63.5 to 76.2 mm (Fig.9). Overall, for the Cluj-Napoca weather station, RDBB
estimated small quantities (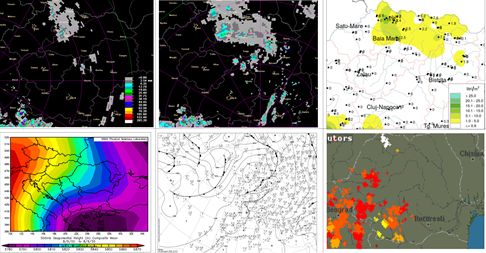
Fig. 9. The USP radar product for RDBB (up-left), the 24 hrs water amounts recorded at
 the gauging stations map (up-right), distribution field of the geopotential height at 500
  hPa level (gpdam, down-left), sea level pressure and associated frontal systems on the
  15th of August, 2020, 12 GMT (down-right). Source: Cluj Weather Forecast Regional
      Service Radar Archive (2020), N.M.A. Archive, http://www.wetter3.de/Archiv/,
                                http://www.esrl.noaa.gov

Fig. 10. The USP radar product for RDBB (up-left), the 24 hrs water amounts recorded
 at the gauging stations map (up-center), distribution field of the geopotential height at
500 hPa level (gpdam, up-right), sea level pressure and associated frontal systems on the
 16th of August, 2020, 06 GMT (down-left), the electrical discharges map (down-right).
Source: Cluj Weather Forecast Regional Service Radar Archive (2020), N.M.A. Archive,
                http://www.wetter3.de/Archiv/, http://www.esrl.noaa.gov,
                    https://www.blitzortung.org/en/archive_data.php

                                          217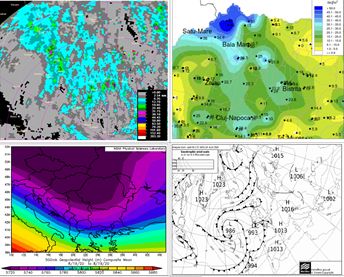
3.5. 17th-19th of August, 2020
   This period is characterized by an intense cyclonic activity, in north-north-
western part of the country. In the first two days of the interval, a pre-frontal synoptic
condition is present, the analysed area is on the ascending slope of an upper trough,
as we can notice on the 24 hrs precipitations map. On the 17th of August, the
convection starts in the Apuseni Mountains, in the afternoon and in the evening,
moving eastward, , without electrical discharges (Fig. 11). On the 18th of August, the
convective activity increases, starting at noon, as it can be noticed on the electrical
discharges map (Fig. 12). Again, the precipitations fields are estimated with a higher
accuracy by the RDBB radar, with insignificant differences regarding to the
maximum water amounts recorded, especially for Satu Mare and Maramureș
counties (situated between 120-200 km distance).

 Fig. 11. The USP radar product for RDBB (up-left), the 24 hrs water amounts recorded at
 the gauging stations map (up-right), distribution field of the geopotential height at 500 hPa
   level (gpdam, down-left), sea level pressure and associated frontal systems on the 17th of
August, 2020, 12 GMT (down-right). Source: Cluj Weather Forecast Regional Service Radar
  Archive (2020), N.M.A. Archive, http://www.wetter3.de/Archiv/, http://www.esrl.noaa.gov
    On the 19th of August, starting in the early morning the frontal system is moving
across the analysed area. Thus, the maximum air temperatures decrease from 29°C
in the previous day, to less than 23°C (recorded at Sighetu Marmației weather
station).
    The weather was cold, the electrical discharges were missing and the
precipitations were both rain showers and continuous rains. The water amounts
recorded at the weather/gauging stations exceeded 20 mm on extended areas, with a
maximum water amount of 64.3 mm (Satu Mare weather station), followed by 45.0
mm at Cavnic (Maramureș County), 46.5 mm la Sălătig gauging station (Sălaj
County), 60.5 mm at Așchileu Mare gauging station (Cluj County) and 30.9 mm at
Chiraleș gauging station (Bistrița-Năsăud County).
                                            218
Fig. 12. The USP radar product for RDBB (up-left), the 24 hrs water amounts recorded
at the gauging stations map (up-center), distribution field of the geopotential height at
500 hPa level (gpdam, up-right), sea level pressure and associated frontal systems on the
18th of August, 2020, 06 GMT (down-left), the electrical discharges map (down-right).
Source: Cluj Weather Forecast Regional Service Radar Archive (2020), N.M.A. Archive,
http://www.wetter3.de/Archiv/, http://www.esrl.noaa.gov,
https://www.blitzortung.org/en/archive_data.php
In this synoptic condition, the significant water amounts areas were not estimated
by the RDBB. The mean differences exceeded 10 to 15 mm/24 hrs. For instance, on
the central-west flank of the Sălaj and Satu Mare counties, where 20-25 mm mean
water amounts have been recorded, the RDBB estimates only 6.5-12.5 mm. Even
though the maximum rainfall amounts are estimated, the differences remain obvious.
Thus, Satu Mare County, with a peak of 60.0 mm, was estimated at 25 mm (Fig. 13).
This area is between 150-200 km distance. Located at a smaller distance (50-100
km), the Bistrița-Năsăud precipitations field was better estimated (30.9 mm recorded
at the Chiraleș gauging station, compared to the 25 to 38 mm estimated by RDBB).
3.6. 23rd-25th of August,2020
In this period, at ground level, a south-western air circulation caused by a low
pressure system situated on the north-north-west side of Romania was present.
During afternoon, the convective activity was intensified. The cloud formations are
moving SW-NE during the entire period. On the distribution field of the geopotential
height at 500 hPa level, a difluence of the baric field is highlighted, which leads to
the intense convective activity and associated electrical discharges, especially in the
central-eastern and southern part of Romania (Fig. 14).
On the 23rd of August, the water amount recorded at Luna de Jos gauging station
(18.0 mm), was identically estimated by both RDOD and RDBB radars. In the
opposite, on the 24th of August, both radars estimated the precipitations area, with a
219maximum of 45-65 mm in 24 hrs, at the borderland between Cluj and Alba counties
(Fig. 15), while the maximum water amount registered was 50.6 mm in 24 hrs.
Fig. 13. The USP radar product for RDBB (up-left), the 24 hrs water amounts recorded at
the gauging stations map (up-right), distribution field of the geopotential height at 500 hPa
level (gpdam, down-left), sea level pressure and associated frontal systems on the 19th of
August, 2020, 12 GMT (down-right). Source: Cluj Weather Forecast Regional Service Radar
Archive (2020), N.M.A. Archive, http://www.wetter3.de/Archiv/, http://www.esrl.noaa.gov
On the 25th of August, the precipitations field has diminished, leaving only in the
mountain area, relative to the radar`s estimations (Fig.16). Thereby, RDBB
estimated small water amounts, spread on extended areas, approaching the water
amount recorded at the gauging stations, while RDOD estimated a small area, with
quantities less than 5 mm in 24 hrs, in general. Consequently, the gap between the
RDOD and RDBB radars water estimations is highlighted, especially for the eastern
part of the area, Cluj and Sălaj counties being the best estimated regions.
4. RESULTS AND CONCLUSIONS
Following the analysis of the 14 rainy days from August, 2020, the synoptic
conditions were grouped in 6 periods: 4-5, 7-8, 9-11, 15-16, 17-19, 23-25 (Table 1)
Tabel 1. The rainy days classification according to the synoptic conditions
Period Convective Situations Frontal Situations
4th-5th of August X -
7th-8th of August X -
9th-11th of August X -
15th-16th of August X X
17th-19th of August X X
23rd-25th of August X X
220Fig. 14. The USP radar product for RDOD (up-left) and RDBB (up-center), the 24 hrs
water amounts recorded at the gauging stations map (up-right), distribution field of the
geopotential height at 500 hPa level (gpdam, down-left), sea level pressure and associated
frontal systems on the 23th of August, 2020, 12 GMT (down-center), the electrical
discharges map (down-right). Source: Cluj Weather Forecast Regional Service Radar
Archive (2020), N.M.A. Archive, http://www.wetter3.de/Archiv/,
http://www.esrl.noaa.gov, https://www.blitzortung.org/en/archive_data.php
Fig. 15. The USP radar product for RDOD (up-left) and RDBB (up-center), the 24 hrs
water amounts recorded at the gauging stations map (up-right), distribution field of the
geopotential height at 500 hPa level (gpdam, down-left), sea level pressure and associated
frontal systems on the 24th of August, 2020, 12 GMT (down-center), the electrical
discharges map (down-right). Source: Cluj Weather Forecast Regional Service Radar
Archive (2020), N.M.A. Archive, http://www.wetter3.de/Archiv/,
http://www.esrl.noaa.gov, https://www.blitzortung.org/en/archive_data.php
221Fig. 16. The USP radar product for RDOD (up-left) and RDBB (up-center), the 24 hrs
water amounts recorded at the gauging stations map (up-right), distribution field of the
geopotential height at 500 hPa level (gpdam, down-left), sea level pressure and associated
frontal systems on the 25th of August, 2020, 12 GMT (down-center), the electrical
discharges map (down-right). Source: Cluj Weather Forecast Regional Service Radar
Archive (2020), N.M.A. Archive, http://www.wetter3.de/Archiv/,
http://www.esrl.noaa.gov, https://www.blitzortung.org/en/archive_data.php
The convective and pre-frontal synoptic conditions highlighted that both RDOD
and RDBB are in correlation with the registered water amounts, but with
abnormalities between different areas. Thus, of the six consecutive periods, the
comparison between RDOD and RDBB was made for four of them (4th - 5th, 7th-8th,
9th-11th, 23rd-25th). This cases showed that both radars give a good estimation for the
Apuseni Mountains and western flank of Cluj and Sălaj counties, areas located
between 50 to 150 km distance.
For the other areas, RDOD underestimate the water amounts, and also the lack of
them for the eastern part of the studied region (Maramureș and Bistrița-Năsăud
counties, located between 150 to 200 km distance). In opposite, RDBB`s estimations
are satisfactory for the whole region, including areas located between 150 to 200 km
(Maramureș Country and the north-eastern part of Satu Mare).
On the 4th to 11th and 23rd of August cases, the air instability was determined also
by the daily maximum temperatures regime, greater than 30°C, which generated
convective instability during afternoon and evening.
The other periods (15-16, 17-19, 23-25) highlights both pre-frontal convective
situation at the beginning, and the frontal systems at the end of the period. In this
222cases, during pre-frontal situations, the RDBB estimations are in a good correlation
with the water amounts measured at the weather/gauging stations.
On the other hand, during the frontal situations, that occurred early in the morning
(16th and 19th of August) and lasting for the whole day, generating rain showers and
heavy rains, accumulating significant amounts of water. In this conditions, RDBB
underestimated the water amounts, with quantities between 20 to 25 mm in 24 hrs.
On the 24th to 25th of August period, the frontal systems manifested during
afternoon and evening, with frequently rain showers and associated electrical
discharges. In this situations, the estimations of RDOD and RDBB were close to the
water amount measured within gauging stations, for the Apuseni Mountains and Cluj
and Sălaj counties western flank. For the eastern half and the northern part of the
region, the estimations were unsatisfactory for RDOD, while RDBB had a suitable
estimation.
After this study, it was highlighted the fact that during convective and pre-frontal
situations, both RDOD and RDBB detects the precipitations areas and the maximum
water amounts registered, emphasizing at the same time that RDOD has a good
estimation of the water amount registered for the Apuseni Mountains and Cluj and
Sălaj counties western flank, while RDBB detects the quantitative rainfall amounts
for the whole area.
Finally, during frontal situations, in which frontal systems occur early in the
morning, the weather radar presents difficulties in estimating the rainfall amounts,
even though the Bobohalma radar detects the significant rainfall amounts areas, but
underestimated comparative to the measured quantities.
REFERENCES
1. Burcea S., Cheval S., Dumitrescu A., Antonescu B., Bell A., Breza T. (2012)
2. Comparison between radar estimated and rain gauge measured precipitation in the
Moldavian Plateau - April 2012 Environmental Engineering and Management
Journal 11(4):723-731 DOI: 10.30638/eemj.2012.092, accesed 30.10.2020;
3. Espinosa B., Hromadka T.V., Perez R. (2015) Comparison of radar data versus
4. rainfall data; https://core.ac.uk/display/91706987 accesed 30.10.2020;
5. Kreklow J., Tetzlaff B., Burkhard B., Kuhnt G. (2020) Radar-Based
6. Precipitation Climatology in Germany—Developments, Uncertainties and
Potentials Atmosphere 2020, 11(2), 217; https://www.mdpi.com/2073-
4433/11/2/217, accesed 30.10.2020;
7. *** Northern Transylvania Regional Meteorological Center – Weather Forecast
8. Regional Service – USP (User Selectable Precipitation – 24 hrs) Radar
2239. Archive, accesed 30.09.2020;
10. *** National Meteorological Administration – Archive of the 24 hrs
11. precipitations maps, accesed 30.09.2020;
12. *** (2020), http://www.esrl.noaa.gov, accesed 30.09.2020;
13. *** http://www.wetter3.de/Archiv/, accesed 30.09.2020;
14. *** https://www.blitzortung.org/en/archive_data.php, accesed 30.09.2020.
224You can also read