Rainfall, River Flow, and Groundwater Level State and Trends in Tāmaki Makaurau / Auckland 2010-2019. State of the Environment Reporting - Kolt ...
←
→
Page content transcription
If your browser does not render page correctly, please read the page content below
Rainfall, River Flow, and Groundwater Level State
and Trends in Tāmaki Makaurau / Auckland 2010-2019.
State of the Environment Reporting
Kolt Johnson
February 2021                 Technical Report 2021/06
Rainfall, river flow, and groundwater level state and
trends in Tāmaki Makaurau / Auckland 2010-2019.
State of the environment reporting.
February 2021                         Technical Report 2021/06

Kolt Johnson

Research and Evaluation Unit (RIMU)

Auckland Council
Technical Report 2021/06

ISSN 2230-4525 (Print)
ISSN 2230-4533 (Online)

ISBN 978-1-99-002294-4 (Print)
ISBN 978-1-99-002295-1 (PDF)
This report has been peer reviewed by the Peer Review Panel.

   Review completed on 5 February 2021

   Reviewed by two reviewers

   Approved for Auckland Council publication by:

   Name: Eva McLaren

   Position: Manager, Research and Evaluation (RIMU)

   Name: Matt Hope

   Position: Team Manager, Hydrology and Environmental Data Management (RIMU)

   Date: 5 February 2021

Recommended citation
Johnson, K (2021). Rainfall, river flow, and groundwater level state and trends in Tāmaki
Makaurau / Auckland 2010-2019. State of the environment reporting. Auckland Council
technical report, TR2021/06

© 2021 Auckland Council

Auckland Council disclaims any liability whatsoever in connection with any action taken in
reliance of this document for any error, deficiency, flaw or omission contained in it.

This document is licensed for re-use under the Creative Commons Attribution 4.0
International licence.

In summary, you are free to copy, distribute and adapt the material, as long as you
attribute it to the Auckland Council and abide by the other licence terms.
Rainfall, river flow, and groundwater level state and trends in Tāmaki Makaurau / Auckland 2010-2019   5

Executive summary

Auckland Council operates long-term hydrological monitoring programmes for river
flows and aquifer water levels throughout the region. Hydrological data is used to
determine the current state and long-term trends, identify environmental management
issues, inform the review and development of the Auckland Unitary Plan (AUP), and
to assess the effectiveness of current plan provisions. This report describes patterns and
trends in rainfall, river flow, and groundwater level and makes observations about the
impacts of resource use where data were available (for groundwater) and the
effectiveness of the current monitoring programmes to deliver on the stated objectives.
Climate drivers were investigated to provide context for the state and trends in this report.
The Interdecadal Pacific Oscillation was predominantly increasing, and El Niño Southern
Oscillation was predominantly decreasing, however there was not a clear relationship
between climate oscillations and observed rainfall. No monotonic trends in rainfall could be
established with confidence, however there was higher than normal rainfall in 2011 and
2016-2018. Trends in the number of high stream flows could not be established with
confidence, however, there was a clear pattern of decreasing numbers of high flow events
in urban catchments and increasing numbers of high flow events in rural catchments. High
rainfall years were also reflected in fewer minimum flow days.
The magnitude of annual low stream flows had increasing trends at two-thirds of flow
monitoring sites, but only two sites had trends that could be established with confidence.
Increasing trends in low stream flows did not reflect a pattern in location, catchment size, or
land cover, indicating that rainfall is the primary driver of streamflow trends. This is consistent
with rainfall patterns observed over the period of analysis. The frequency of low flows below
the MALF had decreasing trends (less days below) at all five minimum flow monitoring sites,
however, the rate of change could not be established with confidence.
Increasing trends were calculated for most groundwater monitoring sites for both mean
monthly (75%) and annual maximum groundwater level (62%). The spatial distribution of
increasing trends did not show a pattern in location or aquifer characteristics. Several
aquifers were found to be influenced by groundwater abstraction, leading to both decreased
water levels (Omaha Waitematā and Glenbrook Kaawa aquifers) and increased water levels
(Waiwera geothermal, Parakai geothermal). These cases were not representative of
monotonic trends, but rather step-changes in the annual water level pattern. All sites with
decreasing annual minimum groundwater levels did not have a corresponding trend in the
annual maximum, indicating that groundwater abstraction did not affect winter recharge to
aquifers. The decreasing summer groundwater levels observed in some aquifers are
temporary in duration and followed by full recovery of groundwater levels over winter.
Normal winter recharge in these aquifers suggests long-term sustainability. However, the
link between water use and groundwater level in some aquifers (Omaha Waitematā,
Waiwera and Parakai geothermal, and Glenbrook Kaawa aquifers) highlights the importance
of continued monitoring to inform ongoing management.
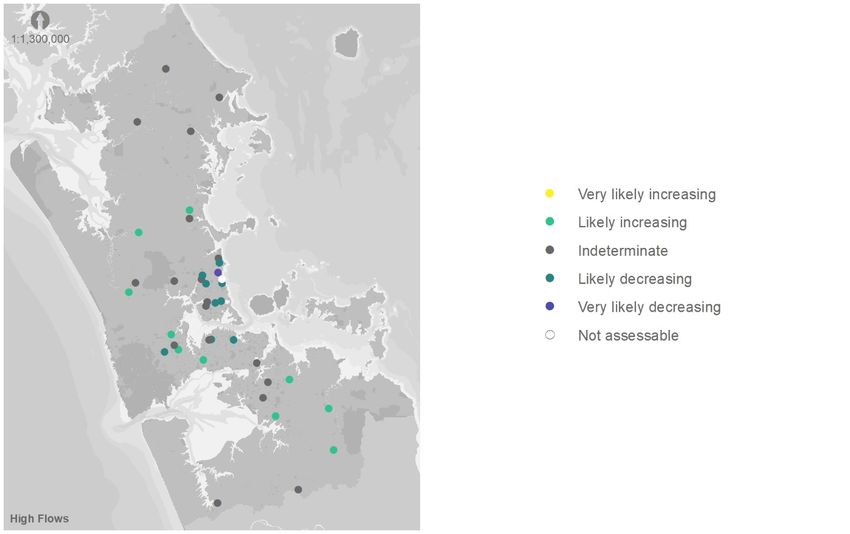
Table of contents
Executive summary ............................................................................................................. 5
Table of contents ................................................................................................................. 6
List of figures ....................................................................................................................... 7
List of tables......................................................................................................................... 8
1 Introduction ................................................................................................................. 10
1.1 National and regional directives ............................................................................ 10
1.2 Auckland streams ................................................................................................. 11
1.3 Auckland aquifers ................................................................................................. 12
1.4 State of the Environment report series ................................................................. 12
2 Methods ...................................................................................................................... 14
2.1 Rainfall.................................................................................................................. 14
2.2 Streams ................................................................................................................ 16
2.3 Aquifers ................................................................................................................ 20
2.4 Trend tests ............................................................................................................ 23
3 Results: Rainfall .......................................................................................................... 27
3.1 State and trends ................................................................................................... 27
4 Results: Streams ......................................................................................................... 29
4.1 Annual high stream flows ...................................................................................... 29
4.2 Annual low stream flows ....................................................................................... 31
5 Results: Aquifers ......................................................................................................... 37
5.1 Mean monthly groundwater level .......................................................................... 37
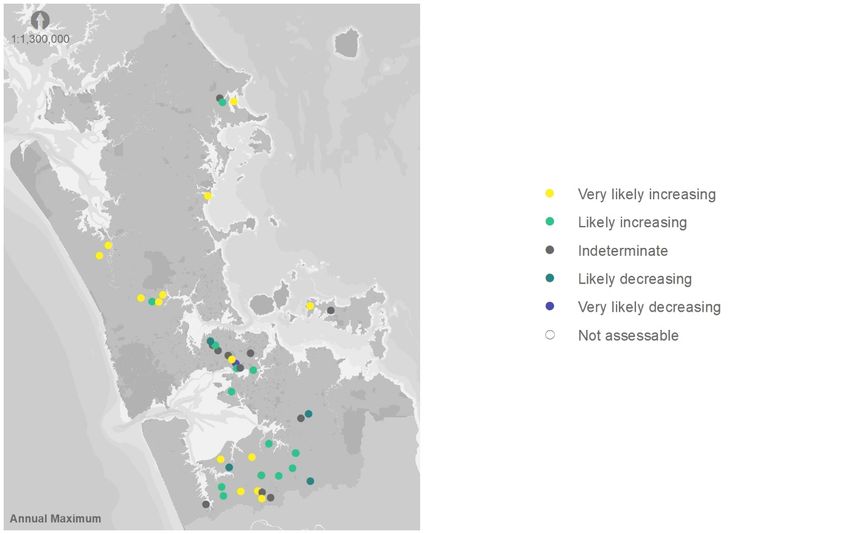
5.2 Annual maximum groundwater level ..................................................................... 40
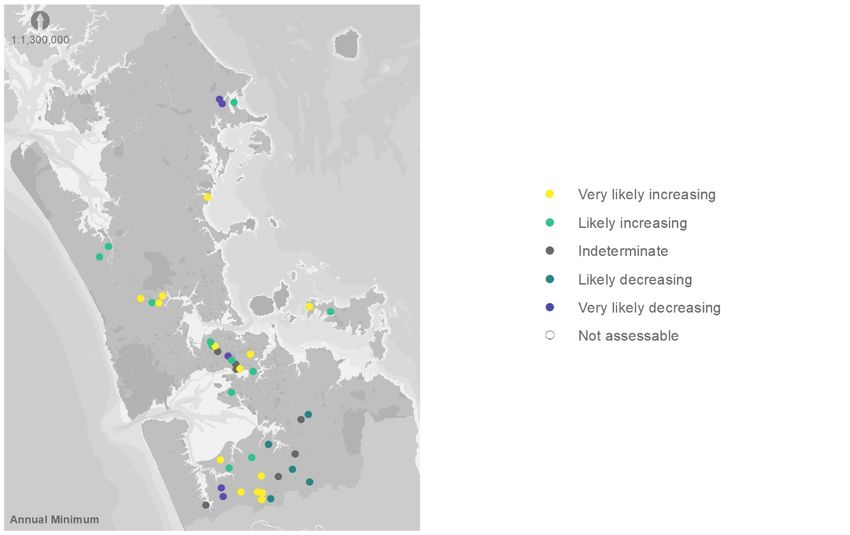
5.3 Annual minimum groundwater level ...................................................................... 42
6 Discussion ................................................................................................................... 44
6.1 Rainfall.................................................................................................................. 44
6.2 Annual high flows.................................................................................................. 46
6.3 Low flow magnitude and frequency ...................................................................... 47
6.4 Groundwater levels ............................................................................................... 49
6.5 Potential groundwater abstraction effects ............................................................. 53
7 Conclusions................................................................................................................. 70
7.1 Rainfall.................................................................................................................. 70
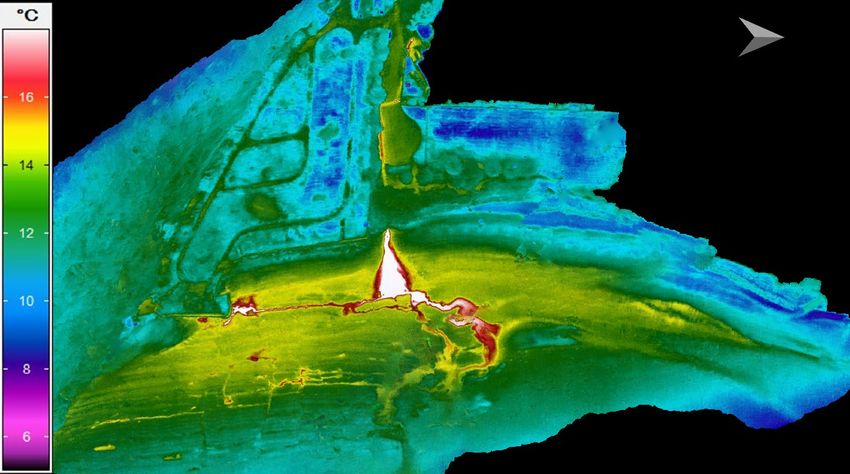
Rainfall, river flow, and groundwater level state and trends in Tāmaki Makaurau / Auckland 2010-2019                                        7

   7.2      Streams ................................................................................................................ 70
   7.3      Aquifers ................................................................................................................ 71
   7.4      Consented water allocation .................................................................................. 71
   7.5      Reporting gaps ..................................................................................................... 72
References ........................................................................................................................ 75
Appendix 1: Rain gauge site table ..................................................................................... 78
Appendix 2: Streams site table .......................................................................................... 80
Appendix 3: Groundwater site table ................................................................................... 82
Appendix 4: Groundwater state summary statistics (2015-2019)....................................... 85

List of figures

Figure 1: Auckland Council rainfall monitoring site locations, grouped by sub-regional area.
........................................................................................................................................... 15
Figure 2: Auckland Council State of the Environment stream flow monitoring site locations.
........................................................................................................................................... 17
Figure 3: Auckland Council State of the Environment monitoring well locations. ............... 22
Figure 4: Rainfall deviation from long-term mean for rain gauge groups (average value per
group). ............................................................................................................................... 27
Figure 5: Trend results for the annual frequency of high stream flows (>3XMedian) over
the period 2010-2019. ........................................................................................................ 31
Figure 6: Trend results for annual low flows over the period 2010-2019............................ 33
Figure 7: Days below the 7-day mean annual low flow over the period 2010-2019. .......... 34
Figure 8: Days below the AUP minimum flow over the period 2010-2019. ........................ 35
Figure 9: Trend results for mean monthly groundwater levels over the period 2010-2019.40
Figure 10: Trend results for annual maximum groundwater levels over the period 2010-
2019. .................................................................................................................................. 41
Figure 11: Annual minimum groundwater level trends over the last 10 years. ................... 43
Figure 12: Interdecadal Pacific Oscillation (annual values). Period of analysis highlighted
(2010-2019). Source: Ministry for the Environment. .......................................................... 45
Figure 13: Southern Oscillation Index (monthly values) during the reporting period. Source:
NIWA. ................................................................................................................................ 46
Figure 14: Groundwater level hydrograph at Quintals Road in the Omaha Waitematā
aquifer. ............................................................................................................................... 53
Figure 15: Groundwater level hydrograph for Omaha Flats Bore 25 in the Omaha
Waitematā aquifer. Red line indicates sea level (0.0m RL)................................................ 55
Figure 16: Groundwater level hydrograph for Caroline Heights in the Omaha Waitematā
aquifer. Red line indicates sea level (0.0m RL). ................................................................. 56

Figure 17: Water meter readings from a groundwater take near the Caroline Heights
groundwater monitoring site............................................................................................... 56
Figure 18: Groundwater level hydrograph for Waiwera Beachfront deep in the Waiwera
geothermal aquifer. ............................................................................................................ 57
Figure 19: Thermal image of Waiwera beachfront showing thermal water emanating from
springs and fissures in the seabed and from overflowing geothermal wells via a stormwater
outfall. Taken 13/10/2019. ................................................................................................. 58
Figure 20: Hydrograph of groundwater levels in the Parakai geothermal aquifer. ............. 59
Figure 21: Water use record for one water take from the Parakai Geothermal aquifer. ..... 60
Figure 22: Groundwater level hydrograph for Rimmer Road in the Kaipara Sand aquifer. 61
Figure 23: Groundwater level hydrograph for Selaks Bore in the Kumeu East Waitematā
aquifer. ............................................................................................................................... 62
Figure 24: Groundwater level hydrograph for Short Road in the Kumeu East Waitematā
aquifer. Red line indicates sea level (0.0m RL). ................................................................. 63
Figure 25: Groundwater level hydrograph at the Selkirk Road monitoring bore in the
Western Springs volcanic aquifer. ..................................................................................... 64
Figure 26: Groundwater level hydrograph for Orakau Ave in the Onehunga volcanic
aquifer. ............................................................................................................................... 65
Figure 27: Groundwater level hydrograph for Alfred Street in the Onehunga volcanic
aquifer. ............................................................................................................................... 66
Figure 28: Groundwater level hydrograph for Burnside Road, Clevedon East Waitematā
aquifer. ............................................................................................................................... 67
Figure 29: Groundwater level hydrograph for Seagrove Road, Waiau Pa Waitematā
aquifer. ............................................................................................................................... 68
Figure 30: Groundwater level hydrograph for Diver Road in the Glenbrook Kaawa aquifer.
........................................................................................................................................... 69

List of tables

Table 1: Trends reported as environmentally meaningful by Kalbus et al. 2017. ............... 23
Table 2: Trend categories by probability and colour code.................................................. 25
Table 3: Comparison of mean annual rainfall totals to the 20-year mean for each sub-
regional group. Cells highlighted orange are less than the long-term 25th percentile, blue
highlighted cells are greater than the 75th percentile. Red text is the lowest annual rainfall
total in the period 2000-2019, purple text is the highest. ................................................... 28
Table 4: Comparison of the number of high flow events (3XMedian flow) for full record, 10-
year, and 5-year periods. ................................................................................................... 29
Table 5: Comparison of the 7-day mean annual low flow for full record, 10-year, and 5-year
periods. Highlighted rows indicate a reduction in MALF of more than 15% between the last
10 and 5 years of analysis. ................................................................................................ 32
Table 6: Trends in annual low flows with very likely probability (>0.9). .............................. 34
Rainfall, river flow, and groundwater level state and trends in Tāmaki Makaurau / Auckland 2010-2019                                    9

Table 7: Trend analysis of days below the 7-day mean annual low flow. .......................... 35
Table 8: Days below the AUP minimum flow for monitored AUP minimum flow sites. ....... 36
Table 9: Comparison of median groundwater level for three periods of analysis: current
state 2015-2019, 2010-2019, and the full record. All values in metres above sea level,
NZVD 2016. ....................................................................................................................... 37
Table 10: Trends in mean monthly groundwater level with very likely probability (>0.9).... 39
Table 11: Sites with very likely trend results for annual maximum groundwater level over
the period 2010-2019. ........................................................................................................ 40
Table 12: Sites with very likely trend results for annual maximum groundwater level over
the period 2010-2019. ........................................................................................................ 42
Table 13: Dominant land cover by trend category for annual high stream flows assessment
(land cover data source: LCDB v5.0) ................................................................................. 47
Table 14: Dominant land cover by trend category for annual low stream flows (land cover
data source: LCDB v5.0).................................................................................................... 48
Table 15: List of groundwater sites with obvious pumping effects or changes in trend
direction. ............................................................................................................................ 50
Table 16: Comparison of trend results for mean monthly groundwater level between 2006-
2015 and 2010-2019 (only includes sites analysed in both reports). Highlighted rows
indicate a change in trend direction between 2006-2015 and 2010-2019. ......................... 51
Table 17: Recommendations for additional wells for the SOE groundwater monitoring
programme, including reinstated and new wells. ............................................................... 74
10                      Rainfall, river flow, and groundwater level state and trends in Auckland 2010-2019

1 Introduction

The Auckland region has an estimated 19,000km of permanent rivers and streams and
many productive aquifers. Surface water and groundwater are vital sources for both
municipal supply and agricultural water use, including livestock drinking, rural domestic
supply, and irrigation of valuable crops. It is recognised that the contribution of groundwater
irrigation to the New Zealand economy is significant (estimated at $2 billion per annum)
(Corong et al. 2014). The combined surface and groundwater use in the Auckland region
was estimated at approximately 10% of the national average and the 12th out of 15 regions
analysed in magnitude of use (Booker and Henderson 2019). However, Auckland was 6th in
the nation for the number of groundwater take consents in 2010, the start of the period of
analysis for this report (Aqualink, 2010). The Auckland region supports a nationally
significant horticulture industry in the Franklin area (Crowcroft and Smaill 2001, Deloitte
2018) and other areas like the Okahukura Peninsula are experiencing increasing
horticultural development, which require water sourced from streams or aquifers.
The purpose of this report is to assess stream flows and aquifer groundwater levels for
changes or patterns over time and aid the understanding of how those changes may affect
the long-term sustainability of Auckland’s water supply resources.

1.1 National and regional directives
The National Policy Statement for Freshwater Management (NPS-FM) sets requirements
for regional councils to protect freshwater ecosystems and provides additional direction for
local decision-making under the Resource Management Act 1991 (RMA). These
requirements include management of discharges, water supply and allocation, and land use.
The data collected and analysed via the State of the Environment (SOE) groundwater
network directly informs the objectives, policies, and rules that govern water allocation in the
Auckland region.
Section 35 of the RMA requires regional councils to report on the effectiveness of plans in
achieving objectives set for resource management. A key component to this is to identify
any relevant trends in hydrological indices that relate to council management objectives, to
determine whether the rules governing resource use are enabling these objectives to be
achieved.
The Auckland Unitary Plan (OP) specifies several objectives for the management of
freshwater resources, including:
•    Water in rivers and aquifers is available for use provided the natural values of water are
     maintained and established limits are not exceeded.
•    Water resources are managed within limits to meet current and future water needs for
     social, cultural, and economic purposes.
•    Freshwater resources available for use are managed and allocated in order of priority to
     provide for domestic and municipal water supplies, animals, and economic development.
Rainfall, river flow, and groundwater level state and trends in Tāmaki Makaurau / Auckland 2010-2019 11
• Water resources are managed to maximise the efficient allocation and efficient use of
available water.
Policies specific to streams:
• Minimum flows in rivers and streams are established to protect instream ecological
values.
• Flow variability is maintained in rivers, streams, and springs.
Policies specific to aquifers:
• Maintain baseflow to connected streams.
• Avoid subsidence.
• Avoid saltwater intrusion.
This report addresses the state and trends observed in rainfall, river flows, and groundwater
levels to compare against past analyses and to aid the assessment of environmental
outcomes against management objectives. As part of an ongoing State of the Environment
programme, this report will provide a comparison point for past and future reporting to track
environmental change.
1.2 Auckland streams
Auckland has a diverse range of streams from small spring-fed streams in urban catchments
to large rivers in rural areas. Many Auckland streams have small catchments with a short
distance to the sea. The connection to groundwater systems also varies considerably, from
high-baseflow spring-fed streams in volcanic geology, to low-baseflow streams in
allochthonous marine-derived sediments.
Streams in urban centres tend to show ‘flashy’ characteristics due to the high percentage of
impervious cover causing high stormwater runoff. Spring-fed streams sourced from volcanic
aquifers tend to be very stable, or ‘flat’ throughout the year due to consistently high
groundwater baseflow. Other streams show variations in flow patterns between these
extremes, which are governed by topography, land use, geology, and other related factors
(assuming climate is similar across all catchments).
Water takes from streams have immediate impacts on flow that can be quickly seen in the
field and on hydrographs (charts of water level or flow over time). Taking water from a stream
results in an instantaneous reduction in flow. This is important to consider because aquatic
plant and animal communities rely on the amount of flow in a stream. Changes in flow have
impacts on depths and velocities in a stream, which in turn have effects on instream biota
that rely on those physical habitat characteristics (Jowett et al. 2005). A reduction in flow
can cause a reduction in the amount of habitat for flow demanding species, so the flow at
any given point in time is important for the management of streams to protect stream
ecology. This is particularly applicable to low flows. Physical water quality characteristics
are also affected by low flows, including temperature and dissolved oxygen, which impact
on instream biota. This report presents trends in stream flows for both high and low flow
conditions.12 Rainfall, river flow, and groundwater level state and trends in Auckland 2010-2019 1.3 Auckland aquifers Aquifers are formations of sediments or rock that are saturated and sufficiently permeable to transmit an economic quantity of water (Fetter, 2001). Groundwater is water that is held within the pores between grains of sand and rock or cracks in rocks underground below the water table. Connections between the pore spaces and cracks allow water to flow through the material. Aquifers with many well-connected pores or cracks have more flow and are more useful to us as a source of water. The Auckland region does not have many large rivers, so the availability of surface water for abstraction is more limited in Auckland than other regions of New Zealand. Many areas of Auckland use groundwater for domestic water supply, stock drinking water, and irrigation. Groundwater provides an essential part of the freshwater resource for the region. Groundwater takes use wells to pump water from 10s to 100s of metres below ground for various uses including irrigation of crops and drinking water. Aquifer characteristics like porosity and fracturing influence the degree to which groundwater levels react to pumping a groundwater well. This means that the effects of taking water from aquifers are highly variable in the magnitude, extent, and timing of the impacts. This often results in delayed impacts from groundwater takes than can range from hours to years and spread over many hundreds of metres. Taking groundwater can also have impacts on streams by reducing baseflow, which is groundwater that normally discharges into the streambed. The degree of impacts on baseflow is again related to the physical properties of aquifers. The limits on water availability from aquifers are intended to ensure that baseflow to streams is maintained. Groundwater level trends can be an analogue for baseflow to streams, e.g. decreases in groundwater levels could indicate a reduction in baseflow. This report addresses trends in monthly groundwater levels and annual maximum and minimum groundwater levels. 1.4 State of the Environment report series This report has been produced concurrently with several others pertaining to the freshwater and marine environments in the Auckland region, including: • Auckland river water quality: annual reporting and National Policy Statement for Freshwater Management current state assessment, 2019 – TR2021/11 • Coastal and estuarine water quality 2019 annual report – TR2020/016 • Coastal and estuarine water quality state and trends in Tāmaki Makaurau / Auckland 2010-2019. State of the environment reporting – TR2021/02 • Groundwater quality state and trends in Tāmaki Makaurau / Auckland 2010-2019. State of the environment reporting – TR2021/03 • Lake water quality state and trends in Tāmaki Makaurau / Auckland 2010-2019. State of the environment reporting – TR2021/04
Rainfall, river flow, and groundwater level state and trends in Tāmaki Makaurau / Auckland 2010-2019                 13

    • Marine ecology state and trends in Tāmaki Makaurau / Auckland to 2019. State of
      the environment reporting – TR2021/091
    • Marine sediment contaminant state and trends in Tāmaki Makaurau / Auckland
      2004-2019. State of the environment reporting – TR2021/101
    • River ecology state and trends in Tāmaki Makaurau / Auckland 2010-2019. State of
      the environment reporting – TR2021/05
    • River water quality state and trends in Tāmaki Makaurau / Auckland 2010-2019.
      State of the environment reporting – TR2021/07

The authors in this series have worked collectively to analyse state and trend data over the
same period (2010-2019). This is a new approach adopted by the Research and Evaluation
Unit (RIMU) and aims to better identify potential linkages between disciplines and inform the
overall State of the Environment five-yearly reporting in a more consistent manner.
All related reports (past and present) are available on Auckland Council’s Knowledge
Auckland website: www.knowledgeauckland.org.nz. Time series data used in this report are
available for download at https://evironmentauckland.org.nz.
Specific data requests, further enquiries, and requests for summary analysis outputs from
this report (Excel format) can be directed to environmentaldata@aucklandcouncil.govt.nz.

1Analyses for coastal benthic ecology and coastal sediment contaminants were completed for all data on record, not
2010-2019 as with the rest of the series.
14 Rainfall, river flow, and groundwater level state and trends in Auckland 2010-2019 2 Methods Auckland Council collects data on rainfall depth, river flows, and groundwater levels to inform a wide variety of council programmes, community initiatives, and general interest. The data are published in Environment Auckland, the data portal maintained by council’s Research and Evaluation Unit (RIMU): www.environmentauckland.govt.nz. These data form time series that can be analysed for trends to indicate environmental changes. This report presents surface water and groundwater level trends for the calendar year period 2010- 2019, inclusive. 2.1 Rainfall 2.1.1 Monitoring network Rainfall is a key metric in the assessment of water resources of the region as it is the source of freshwater to rivers and aquifers. Auckland Council currently operates 78 rain gauges across the region. This analysis used records from 54 sites that had greater than 20 years of data (Appendix 1). The rainfall sites were grouped into five sub-regional areas for reporting: North, Central, West, East, and South (Figure 1). The sub-regional grouping was solely based on location, however land use differences between the sub-regional groups are apparent. Most notably, the Central group includes most of the Auckland urban area, while the other groups are predominantly rural. North and South groups comprise most of the region’s productive rural land and East and West are representative of large forest parks in the Waitakere and Hunua ranges. Rainfall records were transformed to a monthly time series based on a 30-day total rainfall depth. The mean annual rainfall total was calculated for each sub-regional group. Long-term mean and interquartile range (IQR) were calculated for the 20-year period 2000- 2019. These long-term statistics were used to compare the annual rainfall totals for the reporting period (2010-2019) within each sub-regional group. The difference between the annual total and the long-term mean and IQR was used to indicate a dry/normal/wet condition for the year and sub-region. Trend analysis was run on the monthly rainfall total time series for each sub-region for the period 2010-2019.
Rainfall, river flow, and groundwater level state and trends in Tāmaki Makaurau / Auckland 2010-2019   15

Figure 1: Auckland Council rainfall monitoring site locations, grouped by sub-regional area.
16                    Rainfall, river flow, and groundwater level state and trends in Auckland 2010-2019

2.2 Streams
2.2.1   Monitoring network
This report assesses flow data from 39 telemetered stream flow monitoring sites in the
region (Figure 2). The sites are distributed throughout catchments with land cover ranging
from rural to urban and inform both resource management and flood management initiatives.
Flow monitoring sites cover a range of catchment sizes, from 1km2 to 276km2. The median
catchment size monitored in the network is approximately 11km2. Fifteen of the 39 sites
monitor catchment areas less than 5km2, demonstrating the relatively small size of many
Auckland streams. Council has monitored stream flow at 26 of the 39 sites for 20 years or
more, which is 67% of the stream network analysed in this report. Site details are provided
in Appendix 2.
Rainfall, river flow, and groundwater level state and trends in Tāmaki Makaurau / Auckland 2010-2019   17

Figure 2: Auckland Council State of the Environment stream flow monitoring site locations.

2.2.2    Annual stream high flows
High flows have impacts on instream ecology primarily through disturbance-related changes
to physical habitat, but also through changes to water quality via increased sedimentation,
entrainment of contaminants washed from the land surface, and dilution of contaminants
from point-source discharges. Physical disturbance of stream channels is necessary to
18                      Rainfall, river flow, and groundwater level state and trends in Auckland 2010-2019

maintain physical habitat variability and to flush systems of nuisance algae and
macrophytes.
The frequency of occurrence of high flows has been shown to be an ecologically significant
metric with which to classify high flow regimes of New Zealand streams. Three-times the
median flow was found to approximate bed-disturbance flows, thus constituting a change to
physical habitats in a river (Clausen and Biggs, 1997). The number of times that three times
the median flow (3XMedian) occurs is known as the FRE3. This metric describes the number
of times per year that high flow events disturb instream biota and is a metric commonly used
in New Zealand (MfE, 1998). Each stream has unique characteristics which govern flood
flows and their ability to disturb instream biota, but 3XMedian provides a useful
approximation of this level of disturbance that can be used to analyse many streams without
the need for detailed, long-term, and costly field work.
The number of times per year that a flow of 3XMedian occurs is a useful way to estimate
the number of channel scour events that ‘reset’ the physical habitat of streams. Some
streams flood often, so the physical habitat is changed often. Others have a more stable
flow regime with less frequent high flows so habitat is not changed very often. These different
stream types will naturally be colonised by a unique assemblage of organisms that are well
adapted to that unique environment (Clausen and Biggs, 1997). It follows that a change in
high flow statistics like the FRE3 over time indicates that the unique high flow environment
of a stream is changing. This could in turn impact the unique group of organisms that inhabit
the stream.
FRE3 was selected for trend analysis to investigate if recent urbanisation in parts of Auckland
led to changes in the high flow regimes of streams. Increased runoff due to increased
impervious surface of urban land cover can occur if water sensitive design isn’t adequately
incorporated into the built environment.
The state of high flows was reported by comparing the FRE3 across three periods: five-year
(2015-2019, the ‘current state’), 10-year (2010-2019), and the long-term record, (all years).
Trend analysis was run using the Mann-Kendall trend test on the FRE3 dataset (2010-2019)
to determine if the high flow component of the flow regime changed over the reporting period.

2.2.3   Annual stream low flows
Many native fish species in New Zealand have lifespans of multiple years and reproduce
annually, so periodic low flows are important to quantify in relation to fish life histories. Flows
represented by the mean annual low flow, or MALF (with a return period of approximately
two years) are likely to impact fish populations at some point in their lifespan (McDowall
2000). The MALF is thus a limiting factor on the instream life that a stream can sustain
(Jowett, 1990; Clausen and Biggs, 1997; Jowett et al. 2005; Booker & Graynoth 20081 & 2).
The natural flow of a river can be significantly affected by water takes, particularly during the
dry months of the year when flows are typically at their lowest. Water takes have been found
to cause significant reductions in key statistics like the MALF (Wilding 2018).
Rainfall, river flow, and groundwater level state and trends in Tāmaki Makaurau / Auckland 2010-2019                   19

Council allocates and manages water takes from streams based on the MALF. This metric
has ecological significance and is easy to apply in a water allocation framework (Franklin et
al. 2012). The MALF is calculated by averaging the lowest seven-day rolling mean flow for
each year on record 2. MALF represents the typical lowest flows in a river system for the
year, usually observed during late summer.
An analysis of the lowest flows of each year was completed to identify any changes in low-
flow hydrology. A dataset was compiled which contains the lowest seven-day rolling mean
flow for each of the last 10 years for all sites with continuous flow records. Trend analysis
was run using the Mann-Kendall test on the annual low flow datasets (2010-2019) to show
whether annual low flows were getting higher or lower over time.
State was reported by comparing the MALF of the last five years (2015-2019, the ‘current
state’) to the MALF of the last 10 years and the long-term MALF (all years).

2.2.4     Statutory minimum flows
Minimum flows are established in Appendix 2 of the Auckland Unitary Plan (AUP) to limit the
cumulative impact of multiple surface water takes when streamflow is very low and
ecosystems, particularly fish, are at their most vulnerable. The AUP Appendix 2 can be read
online at https://unitaryplan.aucklandcouncil.govt.nz. Minimum flow conditions require water
takes to cease when the flow in a stream drops below the minimum flow. The intended result
is that streams revert to natural flows during these periods of water stress. The cessation of
water takes will not always prevent a stream from naturally receding below the minimum
flow. However, cessation of takes at least provides a greater opportunity for instream biota
to survive until flows increase. The frequency of minimum flows can give an indication of the
severity of impact on water users each year. Because the AUP sets the minimum flow as a
proportion of the mean annual low flow (MALF), the number of days below the long-term
MALF was also analysed for context.
Analysis of low flow duration was completed for council monitored sites that also have a
minimum flow established in AUP Appendix 2. The sites included in this analysis were:
•    Mahurangi River at Argonaut
•    Wairoa River at Tourist Road
•    Puhinui Stream at Drop Structure
•    Ngakoroa Stream at Mill Road
•    Waitangi Stream at SH1

Trend analysis was run using the Mann-Kendall test on the total number of days below the
MALF and the minimum flow per year, respectively. This analysis showed if there were any
trends in the number of days that flows were below the minimum flow.

2This process does not include the addition of water takes back into the flow record, known as “naturalisation”. The
naturalised MALF is often used for flow setting where the flow regime is significantly affected by water takes.
20                     Rainfall, river flow, and groundwater level state and trends in Auckland 2010-2019

2.3 Aquifers
2.3.1    Monitoring network
Council currently operates 56 monitoring wells in the region, which includes 40 wells that
are dipped manually each month and 16 wells that are equipped for automatic groundwater
level recording and telemetry. The aquifer types represented in the region include weakly
cemented sands, basaltic volcanics, shell beds of the Kaawa formation, sandstones of the
Waitemata Group, geothermal centres, and greywacke basement rocks of the Waipapa
Group. Monitoring wells measure groundwater levels in 27 of the 121 aquifer management
areas (AMAs) across the Auckland region. This report details analysis of 47 of the 56
monitoring wells that had sufficiently complete datasets (Figure 3). Site details are provided
in Appendix 3.

2.3.2    Groundwater level analysis
Groundwater level data were analysed in three ways to examine the data for trends and
possible connections to anthropogenic and environmental influences. The groundwater level
records were first averaged to produce 30-day mean datasets. This averaging accomplishes
several functions:
•    Produces a smoothed dataset that removes short-term and localised influences (e.g.
     from abstraction) which is representative of longer-term, larger-scale aquifer dynamics.
•    Produces an even time-step with records that have varying data recording frequencies,
     i.e. monthly manual dips and 15-min automatic telemetered data.
•    Produces a dataset that is easily analysed by statistical applications.

Three aspects of groundwater levels were analysed in this report. The entire 30-day mean
water level dataset, the annual maximum (based on the 30-day mean dataset), and the
annual minimum (based on the 30-day mean dataset).
The 30-day mean monthly dataset characterises the full year of aquifer water levels. This
dataset is seasonal, with high water levels in the winter/spring, followed by lower water levels
in the summer/autumn.
The annual maximum groundwater level (30-day mean) was isolated for analysis to serve
as a proxy for the annual recharge, i.e. the highest water level of the year can be used as in
indicator for the level of recharge to the aquifer. While not a perfect description of aquifer
dynamics, this provides a useful way to assess how water levels rebound after the driest
parts of the year. In this analysis, only the highest water level for each year was used.
Changes to annual highs could indicate a change in the amount of water recharging the
aquifer or could indicate a change in aquifer storage (e.g. a decrease in storage due to
excessive groundwater abstraction). The results of this analysis are helpful to direct attention
to further analysis of aquifer recharge and/or aquifer storage over time.
The annual minimum groundwater level (30-day mean) was isolated for analysis to serve as
a proxy for pressure on the groundwater resource, both environmental (to supply stream
baseflow, recharge to other connected aquifers, etc.) and anthropogenic (via groundwater
Rainfall, river flow, and groundwater level state and trends in Tāmaki Makaurau / Auckland 2010-2019 21 abstraction). While not a perfect description of aquifer dynamics, this provides a useful way to assess how water levels are drawn down during the driest parts of the year, which also coincides with the highest demand for groundwater abstraction. In this analysis, only the lowest water level value for each year was used. Changes to the annual low water level could indicate a change in the amount of water discharging from the aquifer, or a change in the annual recharge. The results of this analysis are helpful to direct attention to further analysis of abstractive water use and/or aquifer recharge over time. Where decreasing trends were observed in groundwater level records, hydrographs were inspected for patterns to better describe the trend. The effects of groundwater abstraction were discussed in context of trend analysis to better contextualise the results and implications for water resource management.
22             Rainfall, river flow, and groundwater level state and trends in Auckland 2010-2019

     Figure 3: Auckland Council State of the Environment monitoring well locations.
Rainfall, river flow, and groundwater level state and trends in Tāmaki Makaurau / Auckland 2010-2019 23 2.4 Trend tests 2.4.1 Previous state of the environment trend analyses Statistical trend analysis for surface water hydrology has not yet been reported for Auckland streams under the State of the Environment programme. Comparative analysis for streams has been completed in previous reports (Stansfield and Holwerda 2015), e.g. comparison of number of days below minimum flow in 2013 vs 2012. Water level trend analysis was completed for the groundwater monitoring network in 2017 using data for the period 2006-2015, inclusive (Kalbus, et al. 2017). Groundwater level trends were reported as ‘environmentally meaningful’ if they were both statistically significant at p
24                        Rainfall, river flow, and groundwater level state and trends in Auckland 2010-2019

                                                                                              2017 trend
                                                                                              magnitude
                              Site                                              2017 trend
 Site name                                 Aquifer                                            (Sen
                              number                                            direction
                                                                                              slope,
                                                                                              m/yr)

 Nick Johnstone Drive         6479007      Waiheke West greywacke               Increasing    0.211

 Mt Richmond                  6494001      Mt Richmond volcanic                 Increasing    0.123

 Selwyn Street                6497011      Onehunga volcanic                    Increasing    0.003

 Angle Street                 6498003      Mt Wellington volcanic               Increasing    0.017

 Lambie Drive (Puhinui)       6498035      Manukau City Waitematā               Increasing    0.079

 Oneroa Bowling Club 29m      6570003      Waiheke West greywacke               Increasing    0.104

 Oneroa Bowling Club 54m      6570005      Waiheke West greywacke               Increasing    0.228

 Oneroa Church 39.5m          6570009      Waiheke West greywacke               Increasing    0.080

 View Road                    6570011      Waiheke Central West greywacke       Increasing    0.129

 Mako Road                    6570013      Waiheke West greywacke               Increasing    0.042

 Tuhimata Road                7419003      Pukekohe Kaawa                       Increasing    0.043

 Cooper Road                  7419011      Bombay-Drury Kaawa                   Increasing    0.196

 Pukekohe DSIR                7428043      Pukekohe central volcanic            Increasing    0.069

 Rifle Range Deep             7428103      Pukekohe central volcanic            Increasing    0.260

 Rifle Range Shallow          7428105      Pukekohe central volcanic            Increasing    0.173

 Jenkin Road                  7428109      Pukekohe central volcanic            Increasing    0.193

 Douglas Road                 7429013      Pukekohe central volcanic            Increasing    0.058

 Clevedon Rd                  7500001      Clevedon East Waitematā              Increasing    0.074

 Wooten Road                  7510005      Bombay volcanic                      Increasing    0.096

2.4.2    Trend analysis for 2010-2019
All trend analyses for this report were completed using TimeTrends v6.4 software. Trends
in the 30-day mean groundwater level were analysed using the Seasonal Kendall test
applied to four seasons. The seasonal test was applied because this dataset had a seasonal
pattern of water levels reflective of seasonal rainfall recharge. The Mann-Kendall test was
used for all other datasets, which had a single statistic per year, thus no seasonality. Sites
were excluded from mean monthly groundwater analysis if the number of data points was
less than 36 (90% of 40 total seasonal values from 2010-2019). Sites were excluded from
all other analyses if the number of data points was less than 10.
Trends were assessed based on the direction (increasing or decreasing) and magnitude of
change. The trend direction and confidence were calculated using the Kendall test (seasonal
and non-seasonal) based on the probability of the trend. The probability derived from the
Rainfall, river flow, and groundwater level state and trends in Tāmaki Makaurau / Auckland 2010-2019 25
Kendall test was interpreted based on the categories used by the Intergovernmental Panel
on Climate Change which was simplified into five categories by Fraser and Snelder (2018)
(Table 2). The categories are used for national-level environmental reporting in New Zealand
by Land Air Water Aotearoa (LAWA).
Table 2: Trend categories by probability and colour code.
Trend categories Probability (%)
Very likely increasing 90-100 (with positive Kendall S)
likely increasing 67-90 (with positive Kendall S)
Indeterminate 0-67
Likely decreasing 67-90 (with negative Kendall S)
Very likely decreasing 90-100 (with negative Kendall S)
The magnitude of the trend is characterised by the slope of the trend line using the Sen
slope estimator (SSE) (or the seasonal version (SSSE)). The SSE is the median of all
possible inter-observation slopes. Some trends, though statistically valid, may have a Sen
slope less than the margin of error associated with various data collection techniques, so
the rate of change cannot be reported with confidence. Trend magnitude can only be
estimated with confidence for very likely trends (probability exceeding 0.9).
Trend magnitude was assessed in this report relative to the measurement precision for each
parameter following the approach in Fraser and Snelder (2018). Trends were considered to
be established with confidence if the trend was very likely (probability >0.9) and:
• Median Sen slope exceeded the measurement accuracy of:
o Streams: 8% of measured discharge or 0.001 m3/s, whichever is higher.
o Groundwater: 0.02 m (positive or negative).
For groundwater, water level measurements are recorded by both manual measurement
and using automatic recording methods. Sites with automatic water level recorders are
calibrated by field measurements to within 0.020 m.
For streams, the calculated flow is based on continuous water level measurements that are
fitted to a rating which calculates flow based on water level, known as the ‘rated flow’. Flow
ratings are continually updated based on measured flow in the field to ensure that the
calculated flow via the rating accurately matches the true flow of the stream. The
requirement for continuous flow records is that the rated flow is within 8% of measured flow.
However, small streams frequently have very low flows, which are difficult to measure
accurately in the field. A review of the gauging files of Auckland streams showed that for
telemetered sites with ratings, the measured flow frequently exceeded 20% error when flow
was less than 10 l/s. Not all gaugings at very low flows have large errors against the rating,
but the preponderance of large errors at low flows requires a pragmatic criterion for trend26 Rainfall, river flow, and groundwater level state and trends in Auckland 2010-2019 assessment. For this reason, a conservative threshold of 1 l/s (0.001 m3/s) was applied as a second criteria for stream flows. Thus, a trend with a Sen slope greater than 8% of the lowest flow in the dataset but less than 0.001 would fail to be established with confidence.
Rainfall, river flow, and groundwater level state and trends in Tāmaki Makaurau / Auckland 2010-2019                                                                                                        27

3 Results: Rainfall

3.1                                       State and trends
The mean annual rainfall total was compared to the long-term mean for each sub-regional
group by plotting the departure from the mean (Figure 4). This highlighted years with greater
or less rainfall that are difficult to discern from hydrographs alone.
The lowest mean annual total in the 20-year long-term record was measured in the North in
2019 and Central in 2010. The highest long-term mean annual rainfall total was recorded
the following year (2011) in all the sub-regional groups, excluding the East. Rainfall was
consistently high for all five areas in the years 2016-2018 and the East recorded a long-term
maximum in 2017. Annual statistics by year and sub-regional area are provided in Table 3.
No monotonic trends could be established with confidence for the sub-regional monthly
rainfall totals over the period of analysis (2010-2019). The probability of trends was less
than 0.9 and the Sen slope was less than 1mm/year for all five sub-regional areas. This is
consistent with the pattern in rainfall observed in the deviation from the long-term mean,
which indicates the reporting period had very wet years (2011, 2016-2018) and very dry
years (2010 and 2019) with no consistent trend in one direction.

                                       800

                                       600
  Deviation from long term mean (mm)

                                       400
                                                                                                                                                                                          North - 8 sites
                                                                                                                                                                                          Central - 37 sites
                                       200
                                                                                                                                                                                          West - 6 sites
                                                                                                                                                                                          East - 2 sites
                                         0
                                                                                                                                                                                          South - 4 sites

                                       -200

                                       -400
                                              2000
                                                     2001
                                                            2002
                                                                   2003
                                                                          2004
                                                                                 2005
                                                                                        2006
                                                                                               2007
                                                                                                      2008
                                                                                                             2009
                                                                                                                    2010
                                                                                                                           2011
                                                                                                                                  2012
                                                                                                                                         2013
                                                                                                                                                2014
                                                                                                                                                       2015
                                                                                                                                                              2016
                                                                                                                                                                     2017
                                                                                                                                                                            2018
                                                                                                                                                                                   2019

Figure 4: Rainfall deviation from long-term mean for rain gauge groups (average value per group).
28 Rainfall, river flow, and groundwater level state and trends in Auckland 2010-2019
Table 3: Comparison of mean annual rainfall totals to the 20-year mean for each sub-regional group. Cells
highlighted orange are less than the long-term 25th percentile, blue highlighted cells are greater than the 75th
percentile. Red text is the lowest annual rainfall total in the period 2000-2019, purple text is the highest.
2010 2011 2012 2013 2014 2015 2016 2017 2018 2019
North 1181 1651 1294 1214 1235 1111 1543 1617 1490 1075
Central 1089 1571 1205 1234 1121 1115 1304 1523 1521 1115
West 1547 2008 1720 1666 1564 1580 1754 1946 1954 1515
East 1395 1912 1460 1249 1220 1340 1666 2087 1831 1270
South 1212 1755 1328 1276 1204 1320 1460 1711 1541 1205Rainfall, river flow, and groundwater level state and trends in Tāmaki Makaurau / Auckland 2010-2019 29
4 Results: Streams
4.1 Annual high stream flows
4.1.1 State
The comparison of the median number of high flow events between the last five years (2015-
2019), the last 10 years (2010-2019) and the full record (all years) showed little variation
between the periods of analysis (Table 4). More high flow events were recorded in the last
five years than in the last 10 years at 27 sites (69%) versus 12 sites which had fewer high
flow events (31%).
The largest decrease between the last five years and the last 10 years was 5.26% at the
Waitangi Stream in Waiuku (0.5 less high flow events per year on average). The largest
increase in the number of events was from 21 to 24 events for the Whau Stream. The largest
proportional increase was 22.22% for the Kaipara River in Waimauku (2 more high flow
events per year on average).
Table 4: Comparison of the number of high flow events (3XMedian flow) for full record, 10-year, and 5-year
periods.
Last 5 Last 5
years as years as
Long-term 10-year 5-year
Site name % of 10- % of long-
median median median
year term
median median
Tamahunga Stream 15 14.5 15 103.45% 100.00%
Mahurangi River 14.5 14.5 15 103.45% 103.45%
Orewa Stream 13 10.5 10 95.24% 76.92%
West Hoe Stream 14.5 14 15 107.14% 103.45%
Vaughan Stream 16 16.5 17 103.03% 106.25%
Mairangi Bay Stream 21 21 22 104.76% 104.76%
Taiaotea Stream 20 20 19 95.00% 95.00%
Awaruku Stream 21 21.5 21 97.67% 100.00%
Taiorahi Stream 21 19 21 110.53% 100.00%
Wairau Creek at Motorway 21 21 21 100.00% 100.00%
Wairau Creek at Chartwell Rd 22 22.5 22 97.78% 100.00%
Eskdale Stream 20 21 21 100.00% 105.00%
Kaipatiki Stream 23 23 23 100.00% 100.00%
Rangitopuni River 12 9 9 100.00% 75.00%
Oteha Stream 20 21.5 23 106.98% 115.00%
Lucas Creek 21 21.5 21 97.67% 100.00%
Alexandra Stream 20 20.5 22 107.32% 110.00%
Opanuku Stream at Candia Road 17 17 17 100.00% 100.00%
Swanson Stream 18 16 16 100.00% 88.89%
Oratia Stream 20 19 20 105.26% 100.00%30 Rainfall, river flow, and groundwater level state and trends in Auckland 2010-2019
Last 5 Last 5
years as years as
Long-term 10-year 5-year
Site name % of 10- % of long-
median median median
year term
median median
Opanuku Stream at Vintage Reserve 20 20.5 20 97.56% 100.00%
Whau Stream 21 21 24 114.29% 114.29%
Motions Stream 26 25.5 25 98.04% 96.15%
Meola Stream 24 24 23 95.83% 95.83%
Newmarket Stream 19 17.5 18 102.86% 94.74%
Otara Stream 20 20.5 20 97.56% 100.00%
Tamaki Stream Tributary 20 20 20 100.00% 100.00%
Mangemangeroa Stream 15 13.5 14 103.70% 93.33%
Wairoa River 13 11.5 12 104.35% 92.31%
Mangawheau Stream 14 14 16 114.29% 114.29%
Waitangi Stream 10 9.5 9 94.74% 90.00%
Papakura Stream 15 17.5 20 114.29% 133.33%
Puhinui Stream 22 22.5 24 106.67% 109.09%
Ngakoroa Stream 14 13.5 14 103.70% 100.00%
Kaipara River 12 9 11 122.22% 91.67%
Ararimu River 12.5 10 10 100.00% 80.00%
Kaukapakapa Stream 11 10 10 100.00% 90.91%
Hoteo River 12 11.5 11 95.65% 91.67%
Waiteitei River 12 11.5 11 95.65% 91.67%
4.1.2 Trends
The Taiaotea Stream was the only stream with a very likely trend category (very likely
decreasing, median Sen slope = -0.875 events/year). The remainder of sites had trend
categories of likely decreasing (9), likely increasing (11) and indeterminate (18), but none
were established with confidence. Site location, trend direction, and trend confidence is
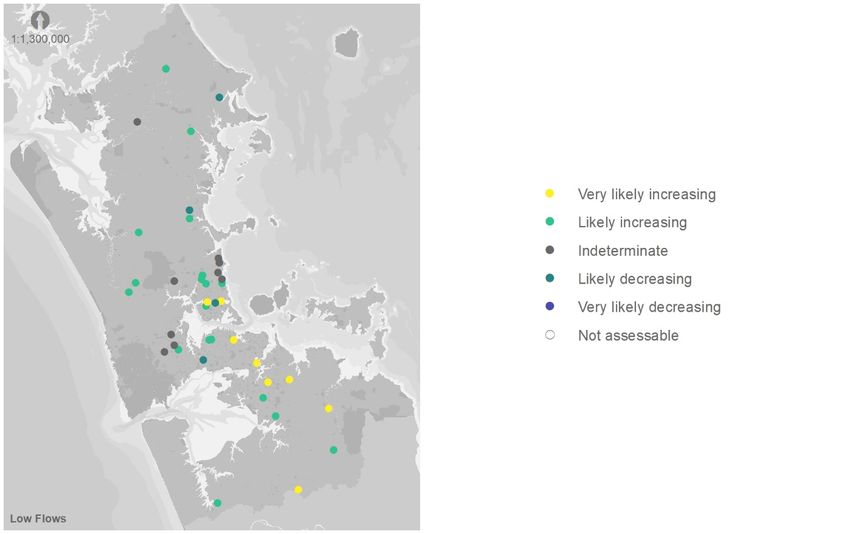
mapped for all sites in Figure 5.Rainfall, river flow, and groundwater level state and trends in Tāmaki Makaurau / Auckland 2010-2019 31 Figure 5: Trend results for the annual frequency of high stream flows (>3XMedian) over the period 2010-2019. 4.2 Annual low stream flows 4.2.1 State of annual low flow magnitude The comparison of the MALF between the last five years (2015-2019), the last 10 years (2010-2019), and the full record (all years) showed consistently higher flows in recent years than later years (Table 5). Thirty-two of the 39 sites had higher MALFs for the last five years than the last 10 years (82%). A threshold of 85% MALF was used to identify sites where a reduction in the MALF may have impacts on instream biota. This threshold is necessarily arbitrary because it does not relate to specific flow management objectives for each river. However, the 85% threshold relates to default minimum flow guidelines established in Appendix 2 of the Auckland Unitary Plan, so a change beyond the threshold indicates that the generalised flow management objectives of the AUP may not be achieved. Two sites had MALF values in the last five years that were less than 85% of the previous 10-year MALF: Wairau Creek (at the Chartwell Road site) and the Rangitopuni Stream. These two sites are discussed further in Section 5.2.
You can also read