2019-2021 COMMUNITY HEALTH NEEDS ASSESSMENT
←
→
Page content transcription
If your browser does not render page correctly, please read the page content below

Fulton County
                                                                                            Public Health Department

   2019-2021 COMMUNITY
   HEALTH NEEDS ASSESSMENT
   Community Service Plan/Community Health Improvement Plan

Service Area: Nathan Littauer Hospital Service Region & Fulton County

   Nathan Littauer Hospital & Nursing Home                                 Fulton County Public Health Department
   99 East. St.                                                            2714 State Highway 29, PO BOX 415
   Gloversville, NY 12078                                                  Johnstown, NY 12095
   Tammy Merendo, RN                                                       Laurel Headwell
   Director of Community Education                                         Public Health Director
   Main Phone: 518-736-1120                                                Main Phone: 518-736-5720
   www.nlh.org                                                             www.fultoncountyny.gov

     Prepared by: Bassett Research Institute’s Mohawk Valley Population Health Improvement Program, 1 Atwell Rd., Cooperstown, NY 13326
2019-2021 COMMUNITY HEALTH NEEDS ASSESSMENT

TABLE OF CONTENTS:
Executive Summary…………………………………………………………………………………………………………. 2
A. INTRODUCTION…………………………………………………………………………………………………......... 3
   a. Hospital Service Area……………………………………………………………………………………………. 3
   b. County Health Department Description……………………………………………………………….. 5

B. COMMUNITY HEALTH ASSESSMENT…………………………………………………………………………. 5
   1. Community Description……………………………………………………………………………………….. 5
      a. Demographics…………………………………………………………………………………………………. 6
      b. Health Status…………………………………………………………………………………………………… 13
   2. Main Health Challenges……………………………………………………………………………………….. 19
      a. Behavioral Risk Factors………………………………………………………………………………….. 22
      b. Environmental Risk Factors……………………………………………………………………………. 31
      c. Socioeconomic Risk Factors…………………………………………………………………………… 34
      d. Policy Environment……………………………………………………………………………………….. 38
      e. Other Unique Characteristics of the Community……………………………………………. 39
   3. Community Assets and Resources………………………………………………………………………… 39
   4. Prior Topics from Preceding Community Health Assessment……………………………….. 41

C. COMMUNITY HEALTH IMPROVEMENT PLAN/COMMUNITY SERVICE PLAN……………….. 44
   1. Identification of Priorities…………………………………………………………………………………….. 44
   2. Priority Action Plan………………………………………………………………………………………………. 46
   3. Stakeholder Engagement……………………………………………………………………………………… 47
   4. Plan Dissemination………..…………………………………………………………………………………….. 47

                                           1
2019-2021 COMMUNITY HEALTH NEEDS ASSESSMENT
EXECUTIVE SUMMARY
The Mohawk Valley Population Health Improvement Program (MVPHIP) partnered with Fulton County Public
Health Department and Nathan Littauer Hospital & Nursing Home to complete their 2019-2021 Community
Health Needs Assessment utilizing key informant survey data compiled by Adirondack Rural Health Network.
The key informants represent a broad range of sectors, community interests, and includes organizations that
represent the medically underserved, low-income, and minority populations. In addition to the key informant
responses, the assessment includes quantitative data sources collected and published by New York State, as
well as health indicators included on the MVPHIP website compiled by Healthy Communities Institute. The
site includes a comprehensive dashboard of community indicators covering over 20 topics in the areas of
health, social determinants of health, and quality of life from public secondary data sources.
Fulton County Public Health Department and Nathan Littauer Hospital & Nursing Home also collected a small
sample of community members’ views on the health of the community. Community members were asked to
select their top three biggest health issues. Sixty-five percent felt substance use was the biggest priority,
followed by chronic diseases at fifty-seven percent, and mental health issues at forty-six percent.
Based on the key informant priority rankings and their ability to affect the chosen priorities, Fulton County
Public Health Department and Nathan Littauer Hospital & Nursing Home will collaborate on the following New
York State Prevention Agenda priorities:
Prevent Chronic Diseases
Focus Area 4: Preventive Care and Management
o Goal: In the community setting, improve self-management skills for individuals with chronic
diseases, including asthma, arthritis, cardiovascular disease, diabetes, prediabetes and obesity
o Disparity Focus: Rural residents -access to care due to limited options for public transportation
and high expense of cabs. Limited access for healthy food and childcare.
o Intervention: Expand access to evidence-based self-management interventions for individuals
with arthritis, asthma, cardiovascular disease, and diabetes
o Process Measures: Number of workshops delivered. Number of participants who complete four
of the six sessions. Number of sites/counties where workshops are delivered.
Prevent Communicable Diseases
Focus Area 5: Antimicrobial Resistance and Healthcare-Associated Infections
o Goal: Reduce inappropriate antibiotic use
o Disparity Focus: Low socioeconomic status rural residents
o Interventions: Conduct an educational campaign for the public on antimicrobial resistance and
appropriate antibiotic use
o Interventions: Healthcare clinician education and public health detailing to prescribers
o Process Measures: Number of community members encountered. Number of healthcare
clinicians encountered. Number of printed materials produced and distributed. Number of
classes offered in the community on antibiotic resistance.
2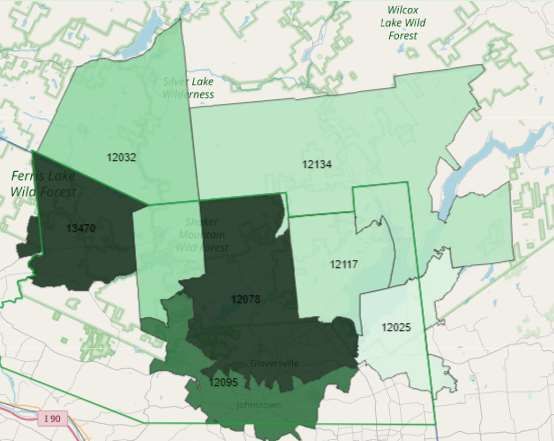
2019-2021 COMMUNITY HEALTH NEEDS ASSESSMENT

   A. INTRODUCTION

Bassett Research Institute’s Mohawk Valley Population Health Improvement Program (MVPHIP), a grant funded
program from the New York State Department of Health, provided technical assistance to Nathan Littauer
Hospital & Nursing Home and the Fulton County Public Health Department. The Community Health Needs
Assessment provides the hospital, local county health department, and key informants with data and responses
so that they may identify, prioritize, and address health care challenges facing their communities. The
Community Health Needs Assessment also supports the New York State Commissioner of Health’s mission “To
Make New York the Healthiest State for People of All Ages” and to participate in New York State Prevention
Agenda public health initiatives.
A regional group, facilitated by the Adirondack Rural Health Network (ARHN), provided the forum for area
hospitals and local health departments to take part in a regional planning process to address the Commissioner’s
public health priorities identified in the New York State Prevention Agenda toward the Healthiest State. By
participating in this public health effort, Nathan Littauer Hospital and Fulton County Public Health Department
supported the overall goals of the New York State Health Department, which are to focus on primary/secondary
disease prevention, promote access to quality health care services, and eliminate health care disparities where
they exist.
ARHN provided a forum for the various community partners to share resources and to collaborate on the
development of each county’s and hospital’s Community Health Needs Assessment. In 2019 ARHN prepared a
key informant survey to identify the needs in Essex, Fulton, Hamilton, Saratoga, Warren and Washington
counties.

    a. Hospital Service Region:
Nathan Littauer Hospital & Nursing Home (NLH), opened in 1894, is the only hospital in Fulton County. Located
in Gloversville, in the foothills of the Adirondack Mountains, NLH is a fully licensed and accredited health care
facility. NLH provides a wide array of services ranging from critical care to routine outpatient procedures. They
have a 74-bed acute care hospital, an 84-bed residential Nursing Home, a Medical Arts Building, state-of-the-
art Surgical Center and a Primary/Specialty Care Center. Additional Primary/Specialty Care Centers are located
in Broadablin, Fonda, Mayfield, Speculator, Caroga Lake, 3 in Johnstown, Perth, and 1 additional location in
Gloversville. These locations provide health care accessibility for the citizens of Fulton, Montgomery, and
southern Hamilton counties.

NLH provides a full array of inpatient and outpatient services including medical/surgical, pediatrics, obstetrics
and gynecological services, nutritional counseling, oncology/infusion therapy, patient education, diabetic
teaching, rehabilitative medicine, women’s health and respiratory care as well as CT scans, including PET and
colonoscopy, nuclear medicine procedures, and bone density testing. They added a robust gastroenterology
specialty in the past five years thereby increasing access to an underserved community. They also offer a
comprehensive orthopedic specialty and regularly conduct spine surgeries. Stereotactic breast biopsy system
and digital mammography are utilized at their facility. Dialysis treatment is available through the Gloversville
Dialysis Center, which offers patients a variety of treatment modalities including in-center hemodialysis,
Peritoneal Dialysis and home hemodialysis. The Emergency Room is open 24 hours per day and sees most of
                                                       3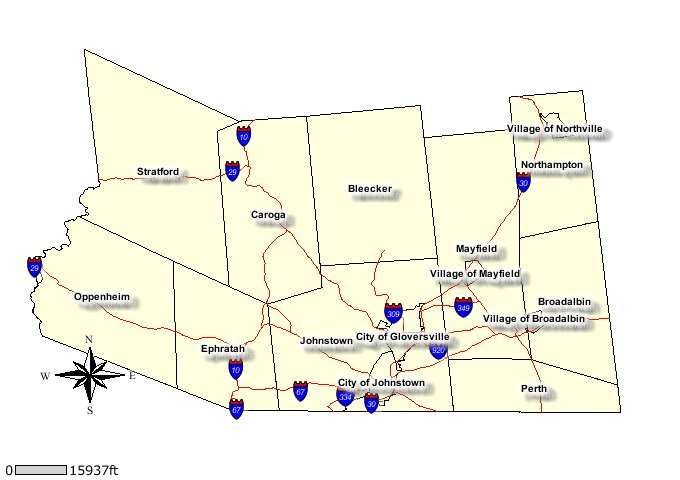
2019-2021 COMMUNITY HEALTH NEEDS ASSESSMENT

the community’s emergent cases. They employ about 1000 individuals and have 64 practitioners on staff. NLH
is the second largest employer in Fulton County.
The other programs that are supported and offered through NLH also demonstrate their service and
commitment to the community:
Lifeline, a Personal Emergency Response System, allows elderly residents and those who may be in need of
assistance the comfort and security of a 24-hour response in case of emergency.
NLH is also affiliated with Community Health Center (CHC) and Home Health Care Partners. The home health
care agencies service clients in Fulton and Montgomery counties who require short-term as well as long-term
care in the home. Additional services such as therapy, housekeeping and dietary consultation are also available.
CHC was founded through collaboration with St. Mary’s Hospital of Amsterdam. Home Health Care Partners
provides private duty nursing, sitters/companions, housekeeping services, and is affiliated with CHC.
HealthLink impacts the community by offering a myriad of free or low cost evidence-based programs and
services, and educational topics for those who want to improve their health by making lifestyle changes.
Smoking cessation, blood pressure, glucose and cholesterol screenings, childbirth preparation, and
breastfeeding are just a few of the areas covered by educators through this department.
                                  Nathan Littauer Hospital’s Service Region                   Moses-Ludington
                                                                                              Moses-Ludington Hospital
                                                                                                              Hospital

                                                12139
                                                12139
                                                               12164
                                                               12164

                                                          12108
                                                          12108
                                                                       12190
                                                                       12190

                                                  12032
                                                  12032                                      Glens
                                                                                             Glens Falls
                                                                                                   Falls Hospital
                                                                                                         Hospital
                                                                        12134
                                                                        12134

                                      13454
                                      13454

                                              13470
                                              13470
                                                                        12117
                                                                        12117
                                                            12078
                                                            12078

                                                                            12025
                                                                            12025    Saratoga
                                                                                     Saratoga Hospital
                                                                                              Hospital
                                          Nathan
                                          Nathan Littauer
                                                 Littauer Hospital
                                                          Hospital

                                                                12095
                                                                12095

                                                                            12010
                                                                            12010

The service area for Nathan Littauer Hospital is composed of thirteen zip codes in Fulton County, Southern
Hamilton County and bordering areas of Montgomery County. Historically, about eighty-eight percent of
Nathan Littauer Hospital’s in-patients reside within this geography.

                                                           4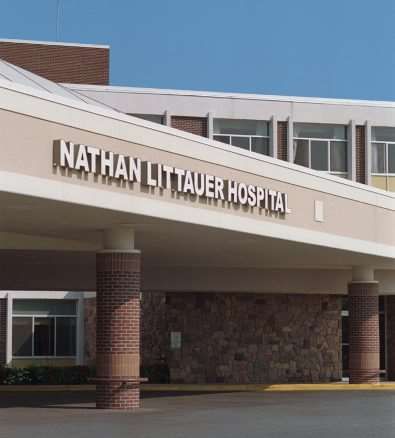
2019-2021 COMMUNITY HEALTH NEEDS ASSESSMENT

Nathan Littauer Hospital’s Primary Service Region by Zip Code, Population Counts from Claritas 2019
 Town                         Zip Code                   County                      Population
 Amsterdam                    12010                         Montgomery                  28,968
 Broadalbin                   12025                         Fulton                      5,573
 Caroga Lake                  12032                         Fulton                      492
 Gloversville                 12078                         Fulton                      22,996
 Johnstown                    12095                         Fulton                      12,243
 Lake Pleasant                12108                         Hamilton                    417
 Mayfield                     12117                         Fulton                      3,144
 Northville                   12134                         Fulton                      3,488
 Piseco                       12139                         Hamilton                    178
 Speculator                   12164                         Hamilton                    330
 Wells                        12190                         Hamilton                    576
 Salisbury Center             13454                         Herkimer                    588
 Stratford                    13470                         Fulton                      676
The total population in the service region is 79,669 persons.

    b. County Health Department Description:
The Fulton County Public Health Department (FCPH) located in Johnstown, New York, under the direction of
the Fulton County Board of Supervisors and the New York State Department of Health, seeks to promote
wellness, to protect from disease, to prevent injury/disability, to prepare for emerging illness/disease and to
assist Fulton County residents in attaining and maintaining optimal health. Each person and/or their family
will be educated in accessing health care and will be empowered to be responsible for the decisions regarding
their health care needs. Many services offered by FCPH are provided free of charge; others have eligibility
criteria and sliding fee scales are available for the uninsured.

   B. COMMUNITY HEALTH ASSESSMENT

    1. COMMUNITY DESCRIPTION
Fulton County and Nathan Littauer Hospital’s primary service region combined are the total population served.

Geography:
Nathan Littauer Hospital is located in Gloversville, Fulton County, New York. Fulton County is bordered by
Hamilton County to the north, Herkimer County to the west, Montgomery County to the south and Saratoga
County to the east. Fulton County is predominately rural and the land are in square miles is 495.47 with a
population per square mile of (112.1) compared to (411.2) for New York State and (87.4) for the United States.

Fulton County consists of 15 municipalities: the cities of Gloversville and Johnstown, the villages of Broadalbin,
Northville and Mayfield and the towns of Bleecker, Broadalbin, Caroga, Ephratah, Johnstown, Mayfield,
Northampton, Oppenheim, Perth, and Stratford. Approximately 317 square miles of Fulton County lies within
                                                        5
2019-2021 COMMUNITY HEALTH NEEDS ASSESSMENT

the Adirondack Park. The towns of Bleecker, Caroga, Northampton, and Stratford lie entirely within the Park.
The towns of Broadalbin, Ephratah, Johnstown, Mayfield and Oppenheim partially lie within the Park.

                                               Map of Fulton County

    a) Demographics:
 NLH Service Region Zip Code Level Population by Sex & Median Age, Claritas Data 2019
County            Zip Code      Town               Population    Median Age         Male          Female

Hamilton          12108        Lake Pleasant         417              56.5          49.4%          50.6%
Hamilton         12164         Speculator            330              56.4          51.2%          48.8%
Hamilton          12139        Piseco                178              53.8          48.9%          51.1%
Hamilton         12190         Wells                 576              52.1          49.1%          50.9%
Fulton            12032        Caroga Lake           492              50.0          52.4%          47.6%
Fulton            12134        Northville            3,488            48.9          50.1%          49.9%
Fulton            13470        Stratford             676              46.4          49.1%          50.9%
Fulton            12117        Mayfield              3,144            46.2          50.6%          49.4%
Fulton            12025        Broadalbin            5,573            45.8          49.9%          50.1%
Fulton            12095        Johnstown             12,243           43.4          50.2%          49.8%
Fulton            12078        Gloversville          22,996           42.8          49.0%          51.0%
Montgomery        12010        Amsterdam             28,968           41.9          48.8%          51.2%
Herkimer          13454        Salisbury Center      588              40.7          50.9%          49.2%

                               Fulton County         53,750           44.1          49.7%          50.3%
                               Mohawk Valley         255,457          43.1          49.3%          50.7%
                                                        6
2019-2021 COMMUNITY HEALTH NEEDS ASSESSMENT
Percentage of Population by Sex & Age, Claritas Data 2019
35.0
Fulton County Male Female
30.0
15.2
25.0 13.6
11.3 11.5 12.2
20.0
15.0
10.0
5.1 5.6 6.2
4.8 4.4 13.8 15.1
5.0 3.6 12.5 11.7 11.6
3.2
5.2 5.4 5.9 4.9 4.9 3.6
3.8 3.6 1.8
0.0
0-4 5-9 10-14 15-17 18-20 21-24 25-34 35-44 45-54 55-64 65-74 75-84 85+
Percentage of the population by sex and age is evenly distributed prior to age 65; then there are more females
than males.
NLH Service Region Zip Code Level Population Distribution by Race & Hispanic Origin, Claritas Data 2019
American Native
Indian/ Hawaiian Some Two or
Zip Alaskan /Pacific Other More
Code Town Pop. White Native Asian Black Islander Race Races Hispanic
13470 Stratford 676 98.4% 0.0% 0.0% 0.2% 0.0% 0.6% 0.9% 3.3%
12139 Piseco 178 97.8% 0.0% 1.1% 0.0% 0.0% 0.0% 1.1% 0.6%
12117 Mayfield 3,144 97.6% 0.2% 0.4% 0.6% 0.0% 0.2% 1.0% 1.3%
13454 Salisbury Center 588 97.3% 0.3% 0.2% 0.2% 0.0% 1.0% 1.0% 3.6%
12032 Caroga Lake 492 97.0% 0.0% 0.2% 0.0% 0.0% 0.0% 2.9% 0.4%
12108 Lake Pleasant 417 96.9% 0.5% 1.0% 0.2% 0.5% 0.0% 1.0% 1.7%
12164 Speculator 330 96.7% 0.3% 1.2% 0.6% 0.3% 0.0% 1.0% 1.8%
12134 Northville 3,488 96.6% 0.4% 0.3% 0.3% 0.2% 0.5% 1.7% 1.6%
12025 Broadalbin 5,573 96.5% 0.5% 0.7% 0.7% 0.0% 0.2% 1.4% 2.6%
12190 Wells 576 94.3% 0.0% 1.2% 2.6% 0.0% 0.4% 1.6% 2.6%
12078 Gloversville 22,996 94.0% 0.3% 0.6% 2.1% 0.0% 1.0% 2.0% 3.8%
12095 Johnstown 12,243 91.9% 0.2% 1.3% 4.1% 0.0% 1.0% 1.6% 4.1%
12010 Amsterdam 28,968 82.4% 0.6% 0.9% 3.7% 0.1% 9.0% 3.4% 22.0%
Fulton County 53,750 94.5% 0.3% 0.7% 2.1% 0.0% 0.7% 1.7% 3.3%
Mohawk Valley 255,457 93.3% 0.3% 0.9% 2.0% 0.1% 1.6% 1.9% 5.4%
The population in the Nathan Littauer Hospital’s service region is predominately white with some racial and
ethnic diversity in Amsterdam.
72019-2021 COMMUNITY HEALTH NEEDS ASSESSMENT
Immigrant/Migrant Status, U.S. Census QuickFacts 2013-2017
City of Town of City of City of Fulton Montgomery NYS US
Amsterdam Amsterdam Gloversville Johnstown County County
Percent of Foreign born 5.8 1.8 1.9 3.4 2.0 3.4 22.7 13.4
persons
Percent of Language 27.2 5.1 2.9 5.6 3.3 14.3 30.6 21.3
other than English
spoken at home of
persons age 5 years +
The City of Amsterdam has higher percentages of foreign-born persons and language other than English
spoken at home than Fulton and Montgomery counties.
NLH Service Region Zip Code Level Population Distribution by Income, Claritas Data 2019
% % Families
Owner # Families Families # Families with
Occupied- Median Below Below with Children Children
Average Home Household Poverty Poverty Below Below
Zip Code Town Total HHS Value Income Level Level Poverty Level Poverty
12025 Broadalbin 2,292 188,749 70,500 122 7.9% 109 7.1%
12139 Piseco 84 306,053 61,842 2 3.9% 2 3.9%
12164 Speculator 155 266,681 61,648 12 12.8% 4 4.3%
12108 Lake Pleasant 196 272,273 61,321 14 11.8% 5 4.2%
12117 Mayfield 1,311 182,346 59,365 78 8.6% 44 4.9%
12134 Northville 1,538 250,329 58,657 82 8.1% 42 4.1%
12095 Johnstown 4,904 144,764 54,770 229 7.5% 154 5.1%
12032 Caroga Lake 226 293,428 50,581 7 5.2% 4 2.9%
13454 Salisbury Center 217 118,360 49,392 17 11.0% 5 3.2%
12190 Wells 256 182,111 48,750 25 15.2% 11 6.7%
12010 Amsterdam 11,963 156,453 47,429 1,191 16.1% 1,025 13.9%
13470 Stratford 276 113,790 45,909 16 8.3% 4 2.1%
12078 Gloversville 9,542 137,631 43,258 1,075 18.3% 838 14.2%
Fulton County 22,022 154,095 51,027 1,737 12.3% 1,305 9.3%
Mohawk Valley 104,212 163,073 52,587 7,594 11.5% 5,769 8.7%
The owner-occupied average home values are similar or higher than the Mohawk Valley region with the
exceptions of Johnstown, Salisbury Center, Amsterdam, Stratford, and Gloversville. Six communities’ median
household incomes are lower than the Mohawk Valley region: Caroga Lake, Salisbury Center, Wells,
Amsterdam, Stratford, and Gloversville.
82019-2021 COMMUNITY HEALTH NEEDS ASSESSMENT
Computer and Internet Use, U.S. Census QuickFacts 2013-2017
City of Town of City of City of Fulton Montgomery NYS US
Amsterdam Amsterdam Gloversville Johnstown County County
Percent of Households with 79.1 86.1 79.8 90.1 83.7 81.1 86.8 87.2
a Computer
Percent of Households with 69.8 79.0 67.3 82.1 73.3 71.9 78.9 78.1
a Broadband Internet
Subscription
The percent of Fulton County households with a computer is lower than New York State and fewer households
have a broadband internet subscription with the exception of the City of Johnstown, which has a higher
percentage than New York State.
NLH Service Region Zip Code Level Education Attainment, Claritas Data 2019
Some High2019-2021 COMMUNITY HEALTH NEEDS ASSESSMENT
Percentage of Educational Attainment by Sex, Claritas Data 2019
Fulton County Male Female
45
40
35 38
35.4
30
25
20
21
19.1
15
14.5
10 11.6
11.4
4.4 9.8 9.3
5 2.5 8.2 8.4
4.5 0.8 0.7 0.4 0
02019-2021 COMMUNITY HEALTH NEEDS ASSESSMENT
Percentage of Employed Workers in Civilian Labor Force by Industry, Claritas Data 2019
Fulton County
Health Care/Social Asst 17.8
Retail Trade 16.0
Total Manufacturing 13.3
Educational Svcs 9.3
Accommodation/Food Services 6.9
Construction 6.2
Public Administration 5.9
Transport/Warehouse/Utils 5.1
Other Services, Not Public Admin 4.5
Prof/Sci/Tech/Admin 3.9
Finance/Insurance/Rent/Lse 3.0
Admin/Spprt/Waste Mgmt 2.6
Wholesale Trade 1.9
Information 1.6
Entertainment/Rec Svcs 1.1
Agriculture/Forest/Fish/Hunt 1.0
0.0 2.0 4.0 6.0 8.0 10.0 12.0 14.0 16.0 18.0 20.0
Health Care/Social Asst., Retail Trade, Manufacturing, and Education Services are the leading industries in the
county.
Percentage of Persons with a Disability by Age, American Community Survey 2013-2017
Fulton County2019-2021 COMMUNITY HEALTH NEEDS ASSESSMENT
Percentage of Persons with a Disability by Time Series, American Community Survey 2013-2017
Fulton County
17
16.8
16.8
16.6
16.6
16.4
16.2
16.3
16.2
16
16.1
15.8
15.6
2009-2013 2010-2014 2011-2015 2012-2016 2013-2017
Persons with a disability has remain the same over time
Map of 2019 SocioNeeds Index for Fulton County, Claritas Data
According to the MVPHIP website, “The 2019 SocioNeeds Index, created by Conduent Healthy Communities
Institute, is a measure of socioeconomic need that is correlated with poor health outcomes. All communities
can be described by various social and economic factors that are well known to be strong determinants of
health outcomes. The SocioNeeds Index takes these factors (which range from poverty to education) and
122019-2021 COMMUNITY HEALTH NEEDS ASSESSMENT
generates an Index Value (from 0 – 100) for each zip code and county in the nation. Those with the highest
values are estimated to have the highest socioeconomic need which is correlated with preventable
hospitalizations and premature death. To identify the relative level need within a community, the national
Index Values for each location (e.g. zip code) in the community are sorted from low to high, and divided into 5
Ranks. These ranks are used to color the Needs Index map.” The darker the color, the greater the need.
Based on the SocioNeeds Index, the needs are the greatest in Gloversville, Salisbury Center and Amsterdam,
while Broadalbin ranks with the lowest need.
2019 SocioNeeds Index by NLH Service Region, Claritas Data
County Zip Code Town Pop. Index Rank
Fulton 12078 Gloversville 22,996 84.2 5
Herkimer 13454 Salisbury Center 588 82.7 5
Montgomery 12010 Amsterdam 28,968 79.2 5
Fulton 13470 Stratford 676 68.8 4
Fulton 12095 Johnstown 12,243 47.5 2
Fulton 12032 Caroga Lake 492 47.3 2
Fulton 12134 Northville 3,488 41.8 2
Fulton 12117 Mayfield 3,144 41.2 2
Fulton 12025 Broadalbin 5,573 37.5 1
Based on the SocioNeeds Index, the needs are the greatest in Gloversville, Salisbury Center, and Amsterdam,
while Broadalbin ranked with the lowest need. The data was not available for Hamilton County zip codes.
b) Health Status:
Percentage of Adults Reporting 14 or More Days of Poor Physical Health, NYS expanded BRFSS
Poor Physical Health
Fulton County Rest of State NYS
18
16 15.1
14
14
11.8
12 11.4
10 11.3
10.8
8
2013-2014 2016
The percentage of Fulton County residents who report having 14 or more days of poor physical health has
increased. The percentage is higher than the rest of the state (which excludes New York City) and New York
State (includes New York City).
132019-2021 COMMUNITY HEALTH NEEDS ASSESSMENT
Percentage of Adults Aged 18-64 years with health care coverage, NYS expanded BRFSS
Health Care Coverage
Fulton County Rest of State NYS
92
90 90.5
88.6
88 86
86 88.6
85.2
84
82
80
78
76
78.8
74
72
2013-2014 2016
The percentage of Fulton County residents who have health care coverage has increased and is the same as
New York State.
Percentage of Age-Adjusted Adults Who Have a Regular Health Care Provider, NYS expanded BRFSS
Health Care Provider
Fulton County Rest of State NYS
90
88.6
89 88.1
88
87
86
85 84.7
84.4
84
84.5
83
82 82.6
81
80
2013-2014 2016
The percentage of Fulton County residents with a regular health care provider has remained the same. The
percentage is higher than the rest of the state and New York State.
142019-2021 COMMUNITY HEALTH NEEDS ASSESSMENT
Percentage of Adults Aged 18-64 years, who saw a Doctor for a Routine Checkup within the Last Year,
NYS expanded BRFSS
Recent Health Checkup
Fulton County Rest of State NYS
82
79.4
80
78
76
74
72
72
71.6
70.9
70
70.2
68 69.5
66
64
2013-2014 2016
The percentage of Fulton County residents with a recent checkup has increased and is higher than rest of state
and New York State.
Percentage of Age-adjusted Adults Who Did Not Receive Medical Care Because Of Cost, NYS expanded BRFSS
No Medical Care Due to Cost
Fulton County Rest of State NYS
14
13.6 13.7
13.5
13
12.5
12 12
11.5 11.5
11.5
11
10.5
10.6
10
9.5
9
2013-2014 2016
The percentage of Fulton County residents who did not receive medical care because of cost has increased.
152019-2021 COMMUNITY HEALTH NEEDS ASSESSMENT
Percentage of Age-adjusted Adults Who Had a Dentist Visit within the Past Year, NYS expanded BRFSS
Recent Dental Visit
Fulton County Rest of State NYS
72
70.9
69.6
70
69.3
68
68.4
67.8
66
64
62 63.2
60
2013-2014 2016
The percentage of adults with a recent dental visit has increased.
Percentage of Children (aged 2-20 years) with at least One Preventive Dental Visit within the Last Year, NYS
Medicaid and Child Health Plus Data as of June 2018
2016
Fulton County 62.1
Mohawk Valley 59.1
NYS 57.4
0 10 20 30 40 50 60 70
The percentage of children with at least one preventive dental visit is higher than the Mohawk Valley region
and New York State.
162019-2021 COMMUNITY HEALTH NEEDS ASSESSMENT
Caries Outpatient Visit Rate 10,000, Aged 3 – 5 years, SPARCS as of December 2017
2016
Fulton County* 53.7
Mohawk Valley 57.2
NYS 90
0 10 20 30 40 50 60 70 80 90 100
The percentage of children three to five years with outpatient caries is lower than New York State and the
Mohawk Valley region. *The rate should be viewed with caution, since 10 or fewer events are in the numerator.
Infant Mortality Rate per 1,000 live births, New York State Vital Statistics Event Registry
2015 Fulton County*
8
6.8
5.6
Fulton County* 3.8 6
7.6
Mohawk Valley 9.5 4
Rest of State 5.1 2
3.8
NYS 4.6 1.9
0
0 2 4 6 8 10 2011 2012 2013 2014 2015
The infant mortality rate is lower than the Mohawk Valley region, rest of state and New York State. *The rates
had fewer than 10 events in the numerator and should be viewed with caution.
Percentage of Preterm births, New York State Vital Records
2016 15
Fulton County
13.3
Fulton County 9.5 10
11.1
9.6 10.6 9.7
5
NYS 10.3
0
0 2 4 6 8 10 12 2012 2013 2014 2015 2016
The percentage of preterm births is lower than the New York State percentage.
172019-2021 COMMUNITY HEALTH NEEDS ASSESSMENT
Percentage of Births with Adequate Prenatal Care, New York State Vital Statistics
2014-2016 Fulton County
84
82
Fulton County 81.6
80
81.1 81.6
Mohawk Valley 78.9 78
79.4
76 77.7
NYS 74 74 75.8
0 50 100 72
2010-2012 2011-2013 2012-2014 2013-2015 2014-2016
The percentage of births with adequate prenatal care is higher than the Mohawk Valley and New York State.
Percentage of Age-adjusted Adults with Poor Mental Health for 14 or More Days in the Last Month, NYS
expanded BRFSS
Poor Mental Health
Fulton County Rest of State NYS
18
16.3
16
14
13.3
12 11.8
11.2
10 11.1 10.7
8
2013-2014 2016
The percentage of Fulton County adults reporting poor mental health has increased.
Age-adjusted Suicide Death Rate per 100,000 Population, NYS Vital Records
2014-2016
Fulton County 14.2
NYS 8
0 2 4 6 8 10 12 14 16
Fulton County’s suicide death rate is higher than New York State.
182019-2021 COMMUNITY HEALTH NEEDS ASSESSMENT
Mental Health Provider Rate per 100,000 Population, County Health Rankings
2018
Fulton County 160
NYS 268
US 229
0 50 100 150 200 250 300
The rate of Fulton County providers is lower than New York State and the United States.
2. MAIN HEALTH CHALLENGES
Leading Causes of All Deaths for Total Population, NYS Leading Causes of Death
Fulton County
Number of Deaths and Age-adjusted Death Rate
Year Total Deaths #1 Cause of Death #2 Cause of Death #3 Cause of Death
2016 612 Heart Disease Cancer CLRD
801.8 per 100,000 179 137 47
225.9 per 100,000 175.1 per 100,000 59.2 per 100,000
2015 596 Heart Disease Cancer CLRD
773.5 per 100,000 168 120 38
210.7 per 100,000 153.1 per 100,000 48.1 per 100,000
2014 577 Heart Disease Cancer CLRD
767.9 per 100,000 155 132 50
202.3 per 100,000 173.1 per 100,000 65.2 per 100,000
2013 589 Heart Disease Cancer CLRD
783.2 per 100,000 156 137 44
195.5 per 100,000 186.1 per 100,000 57.2 per 100,000
2012 644 Heart Disease Cancer CLRD
836.6 per 100,000 174 130 59
216.4 per 100,000 173.2 per 100,000 78.4 per 100,000
Heart Disease, Cancer, and Chronic Lower Respiratory Diseases (CLRD) remain the top three leading causes of
death in Fulton County.
192019-2021 COMMUNITY HEALTH NEEDS ASSESSMENT
Percentage of Age-adjusted Adults with Cardiovascular Disease, NYS expanded BRFSS
2016
Fulton County 7.5
Rest of State 7.2
NYS 7
0 1 2 3 4 5 6 7 8
The percentage of adults with cardiovascular disease is similar to the rest of state and New York State.
Age-adjusted Death Rate per 100,000 Population Due to Coronary Heart Disease, CDC Wonder
2015-2017
Fulton County 151.6
NYS 120.4
US 94.8
0 20 40 60 80 100 120 140 160
The death rate due to coronary heart disease is higher than New York State and higher than the United States.
Percentage of Adults aged 50-75 receiving a Colorectal Cancer Screening, NYS expanded BRFSS
2016 Fulton County
80
Fulton County 76.1 70 76.1
60 67.4
50 59.3
NYS 68.5
40
0 50 100 2008-2009 2013-2014 2016
The percentage of adults aged 50-75 receiving a colorectal cancer screening based on the guidelines is higher
than New York State.
202019-2021 COMMUNITY HEALTH NEEDS ASSESSMENT
Percentage of Women aged 50-74 receiving a Breast Cancer Screening, NYS expanded BRFSS
2016 Fulton County
82
Fulton County 80.6 80
80.6
Rest of State 79.2 78
76
NYS 79.7 76.2
74
0 50 100 2013-2014 2016
The percentage of women aged 50-74 receiving a breast cancer screening based on the guidelines has
increased over time and is higher than the rest of state and New York State.
Percentage of Age-adjusted Adults with Chronic Obstructive Pulmonary Disease (COPD), NYS expanded BRFSS
2016
Fulton County 7.6
Rest of State 5.7
NYS 4.9
0 1 2 3 4 5 6 7 8
The percentage of adults with COPD is higher than the rest of state and New York State
2019 County Health Rankings for the Mohawk Valley Region, University of Wisconsin Population Health
Institute and the Robert Wood Johnson Foundation
Social &
Health Length Quality Health Health Clinical Physical
County Economic
Outcomes of Life of Life Factors Behaviors Care Environment
Factors
Fulton 44 41 50 58 55 54 57 7
Herkimer 45 55 33 44 45 24 42 23
Otsego 32 39 23 15 24 12 24 29
Montgomery 54 56 48 60 50 57 61 16
Schoharie 20 20 18 35 32 37 38 33
The County Health Rankings utilizes measures to rank each state’s counties annually. Health Outcomes
ranking includes the measures from Length of Life and Quality of Life. The Health Factors ranking includes
212019-2021 COMMUNITY HEALTH NEEDS ASSESSMENT
Health Behaviors, Clinical Care, Social & Economic Factors, and the Physical Environment. New York State has
62 counties. Therefore, each ranking is 1 out of 62. Fulton ranked 44 out of 62 in Health Outcomes and 58 out
of 62 in Health Factors. Based on information from the County Health Rankings website, the rankings identify
areas of opportunity for change in the counties. Taken individually, Fulton County performs well in the
measure of Physical Environment. The areas of opportunity are Length of Life, Quality of Life, Health
Behaviors, Clinical Care, and Social & Economic Factors.
a) Behavioral Risk Factors:
The County Health Rankings ranked Fulton County 55 out of 62 counties in Health Behaviors. Those behaviors
include the following: adult smoking, adult obesity, food environment index, physical inactivity, access to
exercise opportunities, excessive drinking, alcohol-impaired driving deaths, sexually transmitted infections,
and teen births. Utilizing this framework, below are some indicators from various sources related to health
behavioral risk factors.
SMOKING AND VAPING:
Percentage of Age-adjusted Adults who are Current Smokers, NYS expanded BRFSS
2016 Fulton County
40
Fulton County 19.1 30
30.7
Rest of State 17 20
10 19.1
NYS 14.5
0
0 10 20 30 2013-2014 2016
The percentage of current adult smokers has decreased, and the current rate is higher than the rest of state
and New York State.
Percentage of High School Students who Smoked One or More Cigarettes in the Past 30 days, Fulton County
Youth Risk Behavior Survey
2018
Fulton County 9
NYS 2017 6
0 1 2 3 4 5 6 7 8 9 10
The percentage of high school students reporting smoking one or more cigarettes in the past 30 days is higher
than New York State.
222019-2021 COMMUNITY HEALTH NEEDS ASSESSMENT
Percentage of Age-adjusted Adults who use E-Cigarettes, NYS Expanded BRFSS
2016
Fulton County 4.8
Rest of State 4.1
NYS 4.3
0 1 2 3 4 5 6
The percentage is higher for the county than it is for the rest of state and New York State.
Percentage of High School Students who used Electronic Vapor Products on One or More of the Past 30 Days,
Fulton County Youth Risk Behavior Survey
2018
Fulton County 35
NYS 2017 15
0 5 10 15 20 25 30 35 40
The percentage is higher for the county than it is for New York State.
NUTRITION & PHYSICAL ACTIVITY:
Percentage of Age-adjusted Adults who are Obese, NYS expanded BRFSS
2016 Fulton County
40
Fulton County 34.5 35
Rest of State 27.5 30
34.5
31.4
NYS 25.5 25
0 10 20 30 40 20
2013-2014 2016
The percentage of adults who are obese is higher than rest of state and New York State.
232019-2021 COMMUNITY HEALTH NEEDS ASSESSMENT
Percentage of Age-adjusted Adults who are Overweight or Obese, NYS expanded BRFSS
2016 Fulton County
70
Fulton County 69.4 68 69.4
66
Rest of State 63.6
64
NYS 60.5 62
63
60
0 50 100 2013-2014 2016
The percentage of adults who are overweight or obese has increased and the current rate is higher than New
York State.
Percentage of Children and Adolescents who are Obese, Student Weight Status Category Reporting System
2014-2016
Fulton County 17.6
Mohawk Valley 18.8
Rest of State 17.3
0 2 4 6 8 10 12 14 16 18 20
The percentage of children and adolescents who are obese is similar to the rest of state.
Percentage of Age-adjusted Adults with Physician Diagnosed Diabetes, NYS expanded BRFSS
2016 Fulton County
11
10
Fulton County 8.9 10.3
9
Rest of State 8.5 8 8.9
NYS 9.5 7
6
0 2 4 6 8 10 2013-2014 2016
The percentage of adults with physician diagnosed diabetes has decreased.
242019-2021 COMMUNITY HEALTH NEEDS ASSESSMENT
Percentage of Age-adjusted Adults who consume one or More Sugary Drinks Daily, NYS expanded BRFSS
2016 40
Fulton County
Fulton County 31.1 30
31.2 31.1
Rest of State 24.6 20
10
NYS 24.2
0
0 20 40 2013-2014 2016
The percentage of adults who consume one or more sugary drinks daily is higher than the rest of state and
New York State.
Percentage of Age-adjusted Adults who reported consuming less than One Fruit and less than One Vegetable
Daily, NYS expanded BRFSS
2016
Fulton County 33.5
Rest of State 29
NYS 31.5
0 5 10 15 20 25 30 35 40
The percentage of adults who consuming less than one fruit and less than one vegetable daily is higher than
the rest of state and New York State.
Percentage of the population with low income and low access to a grocery store, U.S. Department of
Agriculture-Food Environment Atlas
Fulton County
4
3
3.2 3.5
2
1
0
2010 2015
This indicator reflects the percentage of the population that has low income and living more than 10 miles
from a grocery store. The percentage has remained the same.
252019-2021 COMMUNITY HEALTH NEEDS ASSESSMENT
Percentage of Age-adjusted Adults who consume Fast Food 3 or More Times per Week, NYS expanded BRFSS
2013-2014
Fulton County 5.4
Rest of State 6.8
NYS 5.9
0 1 2 3 4 5 6 7 8
The percentage of adults who consume fast food three or more times per week is lower than the rest of state
and New York State.
Percentage of Age-adjusted Adults who participated in Leisure Time Activity in the Past 30 Days, NYS
expanded BRFSS
2016
Fulton County 68.5
Rest of State 75
NYS 74
0 10 20 30 40 50 60 70 80
The percentage of adults who participated in leisure time activity is lower than New York State.
Percentage of Access to Exercise Opportunities, County Health Rankings
2019
Fulton County 80.9
NYS 92.9
US 83.9
0 20 40 60 80 100
The percentage of individuals who have proximity to exercise opportunities, such as parks and recreation
facilities is lower than New York State and United States. The 2019 percentage is lower than the 2018
percentage of (84.5).
262019-2021 COMMUNITY HEALTH NEEDS ASSESSMENT
Percentage of High School Students who were Not Physically Active at least 60 minutes per Day on 5 or More
Days, Fulton County Youth Risk Behavior Survey
2018
Fulton County 50
NYS 2017 58
USA 2017 54
0 10 20 30 40 50 60 70
The Fulton County percentage is lower than New York State and United States.
ALCOHOL & DRUG USE:
Young Adults Ages 16-21 yrs. driving while Intoxicated-Arrest rate per 10,000, Council on Children & Families
Kids’ Well-being Indicators Clearinghouse
Fulton County Rest of State NYS
60
51.8
50
40.8
40 36.3
31.5
30 35.5
32.5 25.2
30.5 30.2
25.7
20 23.8 22.7
21.4 20.9
17.5
10
0
2013 2014* 2015* 2016* 2017*
The Fulton County rate is higher than New York State, and has lowered over time. *The rates had fewer than 20
events in the numerator and should be viewed with caution.
272019-2021 COMMUNITY HEALTH NEEDS ASSESSMENT
Percentage of Age-adjusted Adults Binge Drinking during the Past Month, NYS expanded BRFSS
2016
Fulton County 14.6
Rest of State 19.1
NYS 18.3
0 5 10 15 20 25
The percentage of adults binge drinking during the past month is lower than the rest of state and New York
State.
Alcohol related Motor Vehicle Injuries and Death per 100,000 population, NYS Department of Motor Vehicles
2014-2016
Fulton County 43.2
Mohawk Valley 43.2
NYS 29.9
0 10 20 30 40 50
Fulton County’s rate is higher than New York State.
Age-adjusted Adult Hospitalization rate due to Substance Use per 10,000 population 18+ yrs., NYS SPARCS
2014-2016
Fulton County 18.8
NYS 22
0 5 10 15 20 25
Fulton County’s rate is lower than New York State and similar to the 2013-2015 rate of (18.2).
282019-2021 COMMUNITY HEALTH NEEDS ASSESSMENT
Overdose Deaths involving any Opioid crude rate per 100,000 population, NYS Vital Statistics
2016
Fulton County* 7.4
Mohawk Valley 11.7
NYS 15.5
0 2 4 6 8 10 12 14 16 18
Fulton County’s rate is lower than the Mohawk Valley region and New York State. *The rates had fewer than 10
events in the numerator and should be viewed with caution.
All Emergency Department visits involving any Opioid Overdose per 100,000 population, NYS SPARCS
2016
Fulton County 50.2
Mohawk Valley 70.4
NYS 56.9
0 10 20 30 40 50 60 70 80
Fulton County’s rate is lower than the Mohawk Valley region and New York State.
Opioid Burden (including ED visits and hospital discharges for non-fatal opioid overdose, abuse, dependence,
and unspecified use and overdose death) rate per 100,000, NYS SPARCS
2016
Fulton County 250.8
Mohawk Valley 276.9
NYS 295.9
0 50 100 150 200 250 300 350
Fulton County’s rate is lower than the Mohawk Valley region and New York State.
292019-2021 COMMUNITY HEALTH NEEDS ASSESSMENT
SEXUALLY TRANSMITTED INFECTIONS & TEEN BIRTHS:
Chlamydia case rate per 100,000 Women – Aged 15–44 yrs., Bureau of Sexual Health and Epidemiology
2014-2016
Fulton County 1504.6
Mohawk Valley 1328.3
NYS 1577.4
0 200 400 600 800 1000 1200 1400 1600 1800
Fulton County’s rate is lower than New York State and higher than the Mohawk Valley region.
Hepatitis C Chronic rate per 100,000 Population of Cases Reported, NYS Communicable Disease Annual Report
2018
Fulton County 42.7
Rest of State 55.2
NYS 53.1
0 10 20 30 40 50 60
Fulton County’s rate is lower than rest of state and New York State.
Percentage of Births to Teens – Aged 15–19 yrs., NYS Vital Statistics
2014-2016
Fulton County 8.8
Mohawk Valley 6.7
NYS 3.8
0 2 4 6 8 10
Fulton County’s rate is higher than New York State and the Mohawk Valley region.
302019-2021 COMMUNITY HEALTH NEEDS ASSESSMENT
b) Environmental Risk Factors:
The County Health Rankings ranked Fulton County 7 out of 62 counties in Physical Environment. Those risk
factors include the following: air pollution-particulate matter, drinking water violations, severe housing
problems, driving alone to work, and long commute-driving alone. Below are some indicators from various
sources related to environmental risk factors.
AIR QUALITY & ASTHMA:
Air Pollution– Avg. Daily Density of Particulate Matter in Micrograms per Cubic Meter, County Health Rankings
2014
Fulton County 8
NYS 8.5
0 1 2 3 4 5 6 7 8 9
The Fulton County average daily density is similar to New York State.
Asthma Hospitalization rate per 10,000 Aged 5-64 yrs., NYS SPARCS
2016
Fulton County 3.7
Mohawk Valley 2.7
NYS 8.7
0 1 2 3 4 5 6 7 8 9 10
Fulton County’s rate is higher than the Mohawk Valley region and lower than New York State.
312019-2021 COMMUNITY HEALTH NEEDS ASSESSMENT
COMMUTING:
Percentage of Workers Aged 16 years and older who Drive Alone to Work, American Community Survey
2013-2017
Fulton County 83.2
NYS 52.9
US 76.4
0 10 20 30 40 50 60 70 80 90
The Fulton County percentage is higher than New York State.
Mean Travel Time to Work (minutes), American Community Survey
2013-2017
Fulton County 25
NYS 33
US 26.4
0 5 10 15 20 25 30 35
Fulton County’s time is lower than New York State and United States.
Percentage of Workers Aged 16 years and older who Commute by Public Transportation, American
Community Survey
2013-2017
Fulton County 0.6
NYS 28.2
US 5.1
0 5 10 15 20 25 30
The Fulton County percentage is lower than New York State and United States.
322019-2021 COMMUNITY HEALTH NEEDS ASSESSMENT
HOUSING PROBLEMS:
Percentage of Households with at least 1 of 4 Housing Problems (overcrowding, high housing costs, lack of
kitchen facilities, or lack of plumbing facilities, County Health Rankings
2011-2015
Fulton County 15
NYS 24.2
US 18.4
0 5 10 15 20 25 30
The Fulton County percentage is lower than New York State and United States.
Percentage of Houses Built Prior to 1950, American Community Survey
2013-2017
Fulton County 45.2
NYS 40.7
US 18
0 5 10 15 20 25 30 35 40 45 50
The Fulton County percentage is higher than New York State and United States.
Percentage of Blood Lead Levels in Children (>5 micrograms per deciliter), National Environmental Public
Health Tracking Network
2015 15
Fulton County
Fulton County 9.9 10 13.7 12.6
9.9
5
NYS 1.9
0
0 10 20 2013 2014 2015
The percentage of blood lead levels are higher than New York State, but have decreased over time.
332019-2021 COMMUNITY HEALTH NEEDS ASSESSMENT
c) Socioeconomic Factors:
The County Health Rankings ranked Fulton County 57 out of 62 counties in Socioeconomic Factors. Those risk
factors include the following: high school graduation, some college, unemployment, children in poverty,
income inequality, children in single-parent households, social associations, violent crime, and injury deaths.
Education attainment, employment, and income were included in demographics section of the report. Below
are some indicators related to poverty, social isolation, crime, and unintentional injuries and injury deaths.
CHILDREN’S STATUS:
Percentage of Children Living Below Poverty Level, American Community Survey
2013-2017 Fulton County
24.5
Fulton County 23.4 24 24.3
24.1
NYS 21.3 23.5
23.6
23.4
US 20.3 23
0 10 20 30 22.5
2010-2014 2011-2015 2012-2016 2013-2017
Fulton County’s percentage is higher than New York State and US.
Percentage of Children Living Below Poverty Level by Age, American Community Survey 2013-2017
Fulton County2019-2021 COMMUNITY HEALTH NEEDS ASSESSMENT
Percentage of Child Food Insecurity, Feeding America Research’s Map the Meal Gap
2017
Fulton County 20.7
NYS 17.6
US 17
0 5 10 15 20 25
Fulton County’s percentage is higher than New York State and United States.
Percentage of Households Receiving SNAP with Children under 18 yrs., American Community Survey
2013-2017
Fulton County 42.2
NYS 43
US 52.3
0 10 20 30 40 50 60
Fulton County’s percentage is lower than New York State.
Percentage of Children in Single Parent Households, American Community Survey
2013-2017 Fulton County
48
Fulton County 42.3 46
46.3
44
NYS 34.3 44.3
42
US 33.3 41.7 42.3
40
40.8
0 50 38
2009-2013 2010-2014 2011-2015 2012-2016 2013-2017
Fulton County’s percentage is higher than New York State and United States.
352019-2021 COMMUNITY HEALTH NEEDS ASSESSMENT
SOCIAL ASSOCIATIONS:
Social Associations (Number of Membership Associations) per 10,000 Population, County Health Rankings
2016
Fulton County 9.5
NYS 8
0 1 2 3 4 5 6 7 8 9 10
Fulton County’s number is higher than New York State.
Percentage of Disconnected Youths Ages 16-24 who are Not Employed nor in School, Measure of America
2012-2016
Fulton County 21.7
NYS 12.1
0 5 10 15 20 25
Fulton County’s percentage is higher than New York State.
UNINTENTIONAL INJURIES AND INJURY DEATHS:
Age-adjusted Death rate per 100,000 Population due to Unintentional Injuries, NYS Vital Statistics
2014-2016
Fulton County 35.2
Mohawk Valley 37
NYS 32.9
0 5 10 15 20 25 30 35 40
Fulton County’s number is higher than New York State and lower than the Mohawk Valley region.
362019-2021 COMMUNITY HEALTH NEEDS ASSESSMENT
Percentage of Adults Aged 65+ with at Least One Fall in the Past 12 Months, NYS expanded BRFSS
2016
Fulton County 32.8
Rest of State 28
NYS 27.4
0 5 10 15 20 25 30 35
Fulton County’s percentage is higher than the rest of state and New York State.
Work related Hospitalizations per 100,000 employed persons Aged 16 yrs. and older, NYS SPARCS
2014-2016
Fulton County 211.7
Mohawk Valley 163.5
NYS 133.8
0 50 100 150 200 250
Fulton County’s rate is higher than the Mohawk Valley and New York State.
Age-adjusted Death rate per 100,000 Population due to Motor Vehicle Traffic Collisions, NYS Vital Statistics
2015-2017
Fulton County 11.3
NYS 5.3
US 11.4
0 2 4 6 8 10 12
Fulton County’s rate is higher than New York State and similar to the United States.
372019-2021 COMMUNITY HEALTH NEEDS ASSESSMENT
VIOLENT CRIME:
Violent Crime rate per 100,000 Population, NYS Division of Criminal Justice Service
2018 Fulton County
300
250
280 276.1
Fulton County 276.1 200
229.7 220.3
150
100
NYS 350.6
50
0
0 200 400 2015 2016 2017 2018
The violent crime indicator includes four offenses: murder and non-negligent manslaughter, rape, robbery and
aggravated assault. Fulton County’s rate is lower than New York State.
d) Policy Environment:
According to the Centers for Disease Control and Prevention, “policy interventions are particularly valuable
because they are systems-based and can affect population by changing the context in which individuals take
action or make decisions.” Below are some of the systems-based policy changes and programs in Fulton
County.
FLUORIDATION:
The Department of Health and Human Services, the Surgeon General, and the Community Preventive Services
Task Force recommend fluoridation, since fluoride has been found to prevent tooth decay. The fluoridation of
community waters has also been found to be the most cost-effective method for diminish tooth decay.
According to the New York State Department of Health’s Prevention Agenda dashboard, in 2017 (55.9) percent
of residents served by community water systems have optimally fluoridated water.
TOBACCO FREE POLICIES:
Under New York Law, smoking and vaping are prohibited at all state parks, playgrounds, hospitals, and health
care facilities. The New York State Department of Health has continued to grant fund Catholic Charities of
Fulton and Montgomery to work on tobacco free policies in Fulton, Hamilton, and Montgomery counties. One
of their projects is smoke free multi-unit housing. The following buildings in Fulton County have policies: the
Gloversville Housing Authority and Trackside Homes in Johnstown.
Another project focuses on smoke free outdoor areas such as; parks, playgrounds, athletic fields and beaches.
Tobaccofreenys.org has a list of the following parks in Fulton County that are 100% tobacco free: the village of
Broadalbin, the towns of Broadalbin and Ephratah, and the city of Gloversville.
382019-2021 COMMUNITY HEALTH NEEDS ASSESSMENT
e) Other Unique Characteristics of the Community that Contributes to Health Status:
RECREATIONAL ASSETS:
According to Fulton County, NY’s website, Fulton County is home to 44 lakes for fishing and 74,832 acres of
wild forest for hunting. Hiking and mountain biking trails are in the Adirondack Park. The Powley-Piseco Road
is described as one of the best seasonal roads in the Adirondacks and 8 miles of this trail are in Fulton County.
Other biking opportunities exist on the FJ&G Rail Trail with two sections: Johnstown at Union Avenue traveling
north to Dennie’s Crossing, Gloversville and Vail Mills to the village of Broadalbin. The FJ&G Rail Trail is a
paved trail for biking, running, and walking.
Fulton County has its own downhill ski facility, Royal Mountain, which features snowmaking and speedy chair
lift lines. There are 13 trails ranging from easy to very difficult and a terrain park. Lapland Lake Nordic Vacation
Center in Northville/Benson, a cross-country ski facility, is one of the best in the country. There are 50
kilometers of scenic ski and snowshoe trails here surrounded by the pristine southern Adirondack Park. The
Rockwood State Forest is a popular cross-country ski destination.
THE PAUL NIGRA CENTER FOR CREATIVE ARTS:
The Paul Nigra Center for Creative Arts provides classes, entertainment, exhibitions, special events and a
creative education resource for people of all ages and abilities. It is committed to offering accessible art
programs for adults and children with developmental and physical differences.
3. COMMUNITY ASSETS AND RESOURCES
ASSETS:
Nathan Littauer Hospital and Fulton County Public Health are participating partners in Adirondack
Health Institute’s Performing Provider System (AHI PPS) through the Delivery System Reform Incentive
Payment (DSRIP) program. DSRIP’s purpose is to restructure the health care delivery system by
reinvesting in the Medicaid program. AHI PPS includes providers and community based organizations
from Clinton, Essex, Franklin, Fulton, Hamilton, Saratoga, St. Lawrence, Warren and Washington
counties. AHI PPS has 11 projects from New York State approved list organized by three domains:
system transformation, clinical improvement, and population health.
Catholic Charities of Fulton and Montgomery Counties provides a various services to the community
such as; domestic violence/crime victims services, substance use prevention, tobacco control, food
pantry, and emergency assistance.
Fulmont Community Action Agency’s mission is to improve and expand human services and programs
in order to promote self-sufficiency and improve the quality of life of the socially and economically
disadvantaged, as well as provide services to promote economic efficiency and stability in Fulton,
Montgomery, and surrounding counties.
Fulton County Office for the Aging provides services and programs to assist people to live
independently.
Fulton, Montgomery and Schenectady Cancer Services Program can assist in improving cancer
screening rates (preventive care & management). Their services include client reminders for enrolled
392019-2021 COMMUNITY HEALTH NEEDS ASSESSMENT
clients, group education, one-on-one education, reducing structural barriers, and reducing client out-
of-pocket-costs.
HealthLink Littauer is Nathan Littauer Hospital’s wellness education and resource center. HealthLink’s
offers a wide variety of programs and chosen based on the interests and needs of the community.
National Alliance on Mental Illness (NAMI) for Montgomery, Fulton & Hamilton Counties is a nonprofit
that provides educational courses for parents, loved ones, caregivers, mental health professionals, and
those with mental health disorders. These courses educate people and help them to develop skills on
how to care and manage mental health disorders.
New York State Department of Health prioritizes the significant health needs of all communities across
the state through the Prevention Agenda. According to the New York State Department of Health
website “the Prevention Agenda 2019-2024 is New York State’s health improvement plan, the
blueprint for state and local action to improve the health and well-being of all New Yorkers and to
promote health equity in all populations who experience disparities. In partnership with more than 100
organizations across the state, the Prevention Agenda is updated by the New York State Public Health
and Health Planning Council at the request of the Department of Health. This is the third cycle for this
statewide initiative that started in 2008. New to this 2019-2024 cycle is the incorporation of a Health
Across All Policies approach, initiated in 2017, which calls on all State agencies to identify and
strengthen the ways that their policies and programs can have a positive impact on health. It embraces
Healthy Aging to support New York's commitment as the first age-friendly state.”
The ARC Lexington provides services and supports in Fulton and Albany Counties to approximately
1,000 children and adults with intellectual and developmental disabilities, including autism, mental
illness, cerebral palsy, physical disabilities, epilepsy, and traumatic brain injuries.
RESOURCES:
ADK Wellness Connections is a network of community, social service, and health care providers
working together to make it easier for the public to find and get connected to the resources they need
to live a healthy life.
Eldercare Locator, a public service of the U.S. Administration on Aging connects individuals to services
for older adults and their families on the web. Eldercare also has a toll free number 1-800-677-1116.
New York State Office of Alcoholism and Substance Abuse Services’ (OASAS) website has a treatment
provider directory search, bed availability dashboard, gambling treatment and prevention,
developmental disability services, and resources for providers of clinical screening and assessment
services for impaired driving offender
NY Connects Resource Directory helps individuals connect to services and supports, such as health
care, basic needs, consumer services, education, environment and public safety, income support and
40You can also read