2018 Black/African-American Health Report - BLACK/AFRICAN-AMERICAN HEALTH INITIATIVE - San Francisco ...
←
→
Page content transcription
If your browser does not render page correctly, please read the page content below
2018
Black/African-American Health Report
BLACK/AFRICAN-AMERICAN HEALTH INITIATIVE
TABLE OF CONTENTS
Executive Summary���������������������������������������������������� 3

Background���������������������������������������������������������������� 4

Section 1: A Picture of Black/African American
Health in San Francisco����������������������������������������������� 6

       The Health Environment: Challenges To Living A Healthy Life���������� 6

       The Health Status Of The Community������������������������������������������� 11

Section 2: BAAHI – the Black/African American
Health Initiative�������������������������������������������������������� 17

   BAAHI Structure������������������������������������������������������������������������������� 18

   BAAHI Workgroups�������������������������������������������������������������������������� 19

   The BAAHI Learning Community������������������������������������������������������� 23

   Beyond BAAHI��������������������������������������������������������������������������������� 23

Conclusion���������������������������������������������������������������� 26
EXECUTIVE SUMMARY
The charge of the San Francisco Department of Public Health (SFDPH) is to protect and          FIGURE 1
promote the health and well-being of all San Francisco. In many ways, San Franciscans
are healthier than Americans in many other parts of the country. This cannot be said
                                                                                               Unevenly distributed obstacles to health
of Black/African American (B/AA) San Franciscans, who have persistently had poorer
health than their fellow residents in a wide array of measures [Figure 1]. This Black/          Variable                                          White           B/AA
African American Health Report was developed to present the data supporting the
need for urgent intervention to address Black/African American (B/AA) health disparities;       No prenatal care in first trimester               5%              36%
and to describe the work within SFDPH to improve the health of B/AA residents. The
                                                                                                Children 0-18 living in poverty*                  2%              48%
report is structured in 2 sections: Section 1 – An overview of data about the health
environments and health status of B/AA residents of San Francisco; and Section 2 – The          Not exclusively breastfeed in the
                                                                                                                                                  9%              33%
history, goals and accomplishments of the first three years of the Black/African American       first weeks of life
Health Initiative within SFDPH, as well as examples of other complementary work to
improve B/AA health from various areas of SFDPH.                                                Child neglect or abuse, age 0-18                  3/1,000         36/1,000

                                                                                                Not proficient in English language
                                                                                                                                                  19%             76%
Our hope is that the data and examples here will persuade the broader community that            standardized test in 3rd grade
widespread coordinated efforts to improve B/AA health are urgently needed. We also
                                                                                                Did not meet 5th grade Fitness
hope the example of our efforts will inspir e partnerships and collaborations with others       standards
                                                                                                                                                  26%             48%
seeking to correct the inequities that cause the B/AA members of our community to suffer

                                                                                                                                                                             | San Francisco Department of Public Health | Black/African-American Health Report
worse health and to die sooner than their fellow r esidents. We believe that this report        Did not graduate from high school                 16%             63%
can inspire hope that these gaps can be closed. The work is difficult and complex, but
also worthwhile and achievable. Lastly, increasing the ability to discuss issues of inequity    Unemployed                                        4%              18%
openly is a necessary precursor to acknowledging inequity in our work, and changing the
practices and policies that have created it. As James Baldwin said, “Not everything that is     Homelessness                                      39%             36%
faced can be changed, but nothing can be changed until it is faced.”                           All data from San Francisco, see SF Community Health Needs Assessment 20164
                                                                                               “poverty” = household income < 100% FPL
- Dr. Ayanna Bennett
  Director of Interdivisional Initiatives
  San Francisco Department of Public Health

                                                        As James Baldwin said, “Not everything that is faced can
                                                        be changed, but nothing can be changed until it is faced.”                                                           3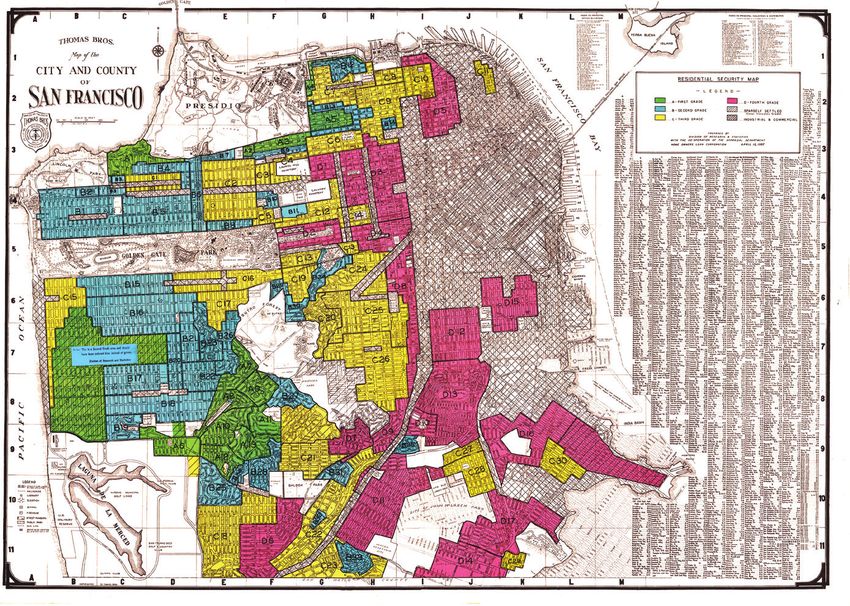
BACKGROUND

                                                                                     It has long been understood in public health that Blacks/African             FIGURE 2
                                                                                     Americans (B/AA) experience disproportionate social, economic, and
                                                                                     environmental burdens that impact their living conditions and constrain
                                                                                     their life choices. We now are beginning to truly grasp the outsized
                                                                                                                                                                  Life Expectancy at Birth by Race and Ethnicity
                                                                                                                                                                  (San Francisco, CA)
                                                                                     role that these social factors play in health, the so-called social
                                                                                     determinants of health. It is now clear that any community faced with
                                                                                     these socioeconomic disparities would also have health disparities. The      100
                                                                                     ultimate disparity, premature death, starkly illustrates the gap between
                                                                                     B/AA residents and their neighbors. Life expectancy for Black/African         95

                                                                                     Americans is the lowest of all race/ethnicities in San Francisco. Based
                                                                                                                                                                   90
                                                                                     on the most recent data from 2012-2016, a B/AA resident could expect
                                                                                     to live 72 years (a bit less for men vs. women), nearly 10 years less than    85
                                                                                     White, Asian, and Latino residents who can expect to live into their
                                                                                     80s [Figure 2]. On the other end of the life-course, B/AA infants are five    80
                                                                                     times more likely than White infants to die before their first birthday.
                                                                                                                                                                   75
| San Francisco Department of Public Health | Black/African-American Health Report

                                                                                     These numbers are stark, but not without hope. In the last 10 years
                                                                                                                                                                   70
                                                                                     the life expectancy of Black/African Americans has increased by over
                                                                                     3 years, as opposed to the 1-2 year increase in other ethnic groups.
                                                                                                                                                                   65
                                                                                     This has allowed the life expectancy gap between White and Black
                                                                                     San Franciscans to narrow from 11.17 years to just under 9.8 years.            0
                                                                                     This matches a national trend reported by the Centers for Disease                            2005–2009                            2012–2016
                                                                                     Control and Prevention in 2017 showing a 25% drop in mortality for
                                                                                     Black/African Americans between 1999 and 2015.1 This drop was most                  All SF     Asian     B/AA       Latino(a)      Multi-ethnic
                                                                                     dramatically seen in heart disease deaths where the national racial                 Native American    Native Hawaiian or other     White
                                                                                     gap between Black/African Americans and Whites closed over that
                                                                                     time. Locally, we see the same type of movement with a larger drop in
                                                                                     ischemic heart disease deaths for Black/African Americans than Whites
                                                                                     in the last 10 years, closing the gap from 50% to 5%.2                         Data Source: Life Expectancy at Birth: State of
                                                                                                                                                                    California, California Department of Public Health,
                                                                                                                                                                    VRBIS Death Statistical Master File Plus 2005-2017.

 4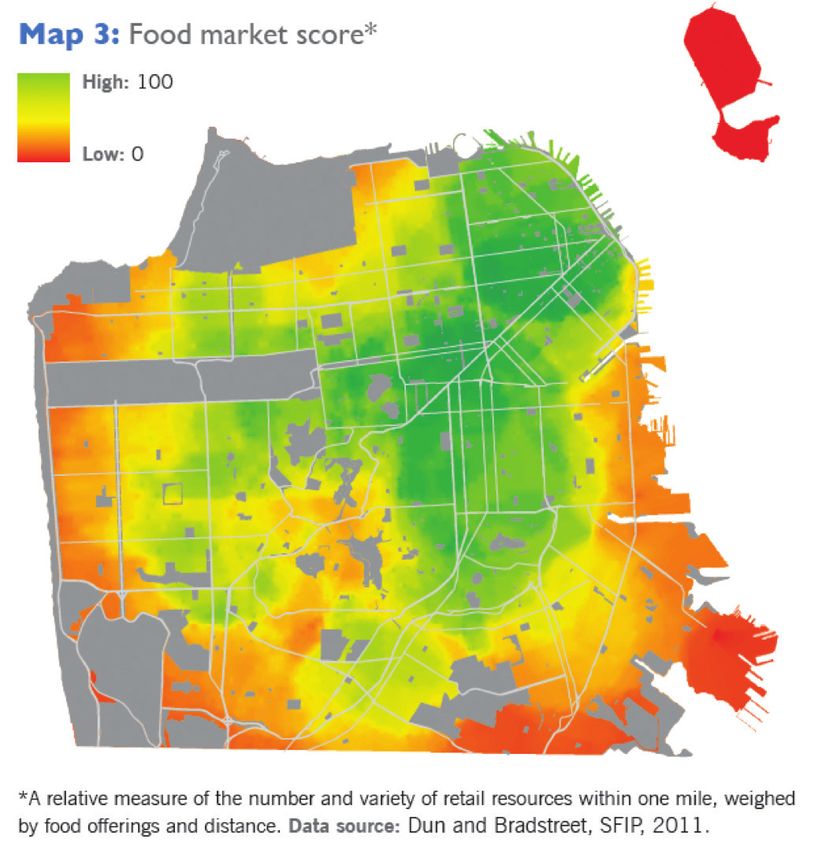
We know that even with a decrease in deaths, B/AA patients have more        The group of public health and medical staff that established BAAHI
severe disease that starts at a younger age. Still, the improvement is      decided early on that focusing on medical conditions would not be
encouraging and suggests that change is possible.                           sufficient to create lasting change. Racial health disparities are in part
                                                                            due to inequities in the availability and quality of healthcare delivered to
In 2014, the Director of Health, Barbara Garcia, recognized that in order
                                                                            racial minorities. Those differences in care stem from often unconscious
to significantly and sustainably improve the health of B/AA residents       bias among healthcare staff and from unexamined policies and practices
in San Francisco, the department needed to commit to focused and            that have inequitable impacts on B/AA people. Mitigating the impact
deliberate work on these issues. A cross-divisional group convened          of bias and inequitable policy requires support and prioritization from
and established the Black/African American Health Initiative (BAAHI) to     leadership to both provide training for staff, and to enable changes in
focus on correcting these disparities. The group chose four indicators      policies and practices that perpetuate racism. To address these issues, a
spanning the life course as a place to start the long process of            workgroup was established to consider how Cultural Humility education
committed work. The four health indicators were:                            and practices might be promoted across the department. Another
                                                                            tool for improving equity of care for B/AA patients and community
Heart health:                                                               members is providing concordant, culturally aware staff members to
reduce the percentage of Blacks/African Americans with heart disease
                                                                            deliver services and create policy. The SFDPH workforce is 11% B/AA,
Women’s health:                                                             higher than the 6% of Black/African Americans in the city. However, the
reduce the mortality rate of B/AA women with breast cancer                  proportion of B/AA clients and patients among those receiving various
                                                                            SFDPH services is much higher. A Workforce Diversity workgroup was
Behavioral Health:                                                          formed to examine how to improve diversity, advancement and inclusion
reduce the mortality rate among B/AA men due to alcohol                     of B/AA staff in light of this gap.

Sexual Health:                                                              The following sections expand on the B/AA health data and specific
reduce the rate of Chlamydia among teenage and transitional age             SFDPH efforts to make change.

                                                                                                                                                           | San Francisco Department of Public Health | Black/African-American Health Report
young B/AA women

                                                                                                                                                           5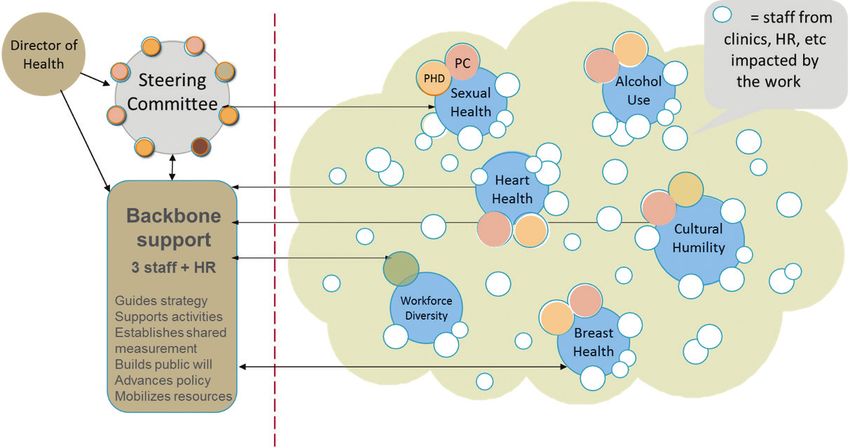
SECTION 1:       A PICTURE OF BLACK/
                                                                                     AFRICAN AMERICAN HEALTH IN SAN FRANCISCO

                                                                                     THE HEALTH ENVIRONMENT: Challenges to living a healthy life
                                                                                     The social and economic environments in which         FIGURE 3
                                                                                     people live determine the state of their health in
                                                                                     many ways. The World Health Organization (WHO)
                                                                                     defines social determinants of health (SDOH) as
                                                                                     the “conditions in which people are born, grow,
                                                                                     work, live, and age, and the wider set of forces
                                                                                     and systems shaping the conditions of daily
                                                                                     life”.3 Based on the Public Health Framework for
                                                                                     Reducing Health Inequities diagram, the simplified
                                                                                     diagram to the right represents the various social
                                                                                     determinants of health [Figure 3]. Upstream
                                                                                     determinants (root causes) include belief systems,
                                                                                     institutional policies and practices, and living
| San Francisco Department of Public Health | Black/African-American Health Report

                                                                                     conditions, while the downstream determinants
                                                                                     (outcomes) represent the actual health disparities
                                                                                     we see in the community. Health behaviors and
                                                                                     psychosocial factors sit between these causes and
                                                                                     outcomes. In the following section we first share
                                                                                     data related to upstream living conditions and then
                                                                                     to the downstream health conditions that result.
                                                                                     The following data comes primarily from the San
                                                                                     Francisco Community Health Needs Assessment,
                                                                                     available online.4

                                                                                     SEGREGATION AND DISPLACEMENT
                                                                                     Segregation, exacerbated by displacement, is a                   SFHIP, Community Health Needs Assessment Page 48
                                                                                     known cause of health disparities. According to
 6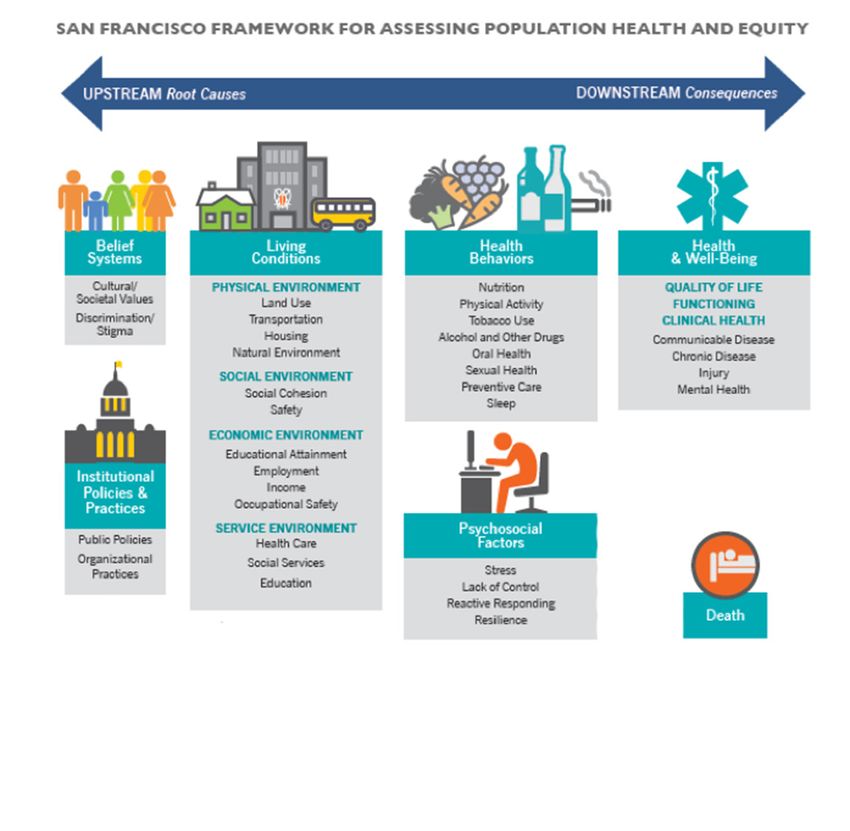
FIGURE 4                                                                   Map 1: Redlining map of San Francisco

Black / African American Population (San Francisco, CA)

100,000
                                   13.4%              12.7%
                                                              10.9%
 80,000
                               10%
                                                                    7.8%
 60,000

                        5.6%                                    6.1%
 40,000

 20,000
Map 2: Areas with a majority race/ethnic population FIGURE 5
Median household income, by race and ethnicity,
2010 and 2013
120,000
100,000
Income in dollars
80,000
60,000
40,000
20,000
0
API
2010 2013
B/AA
Latino *Some groups not included due to unstable data. White, B/AA,
White Asian, Other, Multi-ethnic, Latino. Data source: ACS.
No majority ethnic group
Area of minority concentration*
Data source: ACS 2009 –13.
| San Francisco Department of Public Health | Black/African-American Health Report
According to the 2009 –13 ACS, 58.3 percent of
*San F minority the City INCOME
concentration as any census tract with a non- Therefore any census tract in which 78.3% of the
White population that is 20 percent greater than Black/African American households in San Francisco are persistently
that of the City’s total Non-White percentage. as an area of minority concentration. poor in a city where the average household income is among
the highest in the nation. This pattern is seen in many economic
indicators; Black/African American families do not generally benefit
from the prosperity of San Francisco. For example, as the Great
outmigration since 1973, primarily of middle class families, has Recession began to fade between 2010 and 2013, Black/African
decreased the presence of Black/African Americans in their historic Americans were the only racial/ethnic group that did not see a rise in
communities, with vacancies filled by other racial/ethnic groups. median household income [Figure 5]; essentially, they were left out
Housing losses in the recession beginning in 2008 disproportionately of the recovery. Unemployment followed a similar pattern. A recent
impacted home owners in the Bayview neighborhood. In 2009, study by the Brookings Institute puts the Black-White employment
Bayview had the highest rate of concentrated foreclosures and gap in San Francisco among the highest in the nation.7 This results
homes at risk for foreclosure of any San Francisco neighborhood.6 in families with very different resources: 47% of B/AA children in San
Families who lost their homes to foreclosure and working class Francisco live below the federal poverty level, in comparison to only
residents confronted high rental costs, further fueling displacement. 3% of White children.
8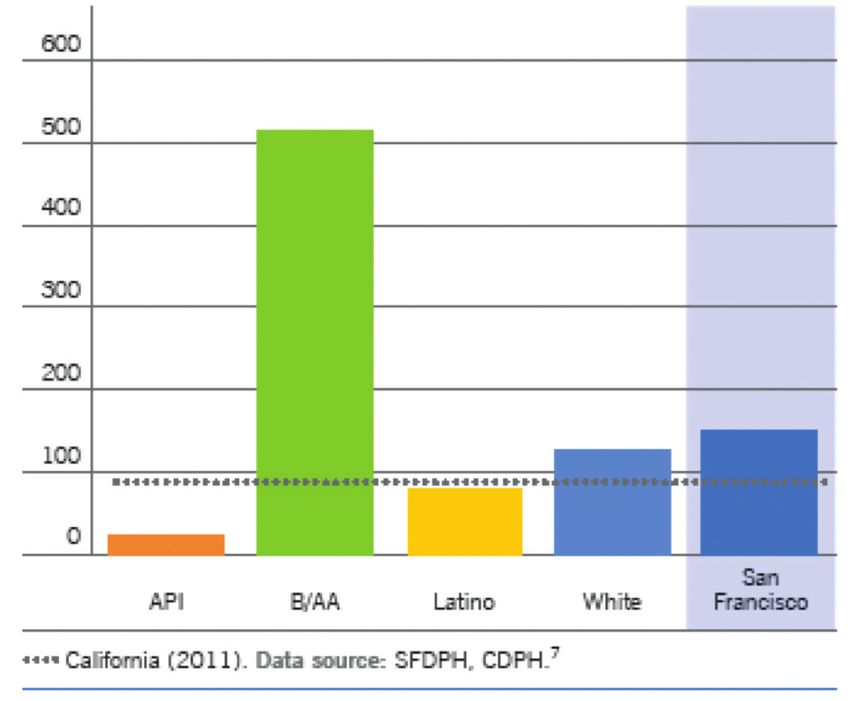
FIGURE 6                                                                EDUCATION
                                                                        The greatest hope for correcting economic disparity is generally
                                                                        accepted to be educational achievement. Unfortunately, the disparities
Student suspension rates in San Francisco
                                                                        in educational attainment in San Francisco mirror the economic
Unified School District
                                                                        disparity. B/AA residents are less than half as likely as their fellow
                                                                        San Franciscans to have a bachelor’s degree. B/AA 3rd graders are
                                8.0                                     only about half as likely to be proficient in math and English as other
                                                                        students. Graduation rates are also lowest for B/AA students among all
                                7.0                                     students in San Francisco. Finally, elevated suspension rates suggest
Percentage of group suspended

                                                                        that B/AA youth have additional barriers to the engagement with
                                6.0
                                                                        school needed to improve these numbers. Historically, low educational
                                5.0                                     attainment has correlated with future poverty, meaning that current
                                                                        school data suggests the current students in SFUSD will have difficulty
                                4.0                                     improving the economic health of their families.

                                3.0
                                                                        HOMELESSNESS
                                2.0                                     The number of homeless Black/African Americans is far
                                                                        disproportionate to the number of B/AA people in the community.
                                1.0
                                                                        The 2017 Homeless Count in San Francisco B/AAs are 36% of the
                                0.0                                     homeless population, despite being less than 6% of the population.8
                                                                        The substantial history of inequity in housing policy and criminal
                                                         er tive
                                                               n
                                                              er

                                                               o

                                                                        justice enforcement helps explain this disparity. In particular, the
                                                e

                                                            AA

                                                                   l
                                      ian

                                                                   Al
                                                           ica
                                            hit

                                                           tin
                                                       h

                                                                                                                                                  | San Francisco Department of Public Health | Black/African-American Health Report
                                                         B/
                                                      AmN a
                                                    Ot
                                      As

                                                                        mass incarceration of B/AA men and women means that a significant
                                            W

                                                        La

                                                                        number of Black/African Americans have been legally barred from
                                                                        access to public housing as well as a myriad of other supportive
     California,                                                        services. In addition, B/AA families have an increased foreclosure risk
   District. Data source: OCOFC, SFUSD.                                 related to lack of family wealth and limited credit access.

                                                                        POLLUTION

47% of B/AA children in San Francisco                                   Environmental pollution has historically been a concern for residents
                                                                        of the Bayview Hunters Point Neighborhood. Indoor hazards related
                                                                        to poor housing condition are a known trigger for asthma and
live below the federal poverty level, in                                allergies. These conditions have been a problem in San Francisco
                                                                        public housing in the past. Outdoor air pollution is also an issue.
comparison to only 3% of White children.                                Much of the Bayview-Hunters Point neighborhood sits near either
                                                                        of the two major city freeways. A review of research by the Health
                                                                                                                                                  9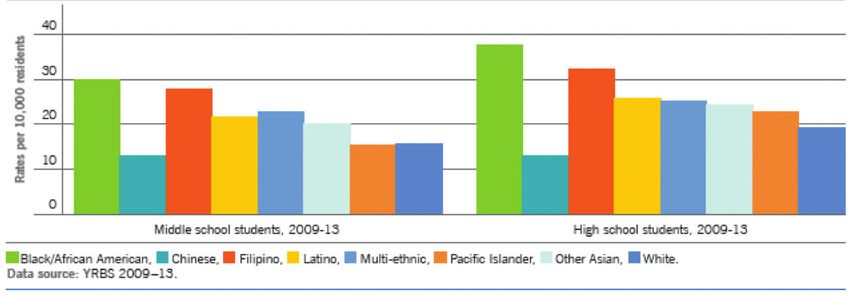
Effects Institute in 2010 reported significant health impacts within    Map 3:
                                                                                     500 feet and some impact up to 1,000 feet (1-3 blocks) from a busy
                                                                                     road or highway.9

                                                                                     RECREATIONAL SPACE
                                                                                     In 2011, SFDPH gathered data on the usability of recreational space
                                                                                     across neighborhoods in San Francisco called the distance-weighted 2
                                                                                     mile recreational area resource score. The score was meant to account
                                                                                     for the accessibility of recreational spaces. Bayview Hunters Point,
                                                                                     the neighborhood with the highest concentration of B/AA residents,
                                                                                     received one of the lowest scores for adequate open spaces. Efforts
                                                                                     are ongoing by the Parks and Recreation Department to make these
                                                                                     spaces more usable for community members.

                                                                                     FOOD ACCESS
                                                                                     Residents in the Bayview Hunters Point district have less access to
                                                                                     fresh and affordable produce than residents in San Francisco’s other
                                                                                     neighborhoods, as evidenced by its food market score [Map 3]. In
                                                                                     Bayview, access points for fresh produce are outnumbered by fast
                                                                                     food chains, convenience stores, and liquor stores selling a variety
                                                                                     of unhealthy sugary and salty snacks. The impact of this unequal
| San Francisco Department of Public Health | Black/African-American Health Report

                                                                                     access can be seen in the prevalence of diet-related diseases
                                                                                     such as diabetes and heart disease in the B/AA community. The
                                                                                     SFDPH Healthy Retail program was established to help small retail
                                                                                     outlets offer produce in neighborhoods where sources are scarce.

10
HEALTH STATUS: The health of the community
Black/African Americans have the highest mortality rate for 9 of the again worse for poor families, and for those experiencing racism.
top 10 causes of death in San Francisco. Mortality is the common The prevalence of asthma among B/AA adults (13.9%) in San
endpoint for a number of chronic and serious health conditions Francisco is more than twice that for Whites (5.0%). Black/ African
that B/AA residents experience at disproportionate rates. Below American middle school students (29.9%) and high school students
is a brief overview of some of these conditions. The Community (37.6%) students were more likely than their classmates to have
Health Needs Assessment (CHNA) for San Francisco, last released
in 2016, includes appendices that offers a fuller picture of the
breadth of conditions that show a racial disparity. All data, unless Black/African Americans have the highest mortality rate
otherwise noted, comes from the appendices of the CHNA report. 10
for nine of the top ten causes of death in San Francisco.
ASTHMA
asthma [Figure 7]. Filipino middle and high school students (24.8%
Asthma and chronic obstructive pulmonary disease (COPD) are and 32.2% respectively) had the second highest prevalence of
chronic conditions affecting the airways. Both conditions are asthma, while Chinese students (13.2% and 13.1%, respectively)
exacerbated by exposures to indoor and outdoor pollution including had the lowest. Consistent with higher prevalence, rates of asthma
tobacco smoke or allergens, like mold. These are all impacted by hospitalizations are highest for Black/ African Americans and are
housing conditions that are known to be poorer for B/AA families almost 9 times higher than for Whites.
in San Francisco. Asthma is also exacerbated by stress, which is
FIGURE 7 CANCER
| San Francisco Department of Public Health | Black/African-American Health Report
Cancer is a term for more than 100
Asthma rates for San Francisco students, by ethnicity, 2010–13 conditions characterized by the
uncontrolled growth and spread of
abnormal cells. Cancer is caused by both
external factors (tobacco use, infectious
organisms, chemicals, radiation, etc.)
and internal factors (genetics, hormones,
immune system conditions, etc.).
Incidence rates for liver cancer and lung
and airway cancers are elevated among
B/AA women. Among men, Black/African
Americans have the highest incidence
rates of prostate, colorectal, liver, and
lung and airway cancers, myeloma, and
11Hodgkin lymphoma. In addition to a high incidence of some cancers, B/ Francisco. The California B/AA male smoking rate was 20.0% in 2014,
AA men and women also have higher than average mortality rates for compared with a 14.8% White male smoking rate. Meanwhile the B/AA
many cancer types (even when their incidence is not relatively high). female smoking rate was 14.7% compared with a 13.1% White female
For both women and men, death rates for most common cancers are smoking rate that same year. Low income B/AA adults have an even
significantly higher for B/AA residents than they are for residents citywide higher rate of smoking.
[Figure 8 and Figure 9].
The reason for the large disparity in rates is unclear. However, tobacco CARDIOVASCULAR HEALTH
use (related to access and marketing) is one known factor. Black/African Cardiovascular disease is an umbrella term for the many conditions
Americans and American Indian/Alaska Natives have a higher adult that affect the health of the blood vessels and heart. Some of the more
smoking prevalence rate compared to other racial/ethnic groups in San prevalent conditions include hypertension, stroke, heart attack and heart
FIGURE 8 FIGURE 9
Age-adjusted mortality rate for males by cancer Age-adjusted mortality rate for females by cancer site,
site, 2009–12 2009–12
80 60
Rates per 100,000 residents
70 50
Rates per 100,000 residents
60 40
| San Francisco Department of Public Health | Black/African-American Health Report
50 30
40 20
30 10
20 0
ch e,
ies
l
lom a,
10
er
st
ta
as
us
on a
ye m
a
ea
Liv
ar
br rach
ec
re
m pho
Br
Ov
nc
lor
t
0
Pa
Co
m
g,
Ly
n
Lu
ch e,
te
l
lom a,
er
ta
as
us
on a
sta
ye m
a
Liv
ec
br rach
cre
m pho
lor
o
San Francisco, White, API, Latina, B/AA. Data source: CDPH
n
Pr
t
Pa
Co
m
g,
Death Statistical Master Files
Ly
n
Lu
San Francisco, White, API, Latino, B/AA.
12 Data source: CDPH Death Statistical Master Files .failure. Like most chronic diseases, the origins of these conditions trace [Figure 10]. The next closest group, Latinos, had a rate of hospitalization
back to lifestyle factors like a high-fat diet, cigarette smoking, and stress, due to hypertension of 2.65 per 10,000 residents.
and co-morbid conditions such as diabetes. These lifestyle factors and
conditions can themselves be traced back to socio-economic factors Research has shown that chronic stress is a major contributor to
discussed earlier, including housing, economic conditions, food access cardiovascular disease, with those reporting higher stress having higher
and lack of recreational space. This explains why from 2012-14, B/ disease rates and worse outcomes. In recent research, the experience
AA residents of San Francisco were 5.5 times more likely to become of racism has been noted as a definable risk factor for cardiovascular
hospitalized from hypertension, at a rate of 11 per 10,000 residents disease (perhaps mediated through stress).11,12
FIGURE 10 FIGURE 11
Age Adjusted Rates of Hospitalizations for hypertension Age Adjusted Rates of Hospitalizations for Diabetes (per
(per 10,000 residents) 10,000 residents)
40 60
35
50
30
40
| San Francisco Department of Public Health | Black/African-American Health Report
25
20 30
15
20
10
10
5
0 0
7
8
9
0
1
7
2
8
3
9
4
0
5
1
6
2
3
4
5
6
00
00
00
01
01
00
01
00
01
00
01
01
01
01
01
01
01
01
01
01
–2
–2
–2
–2
–2
–2
–2
–2
–2
–2
–2
–2
–2
–2
–2
–2
–2
–2
–2
–2
05
06
07
08
09
05
10
06
11
07
12
08
13
09
14
10
11
12
13
14
20
20
20
20
20
20
20
20
20
20
20
20
20
20
20
20
20
20
20
20
Asian/PI B/AA Latino(a) White Asian/PI B/AA Latino(a) White
13DIABETES FIGURE 12
Diabetes is a disease in which the body loses the ability to manage
blood sugar levels. There are three types; Type 1 (usually juvenile Newly reported past or present Hepatitis C cases in San
onset), Type 2 (adult onset), and gestational or pregnancy-related Francisco per 100,000 people, 2013
diabetes. Diabetes can lead to heart disease, kidney failure, blindness
and lower-extremity amputations. Babies born to mothers with
gestational diabetes may suffer from excessive birth weight, preterm
birth, respiratory distress syndrome, low blood sugar, and type 2
diabetes later in life.
Risk factors for diabetes include cardiovascular disease or obesity, or
lifestyle factors such as consumption of sugary drinks and exercising
fewer than three times a week. Other environmental and social factors
have also been associated; for example, San Francisco residents
living in households earning less than 300% of the Federal Poverty
Level (FPL), or living in the eastern (historically B/AA) sections of the
city, are more likely to be hospitalized due to diabetes than those with
higher incomes or living elsewhere in San Francisco.
All of these factors contribute to the unequal distribution of this
disease, with Black/African Americans and Latinos at higher risk for
diabetes. Diabetes hospitalization rates were significantly higher among
Black/African Americans (40.31 per 10,000 residents) and Latinos
(12.55) than Whites (6.04) and Asian Pacific Islanders (API) (3.71)
| San Francisco Department of Public Health | Black/African-American Health Report
[Figure 11]. Notably, hospitalization rates for diabetes among Black/
African Americans increased between 2005 and 2014 while rates for
MATERNAL/INFANT HEALTH
other ethnicities have remained relatively constant or declined.
Healthy birth is less assured for B/AA women than for other women in
San Francisco. Though San Francisco had only 10 maternal deaths in
HEPATITIS C
10 years (2005-2016), 5 of them were B/AA women, despite the fact
Hepatitis C (HCV) is a common infection which can lead to liver cancer, that B/AA women account for only 4% of all births.13 Similarly, preterm
and is the leading reason for liver transplants in the United States. births are nearly twice as likely to occur for B/AA women as white
Death from HCV is actually more common than from HIV in the last women in San Francisco (12.7% vs. 7.%1 of live births, Figure 13).
decade. In San Francisco, as in the United States generally, HCV is Preterm births are those that occur before the 37th week of pregnancy,
more common among Black/African Americans than others in San and these infants are likely to have some level of poor health related
Francisco. There are also more newly reported cases of HCV infection to underdevelopment. Preterm birth is also a leading cause of infant
in Black/African Americans per 100,000 residents than any other race/ deaths; the rate of infant deaths is 5 times higher for Black/African
ethnicity [Figure 12]. Americans than Whites.
14FIGURE 13 FIGURE 14
Live Births That Occurred before 37 Weeks Gestation, by Rate of HIV Infections per 100,000 by Year of Diagnosis
Ethnicity (San Francisco, CA)
100
20 White
African American
80
Latina
Other
15 60
40
10
20
0
5
2008–2010 2011–2013 2014–2016
06
07
08
09
10
11
12
13
14
15
16
20
20
20
20
20
20
20
20
20
20
20
B/AA All SF Multi-race Latina Asian White
| San Francisco Department of Public Health | Black/African-American Health Report
Although San Francisco meets the targets for preterm birth set by though education is known as a protective factor, a college educated
Healthy People 2020, B/AA mothers and babies are still suffering B/AA woman has essentially the same risk of preterm birth as a white
disproportionally from this burden. There has been some improvement woman without a high school diploma (10.5 per 100 births vs. 10.4
in this indicator over recent years. In 2008-10, 13.8% of B/AA live per 100 births).14 Evidence is growing that experiences of racism are a
births were preterm, and in 2014-16 only 12.7% were preterm. risk factor for preterm birth, which may explain the persistence of this
However, this is still substantially higher than the national Healthy disparity despite other protective factors.
People 2020 Target of 9.4%.
The risk factors that contribute to preterm birth are physical and SEXUAL HEALTH
psychosocial. Medical risk factors include hypertension, diabetes, Sexual health includes both sexually transmitted infections (STIs) as well
sexually transmitted infections and other conditions. Social as conditions impacting reproduction. Chlamydia and gonorrhea are the
factors include use of tobacco, alcohol or drug use, living in low most common bacterial STIs, and both can lead to serious complications
income neighborhoods, lack of education and other signs of lower in women including infertility, ectopic pregnancy and pelvic inflammatory
socioeconomic status. Many of these risk factors are more common disease. HIV is the most serious of the sexually transmitted viral
among B/AA women, however even when they are not present infections and can lead to serious illness and death. These infections are
B/AA women still have higher rates of preterm birth; for example, even all treatable and many are curable.
15Many of the sexually transmitted infections, including chlamydia,
gonorrhea and HIV, occur at higher rates in B/AA residents in San
Francisco and nationally. In 2014, rates of chlamydia, gonorrhea, and
early latent syphilis were 6, 13, and 7 times higher among Black/African
Americans, respectively, than among Asians, who experience the lowest
rates of STIs in San Francisco. HIV infections are also higher among
B/AA San Francisco residents [Figure 14]. In 2016, newly diagnosed
persons with HIV were more likely B/AA than any other group, with
smaller disparities seen for Latinos and Asian/ Pacific Islanders. Pre-
exposure prophylaxis (PrEP) use is also lower for B/AA than other San
Franciscans. However, all groups have increased use in the last 5 years,
though without decreasing the disparity gap.15
| San Francisco Department of Public Health | Black/African-American Health Report
16SECTION 2: THE BLACK/AFRICAN-
AMERICAN HEALTH INITIATIVE (BAAHI)
BAAHI Workgroups and Goals
HEART HEALTH: reduce the percentage of Blacks/ SEXUAL HEALTH: reduce the rate of Chlamydia among teenage and transitional
African Americans with heart disease age young B/AA women.
Co-leads Dr. Ellen Chen and Jacque McCright Co-leads Shivaun Nestor, Dr. Susan Philip
WOMEN’S HEALTH: reduce the mortality rate of B/AA CULTURAL HUMILITY: increase cultural humility practices in the department.
women with breast cancer (focus shifted to preterm birth) Co-leads John Grimes, Michelle Long
Initial co-leads Barbara Cicerelli and Veronica Shepard
WORKFORCE DEVELOPMENT: increase recruitment, retention and
BEHAVIORAL HEALTH: advancement of B/AA staff in the department. (role shifted to human resources)
reduce the mortality rate among B/AA men due to alcohol Lead Rhonda Simmons.
Co-leads Dr. Judith Martin and Israel Nieves
In 2014, members of both divisions of SFDPH convened to ad- were established to support activities intended to improve care
dress B/AA health disparities; the Population Health Division for Black/African Americans more generally; Cultural Humility,
which holds the public health functions of health promotion and focused on training staff to understand structural and institutional
health education, epidemiology, disease surveillance and environ- racism and implicit bias that impact Black/African Americans and
| San Francisco Department of Public Health | Black/African-American Health Report
mental health; and the San Francisco Health Network, the group other marginalized groups; and Workforce Development, focused
of hospitals and clinics operated by the health department. The on improving workforce diversity, inclusion, and mobility for
Black/African American Health Initiative (BAAHI) was chartered underrepresented staff to better reflect the communities we serve.
by this group in 2014 as a collaboration across SFPDH divisions
The first 3 years of the initiative invested heavily in creating
and branches. The intention was to develop activities that would
infrastructure; creating a governance structure, establishing cross-
impact a specific set of B/ AA health indicators. The first indicators
divisional working groups, planning/piloting activities, and hiring
the group intended to improve were in 4 areas chosen to span the
backbone staff. In the following pages, each workgroup is outlined
life-course [see next section].
in more detail.
A collective impact work group was formed to identify ways for the
SFDPH to improve these indicators. Two additional workgroups
BAAHI Staff : Dr. Ayanna Bennett, Director of Interdivisional Initiatives Vincent Fuqua, Health Program Coordinator
Gavin Morrow-Hall, Collective Impact Coordinator Tracy Shaw Senigar, Health Worker 2 17BAAHI structure
BAAHI is modeled as a collective impact project, in line with the model all major units and divisions, significantly increasing the participation
articulated by Kania and Kramer in 2011.16 The initial structure and its of clinical units. The Steering Committee, over the course of 2017,
subsequent evolution are described in the pages that follow. [Figure16]. re-chartered the initiative to recognize the transition from infrastructure
The initial six workgroups are described in the pages that follow. building to implementation. That new charter outlines a system of
watch metrics that create a broader picture of B/AA health impacted
Initially, oversight was provided by a small group called the Design by various programs across the department; and a focused list of
Team, made up of selected management, executive, and front-line active metrics that define the goals of the shared improvement work
staff from various areas of the department. In late 2016 that group was overseen by the committee [Figure 17].
restructured as the BAAHI Steering Committee to include leaders from
FIGURE 16 FIGURE 17
Area Population Indicator
Cardiovascular Hypertension
Health hospitalization
Sexual Health Chlamydia incidence
Infant and
Maternal Premature Birth
Health
Behavioral
| San Francisco Department of Public Health | Black/African-American Health Report
Alcohol related deaths
Health
Breast Cancer
Cancer mortality rate
Lung Cancer Rate
Adult Diabetes
Hospitalizations
Diabetes
due to long term
complications
Pediatric Asthma
hospitalization
Asthma
Adult Asthma
Modified from a model from FSG hospitalization
Communicable New HIV infections
Disease Hep C incidence
Violence Violent injury Incidence
18 see CHNA 2016 Appendices for data in these areas4BAAHI Workgroups
HEART HEALTH The workgroup plan for the next year includes several expansions
of these programs:
Goal: eliminate hypertension control disparity
Primary Care leadership, came together with the leadership from the 1. Provide focused support for four clinics with the highest
Community Health Equity and Promotion branch of Population Health populations of B/AA patients with hypertension
to co-chair the BAAHI Heart Health Workgroup. The San Francisco 2. Integrate disparity data into daily management activities
Health Network clinics set an equity goal of eliminating the disparity in to message equity to clinicians as a priority
hypertension control for B/AA patients soon after the start of BAAHI.
3. Develop tailored outreach materials to strengthen patient
This connected well with a Population Health project called Healthy engagement and collect data
Hearts SF—a CDC Million Hearts Initiative that focuses on primary
4. Incorporate communication tools for discussing
prevention and management.
disparities in nurse and doctor chronic care visits
Accomplishments: Increased hypertension control 5. Iterate the strategies for Food Pharmacy and nurse/
doctor chronic care visits
among B/AA patients from 53% to 62%
In the San Francisco Health Network (SFHN), blood pressure (BP) 6. Partner with Zuckerberg San Francisco General
control rates for patients diagnosed with hypertension from January Hospital’s (ZSFG) Million Hearts campaign to raise
2015 to December 2017 have increased from 61% to 70% for the awareness with focus on B/AA patients
overall population and 53% to 62% for the Black/African-American
population [Figure 18]. This is a substantial improvement for all FIGURE 18
groups. However, the disparity gap in BP control between the overall
| San Francisco Department of Public Health | Black/African-American Health Report
population and B/AA patients remains at 8%. This is a common
Blood Pressure Control Rates (San Francisco, CA)
occurrence in clinical improvement projects where new efforts
75
bring benefits to all patients, and disparities persist. The goal of the
group is to specifically work against this problem, focusing efforts to
70
increase the rate of BP control among B/AA hypertensive patients
to narrow the disparity gap between B/AA patients and the overall 65
population to just 2% in the next year.
60
Future Plans: focus on quality improvement and
patient communication in clinics, continue food 55
pharmacy roll-out, raise community awareness of
50
heart health
0
January 2015 December 2017
All patients Black / African American
19FIGURE 19 Future Plans: Shifting active work to Preterm Birth
with plans in development.
In early 2018, the Steering Committee recommended shifting the
SFHN Mammogram screening
focus of active BAAHII work on women’s health to efforts to reduce
80 preterm birth among B/AA women, who have the highest rate of any
group locally (13.9% of B/AA births in 2015 vs 7.3% of white births in
75 SF). There are large concerted efforts to decrease the preterm birth
disparity for B/AA women and infants. The Preterm Birth Initiative (PTBi)
70 is a multi-national, multi-faceted intervention to prevent preterm birth
outcomes based at UCSF, and funded by the Benioff Foundation. The
65 Maternal Child and Adolescent Health branch of the San Francisco
Health Network, along with the Center for Learning Innovation branch
60 of Population Health co-administer a collective impact community-
based arm of the initiative. BAAHI staff are currently investigating how
0
centralized support from SFDPH leadership and collaboration across
April 2014 April 2015 April 2016
divisions might expand or enrich the work of the current program.
B/AA All Target
SEXUAL HEALTH
WOMEN’S HEALTH Goal: increase Chlamydia screening in SFPDH clinics
Goal: Breast Cancer – eliminating the gap in to 90% in youth clinics, >60% in primary care clinics
mammography screening for B/AA women This workgroup brings together the Disease Prevention and Control
The women’s health workgroup initially focused on breast cancer. The and Community Health Equity and Promotion branches of Population
| San Francisco Department of Public Health | Black/African-American Health Report
mortality rate of B/AA women diagnosed with breast cancer is twice that Health, the Family Planning program in Maternal Child Adolescent
of other women in San Francisco. Conversely, the screening rate for B/AA Health within SFHN, and the clinical sites offering sexual health
women was less than that of other women. The initial work of the group services. The group is focused on decreasing Chlamydia rates for B/
centered on improving screening rates for B/AA women, educating staff of AA young women in San Francisco, which are 5.5 times higher than
the need for focused work and clarifying gaps in the system. for White San Francisco young women. The initial focus has been on
increasing clinic screening rates at SFHN clinics that serve the highest
Accomplishments: Breast Cancer numbers of B/AA youth, beginning with the youth clinics (Community
The breast cancer workgroup had an initial focus on screening Health Programs for Youth, CHPY), Children’s Health Center at ZSFG,
mammogram rates which were known to have a disparity of 10% Potrero Hill Health Center, and Maxine Hall Health Center.
between B/AA and all SFHN women patients. The rate of screening
did increase from a baseline of 60% to 64% in the first two years Accomplishments: raised Chlamydia screening rates
then decreased to 58%. Breast cancer screening recommendations from 61% to 95% in SFDPH youth clinics
changed during course of this activity changing the expectations for Efforts began in 2015 with training and quality improvements
patients. Clinics are currently working within the new standards to efforts in the CHPY clinics, raising the collective testing rate across
monitor breast cancer screening rates internally. these clinics from 61% to 95% [Figure 20]. Efforts in the primary
20 care clinics are in the early stages.Future Plans: improve sexual health care in the FIGURE 20
clinics, educate young B/AA women on healthy
communication about sex, host a community
summit on reproductive justice
Chlamydia testing rates at youth clinics, by site
The larger goal of the group is to ensure good reproductive and
sexual health care and education for B/AA young women, with 100
the goal of improving communication about sex, increasing rates
of condom use, and improving the culturally-appropriate sexual 90
health programs and services. Over the next year the group plans
to achieve this through several steps: 80
1. Discussion groups with B/AA youth and other community 70
members, service providers, and staff from Black Infant
Health and Community Health Programs for Youth to 60
generate shared understanding of the relevant barriers
and opportunities. 50
2. Collaboration between the Family Planning program and a 40
SFDPH peer-education program called Youth United Through
Health Education. The group is creating a community 0
education initiative to increase STI awareness in March 2017
key communities.
3. Holding a reproductive health summit in 2019 focused on
reproductive justice.
4. Continued training for providers on the value and skills of
sexual health history for all patients at all visits.
| San Francisco Department of Public Health | Black/African-American Health Report
BEHAVIORAL HEALTH
Accomplishments:
Goal: Eliminate the disparity in alcohol use disorder • Developed patient materials with input from staff and patients
treatment medication use for B/AA men on alcohol treatment medications tailored to B/AA men.
The behavioral health workgroup is focused on alcohol use in B/
• Convened a day-long training on racial humility for all the
AA men. Despite having lower rates of alcohol use disorder, B/AA
mental health psychiatrists, nurse practitioners, and clinical
men have nearly double the rate of death from cirrhosis of the liver
pharmacists - all of whom prescribe medications.
as white men. The workgroup did an analysis of the data, as well as
focus groups with patients and staff, to develop an understanding
of differences in care for B/AA men in the SFDPH substance
Future Plans:
abuse (SA) clinics. The data analysis showed that B/AA men were The plan for the coming year is continue improvement activities
prescribed medication for treatment for alcohol use disorder much in clinics to ensure 10% of B/AA men with alcohol use disorder
less than white men. Focus groups clarified that this difference will have an active prescription for treatment medication. This
was due to fewer offers of medication from substance abuse clinic measure is considered a watch metric for the BAAHI Steering
providers. The patient and staff focus groups also noted differences Committee and is being monitored as an internal quality measure
in the welcome offered to B/AA men in the clinics. in Behavioral Health. 21CULTURAL HUMILITY WORKFORCE DEVELOPMENT
Goal: Create an organizational culture of equity Goal: improved recruitment, hiring, advancement and
The workgroup highlighted the need to acknowledge and inclusion of B/AA staff
understand the impact of racism on health, confront implicit bias, Over the initial years of BAAHI the group highlighted issues including
create systems to ensure equitable care and service for B/AA the lack of accurate data, the lack of centralized oversight of hiring,
residents and all residents. lack of explicit anti-bias focus in hiring, and structural barriers in the
system. This led to the extraction and analysis of SFPDH workforce
Accomplishments: Over 500 staff, including over 300 demographic data, showing staff demographics that do no match
managers, completed a 4 day racial equity training the SFDPH service population. The group also highlighted issues in
The Cultural Humility workgroup focused its work initially on leadership mobility for B/AA staff members.
training to facilitate policy change. The workgroup encouraged the
creation of a racial humility in-service training for executives, directors Accomplishments: New hiring standards created, new
and managers facilitated by Dr. Kenneth Hardy, a nationally renowned unit of HR created to improve oversight and program
speaker and educator on race and racism. The training, begun in 2014, development around equity
is offered several times per year and occurs over 4 full days. Dr. Hardy’s • Video on anti-bias interviewing techniques mandatory for all
approach works to raise awareness of racism as an organizing force in hiring panel members
society, as well an unacknowledged actor in interpersonal relationships. • HR oversight of hiring panel diversity
As of early 2018, over 500 SFDPH staff had been through the training,
• Improved collection of race/ethnicity data in staff profiles,
most of them in management or executive positions. In 2017 a full
allowing reporting of staff diversity
time staff person was added to organize the training and develop
other training opportunities for line staff. That development process is • Hiring of recruitment staff with a focus on improved diversity of
ongoing. Additional activities have been developed by staff, including applicant pools
| San Francisco Department of Public Health | Black/African-American Health Report
site-specific workgroups and a discussion series. • Creation of the Office of Diversity, Inclusion and Workforce
Development (ODIW) as a new Human Resources unit.
Future Plans:
• Continued training with Dr. Hardy for management staff Future Plans:
through 2018 Human resources staff are currently working on an Equity Action Plan
• Ongoing development of activities to further discussion about to direct equity efforts around hiring and advancement. The above
cultural humility within work units. activities are being continued and expanded.
• Training for line staff in cultural humility and implicit bias
planned for 2018-19
• Expansion of BAAHI Equity Learning Series discussion groups to
support staff learning about the impact of racism on health and
equity-focused health programming and policy Over 500 staff completed a 4 day
racial equity training
22The BAAHI Learning Community spark discussion around B/AA health and health inequities generally.
ELS groups are active at the Population Health Division and at ZSFG.
As part of the development of a sustainable infrastructure, the BAAHI Future groups are planned in other areas of the department. Recent
backbone staff expanded from a single administrative staff person examples of topics addressed in ELS include:
to an executive lead with several support staff. That has allowed an
• Defining Cultural Competence: A Practical Framework for Addressing
expansion of activities outside of the workgroups, focused primarily on
Racial/Ethnic Disparities in Health and Health Care
offering opportunities for staff to learn about B/AA health disparities,
best practices in creating equity, and form relationships with coworkers • Physicians and Implicit Bias: How Doctors May Unwittingly Perpetuate
tackling similar issues. The goals of the learning community are Health Care Disparities
two-fold. First, the increased awareness of B/AA health disparities
generates new work around B/AA health, which must occur in all areas • Racism and Health I: Pathways and Scientific Evidence
of the department to impact the wide array of disparities. Secondly, • Under the Shadow of Tuskegee: African Americans and Health Care
and crucially, the work aims to normalize the discussion of race,
inequity and racism among staff.
Initially, the only specific non-clinical BAAHI activity was the Think Beyond BAAHI
Tank, a meeting that brought together invited staff to discuss the
The focus on B/AA health extends beyond BAAHI. The disparities in
workgroup activities. That meeting has since been opened to all staff
health are so wide ranging that increased attention to B/AA residents
and reformulated as a learning community where equity projects across
is warranted across SFDPH based solely on the need evident in the
the department are shared, and expert speakers deliver educational
data. Here is a limited review of efforts to improve B/AA health across
material. Examples of Think Tank speakers and topics include:
the department. The list is not exhaustive, but is representative of the
• The Intersection of Black Lives Matter and Public Health - variety of work being done.
Jessica Brown, Center for Learning and Innovation,
| San Francisco Department of Public Health | Black/African-American Health Report
Population Health Division BLACK/AFRICAN AMERICAN WELLNESS PEER LEADERSHIP (BAAWPL)
• Alcohol Treatment Medication Use: Addressing Racial In 2017, the Population Health Division of the SFDPH awarded over $1
Disparity in Deaths From Alcohol - million in funding to two local organizations to deliver health promotion
Dr. Judith Martin, Medical Director, Substance Use Services services to the Black African/American population. Rafiki Coalition and
Bayview YMCA were the two awardees and complete their first year
• Black to The Future - of programming in June 2018. The agencies deliver services in five
Sheryl Davis, Director of the Human Rights Commission modalities; Outreach & Engagement, Wellness Promotion, Screening
& Assessment, Individual & Group Therapeutic Services, and Service
• Reaping the Harvest of Success in HIV for Black Residents -
Linkage. Beyond services, the BAAWPL awardees were asked to meet
Getting to Zero panel presentation
new standards of collaboration and evaluation. Over the last year,
In addition to the Think Tank, a more distributed learning community, the agencies have shared programming in new ways, tried innovative
called the Equity Learning Series (ELS), is being introduced across the approaches to health and gotten positive feedback from the community.
department. The Series brings articles, videos and speakers to staff to Positive examples include an Afro-Vegan nutrition class at Rafiki, an
23intergenerational men’s support group at the Bayview YMCA, and GETTING TO ZERO (HIV/AIDS)
joint bike rides and hikes shared between the two groups. Evaluation From the early days of the HIV/AIDS epidemic there has been a
data over the coming years will help show how these approaches are disparity in incidence among racial groups. Due to the widespread
promoting healthy living among participants, and impacting community use of HIV prevention tools, there has been a decline in HIV infection
health overall. rate; however, disparities remain. SFDPH, various community based
organizations, and community leaders in San Francisco have come
BLACK/AFRICAN AMERICAN FAMILY BEHAVIORAL HEALTH SERVICES together to form the Getting to Zero initiative (GTZ). The purpose of
this group is to get to zero HIV infections, zero HIV-related deaths, and
SFDPH Children, Youth and Families System of Care issued the
zero stigma. The tools used by the initiative include HIV education,
Black/African American Family Behavioral Health Services (B/
counseling, social media campaigns, testing, linkage to care for
AAFBHS) Request for Qualifications (RFQ) in 2018. The program
treatment, post-exposure prophylaxis (PEP), pre-exposure prophylaxis
is a collaboration with the Department of Children, Youth & Their
(PreP), and viral suppression. Specific programming has been created
Families (DCYF) to identify a list of qualified applicants with proven
to improve access to these tools in the B/AA community, including
experience in advocacy, engagement, behavioral health treatment,
directed education around PrEP, improved access to testing and
and community capacity building activities that support the emotional
focused outreach.
health and well-being of B/AA children, youth, and their families in San
Francisco, or a similarly diverse urban environment. The B/AAFBHS
strategy represents an intentional and focused investment to expand SAN FRANCISCO TOBACCO FREE
access to effective, culturally responsive behavioral health treatment The SF Tobacco Free Coalition is a project supported by SFDPH.
and supports for B/AA children, youth and families. The final program The group explicitly focuses on community leadership in populations
design will include increased access to behavioral health providers disproportionately affected by smoking. Grants to community agencies
in the community and greater coordination and capacity among offer training in community-based participatory research and advocacy.
organizations serving B/AA families. The coalition championed the current campaign to eliminate menthol
| San Francisco Department of Public Health | Black/African-American Health Report
flavored tobacco products in the city, responding to the documented
END HEP C SF history that these products were targeted to B/AA communities and
lead to high smoking rates. SFDPH also funds cessation services
Local data show that hepatitis C (Hep C) disproportionately impacts
specifically directed at B/AA smokers. In 2018, new funding will
San Francisco’s Black/African American population, as it does
enhance tobacco related services tailored to reduce smoking in the B/
throughout the nation. A coalition, including the health department,
AA community.
came together as the END Hep C Task Force to expand access to
newly available curative treatment for Hep C, and promote services
to decrease the number of new Hep C infections. In order to reduce HEALTHY HEARTS
the disparity of Hep C among Black/African Americans, the End Healthy Hearts is a CDC funded program designed to reduce heart
Hepatitis C Task Force is providing education and testing to the B/AA disease disparities in the B/AA and Latino communities. SFDPH is
community by partnering with service providers and residents in B/ using these funds for activities that support the BAAHI hypertension
AA communities. The Task Force has also taken deliberate action to project, as well as other community and clinic based services. In
include B/AA community members in the decision making and planning particular, navigators were placed at primary care clinical sites with
process on multiple levels. high proportions of B/AA or Latino patients to assist these patients in
24taking advantage of available services. The navigators also support • Assessing disparities: Integrate equity coaching into various
expanded services like walking groups at ZSFG and Southeast Health ZSFG initiatives;
Center, as well as the food pharmacy program. Navigators also
• Monitoring and supporting ZSFG participation in the SFPDH-wide
support a program of activity and park prescriptions; these are printed
Sexual Orientation & Gender Identity training initiative;
prescriptions from medical providers in the clinic that direct patients to
SFDPH funded community health promotion activities (eg. the YMCA • Utilizing race, ethnicity and language data to better understand patient
exercise programs) or to public park-based activities offered by the needs, guide decision-making and promote continuous improvement.
Parks and Recreation Department.
LAGUNA HONDA HOSPITAL (LHH)
CAVITY FREE SF
Laguna Honda staff have focused on training and recruitment in 2017.
The San Francisco Health Improvement Project, with support from the Leadership implemented training in cultural humility and implicit bias at
Metta and Hellman foundations, formed a working group around children’s all levels of staff with assistance from the City and County Department
oral health in 2011. Among the groups findings was that children entering of Human Resources. Staff have formed a workgroup focused on using
kindergarten in San Francisco, high rates of dental decay are seen in Lean continuous improvement tools to integrate equity practices into
Chinese, B/AA and Latino children. That group led to a collaboration the workplace, as well as a reading series and targeted events. LHH is
between SFDPH, UCSF and community members called Cavity Free SF working to pilot workplace bias training in 2018.
that is committed to reducing the oral health disparity in San Francisco.
In the last several years the project has focused on expanding the use of
HOPE SF WELLNESS PROGRAM
fluoride varnish by public and private medical providers, as well as public
education in the Chinatown and Bayview neighborhoods. The initiative Hope SF is an ambitious public housing redesign initiative to create
has shown a great impact on preventative health practices in Medi-Cal mixed income housing without displacement. The initiative combines
providers as well as some early improvements in cavity rates among efforts from multiple city agencies, including SFDPH, to improve
| San Francisco Department of Public Health | Black/African-American Health Report
entering kindergarteners. conditions for housing residents. The program borrows from the most
successful national models to focus on revitalizing the whole community,
not just on constructing new buildings in the four target sites: Hunters
THE ZUCKERBERG SAN FRANCISCO GENERAL EQUITY COUNCIL
View, Potrero Terrace, Sunnydale, and Alice Griffith. This work is relevant
In 2017, Zuckerberg San Francisco General Hospital (ZSFG) established to B/AA health because the Hope SF residents are 31% Black/African
an Equity Council with leaders and front-line staff to empower staff to American. Each Hope SF site is planned to include a Wellness Program,
eliminate disparities and promote inclusion. The council does not have operated by SFDPH and staffed by behavioral clinicians, peer educators
an exclusive focus on B/AA health. However, its focus on disparities and nursing staff. The Wellness Centers also offer an array of community
necessarily places the poor health of B/AA patients at the forefront, building and health promotion services like parenting and nutrition
aligning it fully with the goals of BAAHI. The council’s priorities are: classes. This is responsive to data showing that public housing residents
are more likely to suffer from conditions like obesity, hypertension,
• Developing our people: Communicate with all levels of the
asthma, diabetes and cardiovascular disease.17
organizations about equity-related initiatives, lessons learned and
best practices;
25You can also read