HOME: A PATHWAY TO HEALTH EQUITY THROUGH HOUSING - RESEARCH AND DATA AN ASSESSMENT OF THE CONNECTION BETWEEN HOUSING & HEALTH IN PINELLAS COUNTY ...
←
→
Page content transcription
If your browser does not render page correctly, please read the page content below
2018

HOME: A PATHWAY
TO HEALTH EQUITY
THROUGH HOUSING
AN ASSESSMENT OF THE CONNECTION BETWEEN
HOUSING & HEALTH IN PINELLAS COUNTY, FLORIDA

A J O I N T P R OJ E C T O F

    RESEARCH
    AND DATA
     FOR HEALTH EQUITY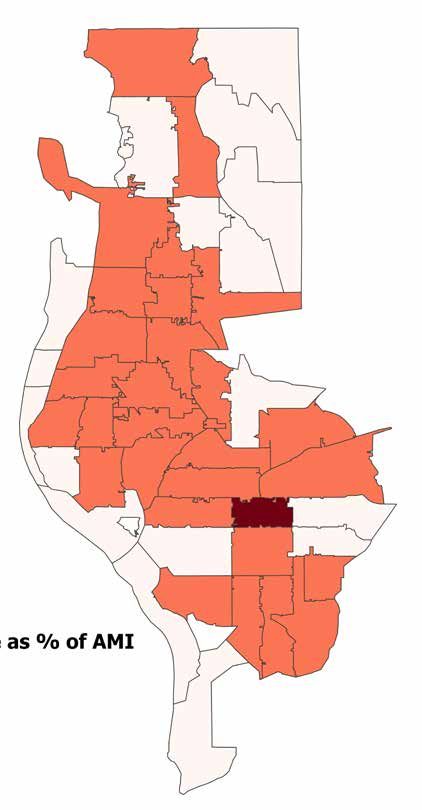
The Foundation for a Healthy St. Petersburg is a private foundation formed in 2013 following
the sale of the nonprofit Bayfront Health St. Petersburg. It is the steward of almost $180 million
in assets to support health equity in Pinellas County. The Foundation inspires and empowers
people, ideas, information exchange, organizations and relationships to end differences in
health due to social or structural disadvantages and improve population health.

Collaborative Solutions, Inc. is a national organization, based in Birmingham, Alabama, that
works to impact the system of housing throughout the United States to ensure that vulnerable
populations are adequately housed and can access supportive services. Through the delivery
of training, technical assistance, research, and targeted community initiatives, Collaborative
Solutions helps to strategically build the capacity of local communities and various types of
organizations, while also helping them maximize their long-term community impact in the
areas of housing, health and services.
W E LC O M E

         The purpose of this report is to better understand the housing needs in
       Pinellas County through the lens of health equity. This report begins a journey
       to bring together community partners from multiple systems and sectors,
       including nonprofits, governments, corporations and faith communities, to
       examine and act upon the underlying conditions that continue to promote
       social injustices and inequities that shape health outcomes. Housing inequities
       are a major driver of disparate health outcomes in our community. This report
       explores the social and structural inequities of housing while exploring system
       and sector opportunities to forge a countywide effort to create safe, decent,
       and affordable housing for everyone.
         This assessment is a guide not a destination. The housing needs faced in
       the county will only be met when imagination, political will, and community
       ownership are awakened. The role of the Foundation will be to cajole, point,
       and push toward a vision of housing as a major intervention to achieve health
       equity in our community. We hope that this report not only motivates additional
       questions and calls us to inquire deeply into the issue, but also compels urgent
       action to solve the housing inequities in our community.
         Housing is the equitizing factor capable of exponentially and expeditiously
       moving our community toward health and well-being for all. The Foundation
       is prepared to focus on housing for the next several decades. Dismantling the
       embedded historical, social and structural barriers to equitable housing will
       require a steadfast, long-term commitment.
         There is nothing short-term, episodic, or isolated about the housing crisis,
       and solutions to it will require challenging multi-sector work at the systems
       level. As such, the Foundation will support a convening process designed to
       discover and implement multiple interventions over the course of decades.
       We hope this report will help readers find their path to engagement with the
       critical housing issues confronting Pinellas County.

PINELLAS COUNTY                                                                           3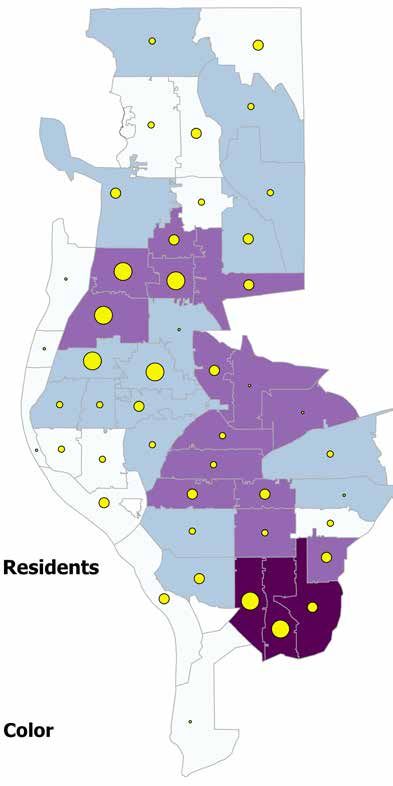
TA B L E O F C O N T E N T S

               STATEMENT FROM PRESIDENT & CEO					                                       5
               FOREWARD: A NATIONAL PERSPECTIVE 					                                    6
               QUICK FACTS									7
               TERMINOLOGY								8
               STRATEGIC RECOMMENDATIONS						9
                 Increase Collaboration							9
                 Increase Housing for Extremely Low-Income Households		                  10
                 Preserve Existing Affordable Housing					10
                 Create Data-Driven Strategies						10
                 Eliminate Housing Inequities						10
               INTRODUCTION: A JOURNEY TO HOUSING & HEALTH EQUITY		                      12
               HEALTH EQUITY AND HOUSING						14
                 Housing Is Health								14
                 Housing: A Mechanism Toward Health Equity				                           17
               HOUSING AND HEALTH EQUITY ANALYSIS					                                   18
                 Pinellas County Health Outcomes:
                 Length of Life, Quality of Life, and Health Factors			                  19
                 County Inequities: Race/Ethnicity, Income, and Geography		              22
                 The 4 “A’s” of Housing - Affordability, Accessibility,
                 Availability, and Adequacy						25
                    Affordability								25
                    Availability								32
                    Accessibility								35
                    Adequacy								37
               KEY CHALLENGES AND GAPS						38
               CONCLUSION									40
               REFERENCES									41
               FIGURES, GRAPHS, TABLES, MAPS						43

4                                  H O U S I N G & H E A LT H E Q U I T Y A S S E S S M E N T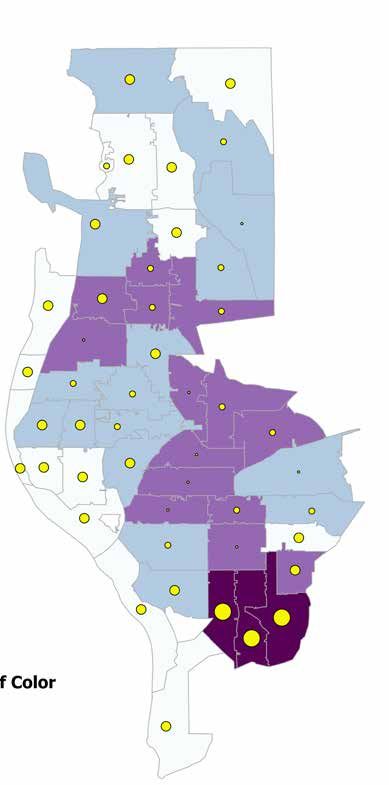
S TAT E M E N T F R O M P R E S I D E N T & C E O

         Randall H.        This research into the state of housing in Pinellas County was motivated by an important
                           truth held by this Foundation: if we improve equity in housing, the health of county residents
           Russell         will improve. Housing is a basic need that touches all aspects of human well-being, from
      President & CEO      physical health, to our sense of community, to our fundamental dignity and humanity.

FOUNDATION FOR A HEALTHY
                           Research and data are critical tools for shining a light on the dis-equity that prevails in
          ST. PETERSBURG   our current countywide housing ecosystem. Bringing this report to the attention of people
                           who care about housing will strengthen the social justice dimension of the groundswell of
                           conversation and action taking place.
                           As basic as it is to health and human dignity, housing is an area with some of the greatest
                           inequities responsible for some of the most damaging health effects. These burdens fall
                           disproportionately on the poor, the disabled, and persons of color who have traditionally
                           faced—and continue to face—discriminatory policies and other barriers to home ownership
                           and fair access to quality rental housing. The Foundation’s mission calls us to stay laser-
                           focused on those who face these social and structural barriers to housing and health equity.
                           What is particularly striking about the data presented here is how far-reaching the
                           consequences of our broken housing system truly are. The shortage of subsidized and
                           affordable housing, the mismatch between housing stock and people’s needs, and
                           the rising cost of rent and home ownership threaten many Pinellas County residents—
                           not only the working poor, but also middle-income residents. The situation is a drag
                           on community health and on regional economic prosperity, and it can no longer
                           be ignored.
                           Strengths and assets also figure into the countywide housing equation, however.
                           Among them are many dedicated housing providers, advocates and activists along the
                           homeless-to-housing continuum, working every day to help people find a place to live
                           and to create homes, apartments, and temporary shelters for our growing population.
                           The timing is in our favor as well. There is broad public support for making housing
                           a priority, as we learned via numerous community listening sessions sponsored
                           by the Foundation, research and analysis, and a preponderance of housing-related
                           grant applications and project proposals submitted to us over our first three years
                           of work in the community. Policymakers are mobilized. And business leaders are
                           keenly aware that quality housing is a competitive advantage in hiring, recruiting and
                           retaining employees.
                           It will take all these sectors and more working together over many years to build a better
                           and more equitable housing system. That’s why this Foundation has committed to housing
                           as one of our top four priorities, along with education, food and nutrition and income equity.
                           We will begin a housing convening in early 2019 and remain committed to it for as long
                           as it takes. We invite those who care about this issue to lend your wisdom, expertise and
                           leadership to this important issue.
                           It may be a decades-long effort, but the campaign for health equity through housing will
                           begin to accrue benefits from day one in the form of better living conditions for our many
                           neighbors who are struggling. We’re eager to begin and ready to support a community-
                           driven movement for change. Please join us!

PINELLAS COUNTY                                                                                                        5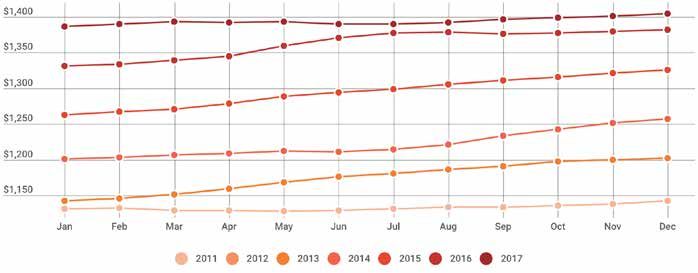
F O R E W A R D : A N AT I O N A L P E R S P E C T I V E

     Fred Karnas        It is hard to have a conversation about housing without considering the role that safe,
                        decent, and affordable housing has in creating environments that promote positive health
       Senior Fellow    and well-being. Our work at The Kresge Foundation has led us to explore, invest, and
    KRESGE FOUNDATION   partner to better understand how we can encourage and support new strategies, practices,
                        funding modalities and policies to help spur the preservation of and development of new
                        affordable housing. Embedded in this work is the recognition that these efforts will be
                        practically and morally unsuccessful if they do not result in environments and conditions
                        that promote health equity.
                        Reaching the goal of health equity, however, will not be accomplished by funders alone
                        or individual well-meaning organizations. Attaining equity must start with engaging
                        affected communities and supporting them with the tools they need to be champions for
                        themselves and their neighbors. Who better than community residents to be the crafters
                        of solutions that recognize the needs and values of places they care passionately about?
                        Learning from placed-based approaches is the added value of the efforts being undertaken
                        by the Foundation for Healthy St. Petersburg. By highlighting the successes and challenges
                        of local communities, this report illuminates the need a creates the space to explore
                        strategies, engagement methods, and funding approaches that promote the preservation
                        and development of affordable housing and serve as a vehicle for creating health equity.
                        The Foundation’s important work provides critical insights that can inform both local and
                        national policy and practice.
                        This report makes it clear that poor health outcomes associated with a lack of access to
                        affordable housing, shrinking incomes, and higher housing costs are not solely driven
                        by individual choices, but are often driven by policies outside the individual’s sphere of
                        influence. It is a call to expand efforts currently underway to address policies that fuel
                        inequity and to begin new conversations which will lead to improved health conditions in
                        Pinellas County. The report further challenges all of us to acknowledge the impact that
                        healthy affordable housing can have in changing inequities that have existed for generations
                        and persist to this day preventing households with low incomes and households of color
                        access to safe, decent, and affordable homes in which to raise their children.
                        When we raise our own awareness of the underlying inequities that form and define our
                        housing policy, shape economic opportunity, and, ultimately impact the health and well-
                        being of our communities, all of us should be called to action. My hope is that this report
                        serves as an inspiration to residents of Pinellas County and beyond, challenging us all to
                        begin conversations and create strategies to address housing and health inequities.
                        As funders, we recognize it is no longer acceptable to continue down a path where too many
                        of our neighbors are increasingly and disproportionately marginalized and where health
                        inequities are accepted as the norm. We understand, as this report so clearly points out,
                        housing, as a structural intervention, is a critical starting place. Addressing our communities
                        housing needs can, and I hope will, galvanize all of us to respond with sound policies and
                        strategies to address our housing crisis and end generations of health inequity.

6                                                    H O U S I N G & H E A LT H E Q U I T Y A S S E S S M E N T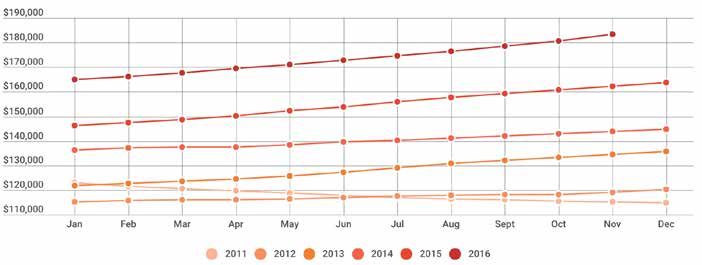
Q U I C K FACT S

Housing and Health Equity                                   • Housing instability and homelessness have been
 • Housing is a manifestation of, and contributes to          linked to an increased risk of depression and mental
                                                              illness for adults and children over their lifetimes
   the generation of, social and economic inequalities.       (Health Research and Educational Trust, 2017).
   Income and race are most consistently associated
   with differences in health outcomes and are the same     • Adults living in unaffordable housing are more likely
   factors that contribute to access to good housing and      to describe themselves as being in “fair” or “poor”
   neighborhoods (Aidala & Sumartojo, 2007).                  health compared to individuals living in affordable
 • Health inequities are often seen along the lines of        housing (Maqbool, Viveiros, & Ault, 2015).
   poverty, race, ethnicity, and geography and among        • Pinellas County contains the oldest housing stock
   the most vulnerable populations.                           among Florida counties. Older housing need
 • Homelessness    is one of the consequences of
                                                              additional upkeep and repairs. (Florida Housing
                                                              Data Clearinghouse, 2016).
   an inadequate, affordable housing supply and
   disproportionately    impacts      Black/African-        • A growing body of research suggests that stable
   American residents in Pinellas County. In Pinellas,        and affordable housing may help individuals living
   1 in 3 homeless people identify as “Black,” in             with chronic diseases, such as HIV/AIDS, diabetes,
   comparison to representing only 1 in 10 of the             and hypertension, increase their rates of medical
   county population (Lucia, 2018).                           care, maintain their treatment regimens, and
                                                              achieve better health outcomes (Aidala et al., 2016).
County Profile
 • In 2016, an estimated 940,000 residents lived in        Housing Burden
   Pinellas County and approximately 130,727 lived          • Extremely low-income residents are more likely
   in poverty (U.S. Census Bureau, 2016b).                    to be renters than homeowners – more than 52%
 • Poverty has a disproportionate impact on persons           of residents within this income bracket rent their
                                                              homes (U.S. Census Bureau, 2016c).
   of color in Pinellas County (See Maps 1 & 2,
   Table 4) - nearly 31% of those living in poverty         • In Pinellas County, 171,245 households (more
   identifying as African-American, 21% identifying           than 50% renters and over 33% homeowners) are
   as bi- or multi-racial, and 27% identifying as “other      considered “cost-burdened,” (U.S. Census Bureau,
   race (U.S. Census Bureau, 2016a).”                         2016c) meaning they pay more than 30% of their
 • In Pinellas County, the top 20% household income           income towards housing.
   is 4.8 times higher than the lowest 20% (University      • When    comparing race to cost-burdened
   of Wisconsin Population Health Institute & Robert          households, the concentration of cost-burdened
   Wood Johnson Foundation, 2018b)                            households in Pinellas County is in predominately
                                                              neighborhoods of color.
Housing and Health Connection                               • In Pinellas County, it is estimated that there is a
 • Pinellas County ranks 26th out of 67 counties in           deficit of 19,820 units for extremely low-income
   the state of Florida for overall health outcomes           households and nearly 34,000 for households at
   (University of Wisconsin Population Health Institute       or below 50% of Adjusted Median Income (National
   & Robert Wood Johnson Foundation, 2018b).                  Low Income Housing Coalition, 2018a).

PINELLAS COUNTY                                                                                                  7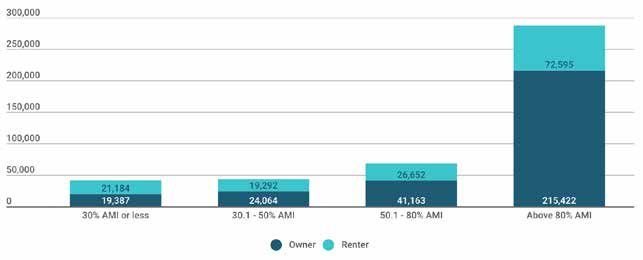
T E R M I N O LO GY

AFFORDABLE HOUSING                                              COST-BURDENED
Housing where households pay no more than 30% of their          Households are considered “cost-burdened” when paying
adjusted income toward rent and utility costs. This is the      more than 30% of income for gross rent or owner costs.
affordability marker used by U.S. Department of Housing         Gross rent includes rent paid to a landlord plus any utility
and Urban Development.                                          costs. Owner costs include mortgages, real estate taxes,
                                                                property insurance, utilities, and condominium or mobile
ACCESSIBLE HOUSING                                              home fees. A “moderately cost-burdened” household pays
Housing that is readily manageable for residents and in         30-50% of income for housing costs. A “severely cost-
proximity to community. Healthy housing is accessible to        burdened” household pays more than 50% of income for
needed community amenities.                                     housing costs.

AVAILABLE HOUSING                                               EQUITY
Units of housing affordable and currently ready                 Just and fair inclusion into a society in which all can
for occupancy.                                                  participate, prosper, and reach their full potential by
                                                                eliminating barriers and providing people with the optimal
ADEQUATE HOUSING                                                opportunity to thrive.
Safe and decent housing, including the physical condition
of the property as well as its location.                        EXTREMELY LOW-INCOME (ELI) HOUSEHOLD
                                                                Households with incomes less than or equal to 30% the
AREA MEDIAN INCOME (AMI)                                        area median income.
In this report, AMI is expressed as a percentage of median
household income for Pinellas County, adjusted for              HEALTH
household size, as determined by the U.S. Department of         State of complete physical, mental, and social well-being,
Housing and Urban Development.                                  and not merely the absence of disease or infirmity (World
                                                                Health Organization, 2018).

    HOUSEHOLD           30%          50%           80%          HEALTH EQUITY
       SIZE             AMI          AMI           AMI          Health equity means that everyone has a fair and
                                                                just opportunity to be as healthy as possible. This
    1-person           $13,450      $22,400       $35,800       requires removing obstacles to health such as poverty
                                                                and discrimination and their consequences, including
    2-people           $16,460      $25,600       $40,900       powerlessness and lack of access to good jobs with fair
                                                                pay, quality education and housing, safe environments, and
                                                                health care (Robert Wood Johnson Foundation, 2011).
    3-people           $20,780      $28,800       $46,000
                                                                HOUSING AS A HUMAN RIGHT
    4-people           $25,100      $31,950       $51,100
                                                                All people should have access to safe, decent, and
                                                                affordable housing, regardless of their race, socioeconomic
    5-people           $29,420      $34,550       $55,200       status, disability, gender, sexual orientation, or other forms
                                                                of discrimination.
    6-people           $33,740      $37,100       $59,300
                                                                SOCIAL DETERMINANT
    7-or-more people   $38,060      $39,650       $63,400       The circumstances in which people are born, grow up, live,
                                                                work and age, and the systems put in place to deal with
                                                                illness. These circumstances are in turn shaped by a wider
                                                                set of forces: economics, social policies, and politics (World
                                                                Health Organization, 2008).

8                                                            H O U S I N G & H E A LT H E Q U I T Y A S S E S S M E N T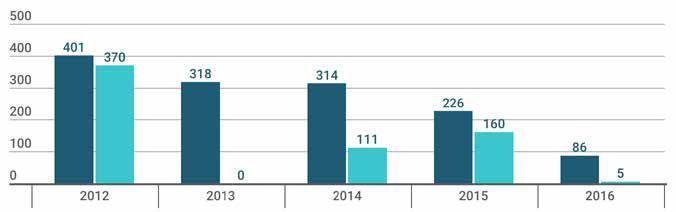
S T R AT E G I C R E C O M M E N DAT I O N S

  Because of the data explored throughout this report and through the experience of
  the Foundation, the following list highlights major trends, gaps, and opportunities.
  The Foundation is committed to seeking transformative change related to housing
  as a mechanism to promote health equity across Pinellas County.

Increase Collaboration                                      • Strives to create stronger system collaboration
                                                             and partnership between the homeless, health,
Insufficient cross-sector and cross-system                   and affordable housing advocates, providers,
collaboration and data limit effective collaboration         and developers;
that engages the entire continuum of housing and            • Coordinates  with Pinellas County Planning
health stakeholders. The Foundation’s hope is for            Department to ensure Housing Convening efforts
these silos to be reduced by developing a housing            consider the County’s 5-Year Consolidated Plan,
convening model that minimally:                              which outlines goals, strategies and objectives
 • Galvanizes     all sectors touching the housing
                                                             for addressing priority housing, homeless, special
                                                             population and community development needs;
   continuum to understand the requirements and
   limitations of their funding so solutions can be         • Addresses   the possible development of a
   identified to find alternative funding streams to fill    countywide housing strategy and plan that aims
   in the housing gaps;                                      to braid funding in a manner that coordinates
 • Assesses where and how current funding is being           financing housing production within the context
                                                             of a comprehensive community development and
   invested across the housing continuum and what            health equity strategy;
   changes could or should occur to improve housing
   equity in Pinellas County;                               • Encourages the use of Health in All Policies as a
 • Ensures collaborative efforts occur toward improving      structured protocol and practice guiding the development
                                                             of countywide housing and health standards to incite
   health equity from a social determinant lens;             systemic and transformative change;
 • Engages and empowers low-income persons and              • Reconfigures   public-private partnerships to
   persons of color to participate in the solutions          extend community ownership opportunities that
   being developed for their neighborhoods;                  drive localized influence, community assets, and
 • Analyzes  local, state, and federal policies              wealth creation;
   that may be limiting equitable and affordable            • Strengthens  and maximize the nexus between
   housing opportunities and identifying the                 housing and transit to strategically cluster
   solutions necessary to create policy change;              catalytic opportunities already underway.

PINELLAS COUNTY                                                                                                    9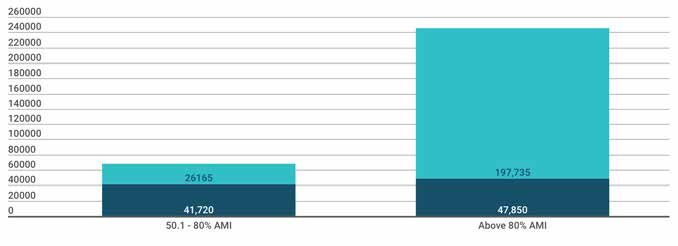
Increase Housing for Extremely                      housing agencies and owners of other HUD-
Low-Income Households                               assisted properties to convert units from their
                                                    original sources of HUD financing to project-based
Low-income residents in Pinellas County are far
                                                    Section 8 contracts, could also be considered.
more likely to pay more than half of their already
limited incomes for their housing, and the supply The dynamic growth occurring throughout Pinellas
of affordable housing for this income group is County offers unique opportunities to explore policy
extremely inadequate to meet the need. There is options to preserve affordable housing while also
also a dramatic shortage of housing stock available optimizing the scale of housing development.
to low- and extremely low-income people. Housing Create Data-Driven Strategies
strategies, inclusive of rental solutions, must
be developed that provide an ample amount of The creation of a centralized database to provide
affordable, adequate, available, and accessible reliable and up-to-date information about quality
units for extremely- to low-income residents vacant, affordable housing units in Pinellas County
making between 0-50% AMI. Such strategies may would be a very worthwhile undertaking. Without
include co-housing, limited-equity cooperatives, reliable and up-to-date information, providers,
single room occupancy and other models of shared, funders, policymakers, and residents cannot
subsidized and supported housing.                   efficiently locate affordable housing options and
                                                    gaps. The database could ideally be enhanced with
Preserve Existing Affordable                        Geographic Information System (GIS) mapping
Housing                                             technology that readily overlays housing assets
The shortage of housing for extremely low- and needs against health, economic, transit, and
income households points to the importance of safety indicators. Data should be, at minimum,
also preserving existing assisted housing, most established at the census-tract level.
of which is more than 30 years old. The shortage Eliminate Housing Inequities
also calls for further exploration on maximizing
the use of a variety of existing housing programs Housing stratification strategies that exacerbate
to address ongoing housing inequities. For problems associated with concentrations of
example, the expansion of housing subsidy minority residents and those living in poverty
programs, like Housing Choice Vouchers, to lower and minorities should be reduced or eliminated
the cost of market-rate units and developed units through thoughtful planning. Ideally, housing
constructed through the Low-Income Housing Tax opportunities should be geographically dispersed
Credit program.                                     to mitigate segregation, gentrification, and
                                                    concentrated poverty.
The preservation and rehabilitation of Pinellas
County’s public housing developments and Pockets of poverty exist in specific areas of the
older, unsubsidized but affordable multifamily county (i.e., South St. Petersburg, the Lealman
developments should be explored. Preserving Corridor, Highpoint, North Greenwood, and East
existing affordable housing options can reduce Tarpon Springs). These areas have significant
the pattern of loss. The use of HUD’s Rental health equity issues including a lack of access to
Assistance Demonstration, which allows public viable employment, reliable transportation, and

10                                               H O U S I N G & H E A LT H E Q U I T Y A S S E S S M E N T
affordable, quality housing. Affordable housing
strategies focused on these areas will have
the greatest impact on improving both access
to quality housing and other important social
determinants of health.
Overall vacancy rates of housing units in
Pinellas County hover around 17%. Exploration
should occur around how to develop strategic
partnerships with landlords to fill vacant units
with low-income residents that result in mutually- ADVOCACY & POLICY
beneficial outcomes for both residents and the
Explore policies, practices, and
owner. Best practices in Rapid Re-Housing and procedures to increase the number
Housing First principles may assist in developing of affordable housing units:
mutually-beneficial outcomes and partnerships
in tandem with an increase in Housing Choice • Inclusionary Housing
Vouchers that may be used to fill vacant units. • Health in All Policies
Due to the high number of elderly persons in • Sustainable Building and Design
Pinellas County, accessibility is a growing concern. Principles
The concepts of visitability and universal design • Establishment of a Housing Trust Fund
features can make homes adaptable to persons
• Limited-Equity Cooperatives
who require disability and/or senior-friendly
access without having a negative impact on curb • Low-Density Parking
appeal or housing values. • Low-Density Residential
With the rising cost of homeownership outpacing • Accessory Dwelling Unit
wage increases, the majority of low- to extremely • Linkage Fees
low-income persons must rent their home.
• Density Bonuses
Strengthening renter protections, as well as
creating a proactive rental inspection program, • Mixed Uses in Downtown/Commercial
will alleviate discriminatory practices against Corridors
vulnerable populations, exorbitant rental inflation, • Diverse Financial Mechanisms
and substandard rental housing. The increase of • Clustered Land Assembly
sustainable affordable rental housing will also
• Land Banks and Community Land Trusts
help drive the economy and improve the quality
of the county education system by addressing • Fee Waivers and Tax Credits
housing affordability for teachers in one of the • Property Tax Rebates
nation’s largest public school systems.
PINELLAS COUNTY 11I N T R O D U CT I O N
The Foundation’s Journey
to Health Equity
The Foundation for a Healthy St. Petersburg uses a social determinants of
health framework to improve population health and achieve our mission
of health equity. The framework recognizes the intersection of numerous
economic, political, social and environmental conditions that have a
deep impact on individual and community health. Early in its formation,
the Foundation adopted the County Health Rankings Model (Figure 1),
developed by the University of Wisconsin Population Health Institute and
the Robert Wood Foundation (University of Wisconsin Population Health
Institute & Robert Wood Johnson Foundation, 2018b). This model recognizes
that health and well-being are not accomplished solely by preventing and
addressing illness, but instead, that meaningful and lasting health is only
possible when the broader environmental context in which people live is
recognized as a significant contributor to overall health.
The social determinants lens acknowledges that, even with medical
treatment, other factors such as housing, nutritious food, employment,
and transportation contribute to an individual’s ability to access health
care and their ability to maintain quality health. Often without the basics
– food, transportation, housing – individuals cannot adequately achieve
or maintain ongoing, quality health. These barriers are often much more
prevalent among low-income and minority households.
Health equity means that everyone has a fair and just opportunity to be
as healthy as possible. This requires removing obstacles to health such as
poverty and discrimination, and their consequences, including powerlessness
and lack of access to good jobs with fair pay, quality education and housing,
safe environments, and health care.
ROBERT WOOD JOHNSON FOUNDATION,
COUNTY HEALTH RANKINGS
12 H O U S I N G & H E A LT H E Q U I T Y A S S E S S M E N TLength of Life (50%)
HEALTH OUTCOMES
Quality of Life (50%)
Tobacco Use
Health Diet & Exercise
Behaviors
(30%) Alcohol & Drug Use
Sexual Activity
Access to Care
Clinical Care
(20%) Quality of Care
HEALTH FACTORS Education
Employment
Social &
Economic Income
Factors
(40%) Family & Social Support
Community Safety
Physical Air & Water Quality
Environment
POLICIES & PROGRAMS (10%) Housing & Transit
Figure 1: County Health Ranking Model (University of Wisconsin Population Health Institute
& Robert Wood Johnson Foundation, 2018b).
PINELLAS COUNTY 13H E A LT H E Q U I T Y A N D H O U S I N G
Housing is Health
The connection between housing and health begins with recognizing housing
as a basic human right (National Low Income Housing Coalition, 2018c). All
people deserve a safe, decent, and affordable place to live and raise their
families, regardless of their race, socioeconomic status, disability, gender,
sexual orientation or other bases for discrimination. Furthermore, the right
to housing includes the elements of security and availability, affordability,
accessibility, adequacy, location, and connection to the community culture
and amenities. Decades of federal spending cuts have resulted in a national
housing crisis in which homelessness and housing instability are the norm.
According to the National Low Income Housing Coalition (NLIHC) (2018c),
only one out of four income-eligible renters receives rental assistance.
There is a wide array of research that highlights the correlated relationship
between housing and health, including evidence that homelessness and
housing instability are major contributors to the poor health of individuals
and communities. In contrast, housing interventions such as supportive
housing are linked to the prevention of illness, improved access to care,
better care coordination, and increased well-being (Corporation for
Supportive Housing, 2014). The cited research (See Table 1), although not
exhaustive, illustrates that access to safe and stable housing contributes
to ensuring positive well-being and health, regardless of income, identity,
or illness.
Housing contributes to a person’s mental and physical health and well-being.
Safe, decent, and accessible affordable housing acts as a veritable “vaccine”
contributing to positive health outcomes and ensuring that families thrive.
NATIONAL LOW INCOME HOUSING COALITION, 2018D
14 H O U S I N G & H E A LT H E Q U I T Y A S S E S S M E N TSTABLE HOUSING
CITED FINDINGS & RESULTS
& HEALTH OUTCOMES
• Affordable housing provides access to health care and other services especially
for vulnerable populations – persons living with disabilities, elderly, persons
experiencing homelessness, or living with a mental illness or HIV/AIDS
(National Low Income Housing Coalition, 2018d).
• When low-income families access affordable housing, the number of emergency
Improved Access to room visits are reduced, use of primary care increases, and families report
better access to and quality of care (Enterprise Foundation & Center for
and Retention in Care
Outcomes Research and Education, 2016).
• Housing instability during childhood is associated with a lack of regular care and
increased hospitalizations (Sandel et al., 2018).
• Stably housed persons living with HIV/AIDS are more likely to access and stay
in care (Aidala et al., 2016).
• Significant housing cost burden often results in reduced adherence to health
care treatment (National Low Income Housing Coalition, 2018d).
• Improved health outcomes for persons living with HIV/AIDS (Aidala et al., 2016).
• Adults living in unaffordable housing are more likely to describe themselves as
being in fair or poor health compared to similar individuals living in affordable
housing (Stahre, VanEenwyk, Siegel, & Njai, 2015).
• A growing body of research suggests that stable and affordable housing may
help individuals living with chronic diseases such as HIV/AIDS, diabetes, and
Better Health Outcomes hypertension increase their rates of medical care, maintain their treatment
regimens, and achieve better health outcomes (Aidala et al., 2016; Corporation for
Supportive Housing, 2014).
• Access to affordable housing can enable individuals and families to spend more on
food and health care, which can improve health outcomes (National Low Income
Housing Coalition, 2018d).
• By alleviating crowding that often is the result of cost-burdened families “doubling
up,” affordable housing can reduce exposure to stressors and infectious disease
(National Low Income Housing Coalition, 2018d).
• Stable housing can often reduce risky behaviors associated with HIV-infection,
Disease/Illness Prevention can reduce risk for asthma, and improve birth outcomes (Aidala et al., 2016;
Cutts et al., 2015; Wu & Takaro, 2007).
Table 1: Improving Health Outcomes through Housing Continued on next page.
PINELLAS COUNTY 15STABLE HOUSING
CITED FINDINGS & RESULTS
& HEALTH OUTCOMES
• Persons formerly experiencing homelessness report improved mental health
functioning (Burt, Wilkins, & Mauch, 2011; Hunter, Harvey, Birscombe, &
Cefalu, 2017).
• Homeless children are more vulnerable to mental health problems,
developmental delays, poor cognitive outcomes, and depression than children
Improved Mental Health who are stably housed (Hart-Shegos, 1999).
• Housing instability and homelessness have been linked to an increased risk
of depression and mental illness for adults and children (Health Research and
Educational Trust, 2017; Mental Health Foundation, 2018; Stahre et al., 2015).
• Stable housing is strongly associated with improved mental health outcomes
(Stahre et al., 2015).
• Affordable housing allows families to afford their own home, reducing
“doubled up” situations and overcrowding, reducing stress (National Low
Income Housing Coalition, 2018d).
• Low-income families are more likely to live in homes that have lead-based
paint hazards than higher-income families (Befner, 2017).
Environmental Safety • Poor quality or poorly maintained housing may be overrun with mold, dust
mites, cockroaches, or rodents—all of which are sources of allergens that
Improves Health cause asthma and other respiratory illnesses, as well as fatigue, headache,
and difficulty concentrating (Health Research and Educational Trust, 2017;
National Low Income Housing Coalition, 2018d).
• Well-constructed and well-maintained affordable housing can reduce health
problems associated with poor-quality housing (National Low Income Housing
Coalition, 2018d).
• Housing with services, especially for homeless and other individuals with
chronic conditions, can reduce overall health care costs. (Basu, Kee, Buchanan,
& Sadowski, 2012; Burt et al., 2011; Corporation for Supportive Housing, 2014;
Cost Effective Enterprise Foundation & Center for Outcomes Research and Education, 2016).
• Integration of health and housing services is a key driver in lowering health
care costs (Basu et al., 2012; Corporation for Supportive Housing, 2014;
Enterprise Foundation & Center for Outcomes Research and Education, 2016).
Table 1: Improving Health Outcomes through Housing
16 H O U S I N G & H E A LT H E Q U I T Y A S S E S S M E N TThese outcomes clearly demonstrate that housing is a critical social determinant of
health. It is important to remember that housing is not just the “bricks and mortar”
place in which a family resides, however. A home also encompasses the heart and
soul of life, family, and community. The right to housing is based in a simple yet
profound concept – everyone needs and deserves a place to call home, and home
creates the space for the most optimal health to be achieved.
Housing: A Mechanism
Toward Health Equity
Advancing health equity includes ensuring access to affordable, decent,
safe, accessible, and livable housing, regardless of race, ethnicity, income,
or geography (Hernandez & Suglia, 2016). Housing is the mechanism
through which larger systemic inequities get realized (Aidala & Sumartojo,
2007). Individuals living in poverty, racial and ethnic minority populations,
individuals with chronic conditions, disability, or mental illness, and those
without the income to weather the storms of crisis, are those most affected
by these inequalities. Race and income determine access to housing and to
neighborhoods that promote positive health. Homelessness and housing
instability, health disparities, and access to good housing and neighborhoods
are all correlated along racial and economic lines.
Housing is a manifestation of and contributes to the generation of social and
economic inequalities. Income and race, the two factors most consistently
associated with differential health, are also the factors that determine
access to good housing in good neighborhoods and the variety of threats or
enhancements of well-being provided by different residential contexts.
AIDALA & SUMARTOJO, 2007
PINELLAS COUNTY 17A N A LYS I S
The following analyses provide further exploration of the
connection between housing, health and equity. They offer a
review of the major demographic and health data of Pinellas
County, especially related to inequities associated with
race, ethnicity, income, and geography of households living
throughout the County. This provides the context through
which to view the reported housing need throughout the
county and its correlation to existing inequities. Housing
need was analyzed through the lens of housing affordability,
availability, accessibility, and adequacy. Where appropriate,
data related to populations with special needs, such as persons
experiencing homelessness, mental illness, HIV/AIDS etc.,
were noted in order to further underscore health inequities.
When possible, available data were analyzed at a zip code,
neighborhood, or census tract level, to illustrate the impact in
various communities throughout the county.
18 H O U S I N G & H E A LT H E Q U I T Y A S S E S S M E N TPinellas County Health Outcomes:
Length of Life, Quality of Life,
and Health Factors
• When considering health factors – factors that Although the rankings show the positive movement
drive how long and how well individuals live - the toward improved health in the County, there
2018 County Health Ranking Report for the State of remain disparities based on where households live,
Florida (University of Wisconsin Population Health their income, and race. Historically marginalized
Institute & Robert Wood Johnson Foundation, groups – people of color, LGBTQ persons, persons
2018a) ranks Pinellas County as 16th out of 67 with disabilities, and persons living in poverty—
counties for overall Health Factors and 26th in have not benefited from better health outcomes
overall Health Outcomes. as compared to other populations (Foundation
• Health outcomes measured included length and for a Healthy St. Petersburg, 2018; University of
Wisconsin Population Health Institute & Robert
quality of life (See Table 2). When compared to the
three other counties in the Metropolitan Statistical Wood Johnson Foundation, 2018a).
Area (MSA) (Hillsborough, Pasco, and Hernando), Access to affordable housing is often dependent
Pinellas County ranks second highest on Health upon adequate income. Two factors pulled out
Outcomes and highest for Health Factors (See from the data to highlight income inequities are
Table 2). The Health Factor indicators include Children in Poverty and Income Inequity.
health behaviors, clinical care, social and economic,
and physical environmental factors (See Table 2).
• In the State of Florida, 21% of children live in
poverty, compared to 20% in Pinellas County
• An analysis of 2010 Census data by zip code areas (See Table 3). Child poverty rates in Florida
in the county illustrate that areas with a higher counties range from 9-42% and are worse for
percentage of non-White households show higher children of color (University of Wisconsin
rates of mortality (See Map 1). Population Health Institute & Robert Wood
• When examining housing and transit, important Johnson Foundation, 2018a).
Health Factor measures, Pinellas County ranks 13th • Based on the income inequity ratio, where a
out of 67 Florida counties for physical environment. higher ratio indicates greater division between
• Pinellas County ranked in the top 25 counties for income ranges, the top 20% household income
in Pinellas County is 4.8 times higher than the
the prevalence of social & economic factors such
as poverty and income inequity as well as health lowest 20% (See Table 3). The County Health
behaviors such as smoking and physical inactivity. Rankings (2018b) estimate a national range for
This is comparable or higher than the other counties counties between 3.7 and 5.4.
in the MSA. • Income disparities exist in the County, as illustrated
above, which limit access to housing choice,
especially for families of color.
PINELLAS COUNTY 19A N A LYS I S
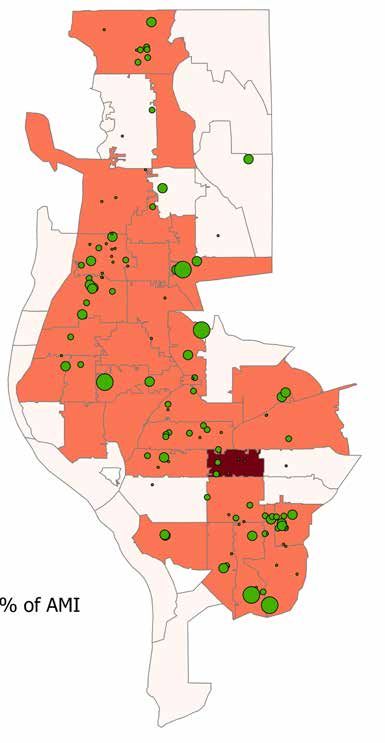
Age-Adjusted Annual Mortality Rate
MAP 1: Map of Mortality Compared to Minority Residents,
Pinellas County (HealthLandscape, 2010)
20 H O U S I N G & H E A LT H E Q U I T Y A S S E S S M E N TRANKINGS OUT OF 67 FLORIDA COUNTIES (LOWER NUMBER = BETTER RANKING)
RANK: RANK:
MSA LENGTH QUALITY PHYSICAL SOCIAL & HEALTH CLINICAL
HEALTH HEALTH
COUNTY OF LIFE OF LIFE ENVIRONMENT ECONOMIC BEHAVIORS CARE
OUTCOMES FACTORS
Pinellas 26 23 21 16 13 20 23 7
Hillsborough 25 17 32 25 49 16 26 27
Pasco 38 43 37 28 27 19 39 25
Hernando 45 45 42 31 26 42 22 31
TABLE 2: County Health Outcomes and Factors Ranking for Tampa-St. Petersburg-Clearwater MSA
(University of Wisconsin Population Health Institute & Robert Wood Johnson Foundation, 2018b)
KEY HEALTH FACTORS
SEVERE HOUSING CHILDREN IN
MSA INCOME INEQUITY RESIDENTIAL SEGREGATION
PROBLEMS POVERTY
COUNTY Ratio Score (0-100)
% Households %
Pinellas 19 4.8 20 60
Hillsborough 20 4.9 20 45
Pasco 17 4.3 18 44
Hernando 18 4.0 23 31
Florida 22 4.7 21 55
TABLE 3: Key Health Factors - Physical, Social, and Economic Factors for the Tampa-St. Petersburg-Clearwater MSA
(University of Wisconsin Population Health Institute & Robert Wood Johnson Foundation, 2018b)
Pinellas County’s Residential Segregation score of 60 is higher than the State’s and
higher than each of the other counties in the MSA (See Table 3). This ranking illustrates
factors such as structural racism that may inhibit access to affordable housing options for
households of color.
The Residential Segregation score represents the degree of segregation between White and
Black residents in the county. The Residential Segregation index ranges from 0 (complete
integration) to 100 (complete segregation). Florida has an overall score of 55 on the index.
PINELLAS COUNTY 21A N A LYS I S
County Inequities: Race/Ethnicity,
Income, and Geography
Key social indicators for determining well-being • Poverty has a disproportionate impact on persons
are race and ethnicity. Non-White residents of color in Pinellas County (See Maps 1 & 2, Table
face disproportionally greater challenges in 4) - nearly 30% of those living in poverty identify
experiencing positive health outcomes. as African-American, 19% identify as bi- or multi-
racial, and 20% identify as “other race” (Pinellas
• Of the nearly 940,000 residents in Pinellas County Economic Development, 2018).
County, approximately 130,727 (or 14.1%) live • The highest concentration (50% or more) of
in poverty (U.S. Census Bureau, 2016a), which residents of color live in the southeastern most
is slightly higher than the 2016 national poverty region of Pinellas County, which encompasses
rate of 13.5%. the Marina District and Greater Pinellas Point
• Among the county’s population, nearly 85% of neighborhoods.
residents are White. Black or African Americans • Pinellas County ranks 38th among the 3,007
make up about 11% of the population, with Asian counties in the United States for the gap between
residents representing only 4% of the community. the average income of the top 1% of the population
Nearly 9% of residents are Hispanic. Native and the average income of the bottom 99%
Americans and people of another race make up the (Economic Policy Institute, 2018) – an alarming
remaining portion of the community’s demographic. income inequality statistic.
POVERTY STATUS
NUMBER OF PERSONS PERCENTAGE OF PERSONS LIVING IN
RACE
LIVING IN POVERTY POVERTY BY RACE
White 91,952 12.0%
Black 27,469 29.3%
Asian 3,980 13.3%
American Indian/Alaskan Native 532 19.5%
Pacific Islander 67 8.8%
Other 2,141 21.0%
Multiracial 4,586 19.1%
NUMBER OF PERSONS PERCENTAGE OF PERSONS LIVING IN
ETHNICITY
LIVING IN POVERTY POVERTY BY ETHNICITY
Non-Hispanic White 77,874 11.2%
Hispanic/Latino of any race 17,528 21.4%
Table 4: 2016 Poverty Status by Race and Ethnicity, Pinellas County (Pinellas County Economic Development, 2018)
22 H O U S I N G & H E A LT H E Q U I T Y A S S E S S M E N TMAP 2: Median Household Income as a % of AMI,
Pinellas County by Zip Code
PINELLAS COUNTY 23A N A LYS I S
DISCUSSION POINTS
Market forces are driving up rental and ownership costs, resulting in an upsurge of
households that are housing cost-burdened. How do we alleviate the housing burden
crisis? How does Pinellas County improve its affordable housing continuum?
• What affordable housing strategies can be implemented that help to ensure access
to affordable housing units, especially for extremely low-income households?
• What other supports, coupled with housing, can be developed to reduce episodes
of housing instability and homelessness?
• What policies can ensure continued economic growth while also ensuring adequate
access to affordable housing and reliable transportation?
THROUGH THIS ANALYSIS
A FEW THINGS BECOME CLEAR
1 Poverty and poorer health outcomes are associated with race;
2 Race, poverty, and poor health outcomes, map along the same
zip code areas throughout Pinellas County (See Maps 1 and 2);
3 Compared to Florida and the other counties in the MSA,
Pinellas County is more segregated (See Table 3);
4 Income disparities are the most pronounced among non-White
individuals, especially among Blacks/African Americans; and
5 The income gap between the highest and lowest household
incomes is growing.
Poverty, race, and geography are all connected to
access and an ability to maintain safe, decent, and
affordable housing. The next section examines these
inequities in relation to housing need.
24 H O U S I N G & H E A LT H E Q U I T Y A S S E S S M E N TThe 4 “A’s” of Housing - Affordability,
Availability, Accessibility, and Adequacy
1 Affordability including apartments, single family homes, and
condos, increased by 22% (Zillow Rent Index (ZRI)
The primary cause of housing instability in Time Series, 2018) (See Graph 1).
any community is a lack of affordable housing • In 2011, the median estimated rent in Pinellas County
opportunities for citizens (affordability defined was approximately $1,130 per month. Six years
as no more than 30% of income is spent on later, the median estimated rent has increased to
housing costs, including utilities), a marker approximately $1,405 per month. (Zillow Rent Index
used by the Federal government and affordable (ZRI) Time Series, 2018) (See Graph 1).
housing advocates. By a variety of measures, • Workers who rent property in Pinellas County
housing affordability in Pinellas County has must make an hourly wage of $26.93 – nearly 4
declined dramatically in recent years for both times the federal minimum wage – to not spend
renters and homeowners. more than 30% of their income on housing costs.
INCREASING RENTAL COSTS
• For workers earning minimum wage in Pinellas
County, it would require 148 hours of work per
• In the last six years in Pinellas County, median week (or 3.7 full-time workers) to afford the median
estimated market rate rents for all housing types, estimated market rate rent in Pinellas County.
Graph 1: Pinellas County Median Estimated Market Rate Rent for All Housing Types (Zillow Rent Index (ZRI) Time Series, 2018)
PINELLAS COUNTY 25A N A LYS I S
RISING MORTGAGE COSTS projected mortgage payment for a $183,000 home
• Over the course of five years in Pinellas County is $1,343.70 per month.
(2011-2016), median estimated home values rose • Workers In Pinellas County must earn more
by 59% (Zillow Home Value Index, 2018). In 2011, than $25 per hour (nearly 3.5 times the federal
the median estimated home value in Pinellas minimum wage) to afford the median estimated
County was approximately $115,000. Five years mortgage payment. As a result, home ownership
later, the median estimated home value increased continues to be an economically unattainable goal
to approximately $183,000. (See Graph 2). for many low-wage Pinellas County workers and
• Using mortgage estimation tools, including their families.
homeowner taxes and fees in Pinellas County, the
Graph 2: Pinellas County Median Estimated Home Values (Zillow Home Value Index, 2018)
To explore the connection between income and renter/owner households, data were
examined in the South Pinellas area. In South Pinellas, over one-third of resident
households rent their homes. Extremely low-income residents are more likely to be
renters than homeowners – more than 52% of residents within this income bracket
rent their homes (See Graph 3). As household income increases, homeownership
increases as well. Over 60% of residents with incomes considered “low” (50.1-80%
AMI) own their homes while nearly 75% of residents with incomes above 80-percent
AMI are homeowners.
26 H O U S I N G & H E A LT H E Q U I T Y A S S E S S M E N TGraph 3: Households by Owner/Renter and Income, Pinellas County (U.S. Census Bureau, 2016c)
COST-BURDENED HOUSEHOLDS AND As Table 5 and Map 3 indicate (U.S. Census Bureau,
AFFORDABILITY GAP 2016c), extremely low-income renters are especially
Despite an abundance of older and slightly less hard hit by the shortage of affordable housing.
Households within this income limit experience
expensive housing as compared to the rest of
severe cost burden at higher rates than households
the state, Pinellas County residents continue to
with higher incomes.
find it difficult to obtain affordable housing. Again
using 30% of a household’s income as the marker As income drops, the percentage of income going to
for affordability, in Pinellas County, 171,245 housing-related costs increases. Note the similar
households (more than 50% renters and over 33% pattern of higher cost burden associated with
homeowners) are considered “cost-burdened,” areas of lower income and non-White households,
as described earlier.
(U.S. Census Bureau, 2016c) meaning they pay
more than 30% of their income towards housing. Renters with incomes between 50 and 80% AMI expe-
Vulnerable populations are often hardest hit by rience higher rates of moderate cost-burden (57%).
lower incomes and higher costs. Over 50% of Renters with incomes above 80% AMI are more like-
households with seniors, children, or persons ly to experience no cost- burden at all. Renting is an
living with disabilities are cost burdened in affordable option for higher income households in
Pinellas County (Shimberg Center for Housing Pinellas County. Nearly all renter households with
incomes above 80 percent of AMI pay 30 percent or
Studies, 2016).
less of their income for their housing.
In Pinellas County, low-income households are
The South Pinellas area has a high percentage of cost-
disproportionally affected by housing cost burden. burdened households, with the highest concentration
Residents with incomes at or below 80% AMI are (52% of households or more) living in areas that are
more likely (67% of residents) to spend more than heavily low- to extremely low-income. With more than
30% of their incomes towards the cost of housing. 50% of residents in the South Pinellas region being
With such high percentages of income funneled people of color, it is critical that affordable housing
into housing costs, low-income residents are left strategies target these minority, cost-burdened
with little to afford other basic needs such as food, households, in order to impact and improve health
clothing, transportation, and health care. equity in minority communities.
PINELLAS COUNTY 27A N A LYS I S
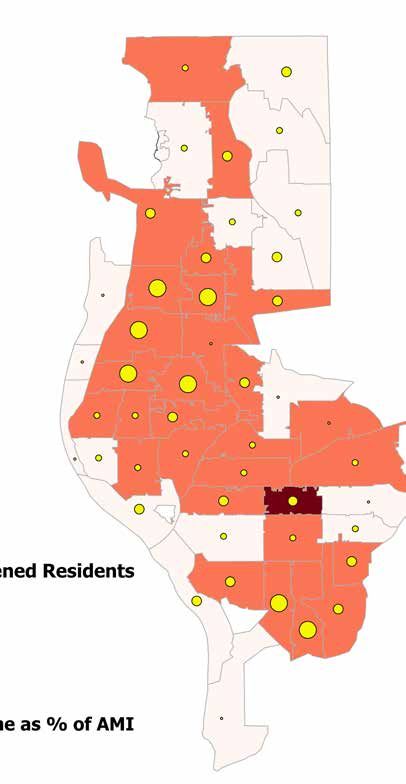
Map 3: Cost Burdened Compared to Median Income
as a Percentage of AMI for Renter Households in
Pinellas County (U.S. Census Bureau, 2016c)
28 H O U S I N G & H E A LT H E Q U I T Y A S S E S S M E N T1 in 2 South Pinellas households are cost-burdened and live in areas with high
concentrations of low- to extremely low-income residents.
COST-BURDENED HOUSEHOLDS AND INCOME that highlights the plight of historically manifested
housing inequities. On average, households with
Having a job does not always guarantee access
moderate to high incomes (earning at or above
to affordable housing. Many cost-burdened
80% AMI) do not experience a gap in housing
households in Pinellas County are led by someone
affordability. Table 5 highlights the range of the
working either full or part time. As Table 5 shows,
affordability gap for a few examples of common
low-wage workers are heavily affected by the
wage earners. As the examples illustrate, the
lack of affordable housing. For residents within
affordability gap ranges from $40 to $873 for
this income limit to afford the median estimated
earners in such industries as hospitality, retail,
rent in 2018, renters would have to spend over
and manufacturing. These examples demonstrate
half their monthly income towards housing costs.
the current challenge that even full-time wage
There is a strong correlation between income and earners, working 40 hours a week, 50 weeks a
housing affordability. As income decreases, so year, have throughout Pinellas County (Florida
does affordability. The affordability gap is a chasm Data Clearing House, n.d.).
AFFORDABILITY GAP BY INDUSTRY WAGE
HOUSEHOLD HOUSEHOLD HOUSEHOLD HOUSEHOLD
HOUSEHOLD
INCOME LIMIT INCOME LIMIT INCOME LIMIT INCOME LIMIT
INCOME LIMIT
0 – 30% AMI 30.1– 50% AMI 30.1 – 50% AMI 50.1 – 80% AMI
NONDURABLE
MINIMUM WAGE LEISURE &
RETAIL TRADE GOODS AMI
EARNER HOSPITALITY
MANUFACTURING
Median Annual Income
$16,500 $23,540 $30,680 $49,820 $64,000
(2 Person)
Median Monthly Income
$1,375 $1,961 $2,556 $4,151 $5,333
(/12)
30% for Housing Costs $412 $588 $767 $1,245 $1,600
Zillow Rent Index
for 1-BR Unit + $200 $1,285 $1,285 $1,285 $1,285 $1,285
Utilities*
AFFORDABILITY GAP ($873) ($697) ($518) ($40) $315
Table 5: Affordability Gap by Industry Wage, Pinellas County, (Florida Data Clearing House, n.d.; Zillow Rent Index (ZRI) Time Series, 2018)
PINELLAS COUNTY 29A N A LYS I S
As illustrated earlier in this report, many low- and
the Median Market Rent, all households would
extremely low-income, wage-earning households experience an affordability gap – paying over
are predominately non-White with the majority 30% of their income toward housing-related
costs. The gap ranged from $60 to $490 per
being Black/African American. As a result, these
households pay a disproportionate amount of month. However, this gap was higher among non-
White households (with the exception of Asian
their income to housing-related costs. They are
households) and highest among Black/African
severely cost-burdened, which has a direct effect
on their overall health and well-being. American households. For these households, the
affordability gap was $490 per month (See Table
In the following analysis, considering Median 6) and Black/African American households earned
Annual Income by race/ethnicity compared to only 65% of their White household counterparts.
RACE/ETHNICITY
BLACK OR NATIVE HAWAIIAN
NATIVE ANOTHER
AFRICAN WHITE ASIAN & OTHER PACIFIC HISPANIC
AMERICAN RACE
AMERICAN ISLANDER
Median Annual Income $31,796 $49,007 $57,830 $44,514 $39,828 $38,794 $39,232
Median Monthly Income $2,650 $4,084 $4,819 $3,710 $3,319 $3,233 $3,269
30% for Housing Costs $795 $1,225 $1,446 $1,113 $996 $970 $981
Zillow Rent Index
for 1-BR Unit + $200 $1,285 $1,285 $1,285 $1,285 $1,285 $1,285 $1,285
Utilities*
AFFORDABILITY GAP ($490) ($60) $161 ($172) ($289) ($315) ($304)
Table 6: Race/Ethnicity, AMI, and Rent Burden (U.S. Census Bureau, 2016c; Zillow Rent Index (ZRI)
Time Series, 2018)
When comparing race to cost-burdened households, the concentration of cost-
burdened households in Pinellas County is in predominately minority neighborhoods
(See Map 4). The visual analysis further illustrates the points made earlier –
minority households are more likely to be low-income, pay a greater percentage of
their income toward housing-related costs, and have less access to affordable units.
These inequities track along the same racial, health, and income lines examined
earlier throughout Pinellas County.
30 H O U S I N G & H E A LT H E Q U I T Y A S S E S S M E N TYou can also read