COMMUNITY HEALTH NEEDS ASSESSMENT 2016 - A Collaborative Approach to Impacting Population Health in Galena and Surrounding Areas - Midwest ...
←
→
Page content transcription
If your browser does not render page correctly, please read the page content below
COMMUNITY HEALTH
                      NEEDS ASSESSMENT
                                  2016

A Collaborative Approach to Impacting Population Health
                       in Galena and Surrounding Areas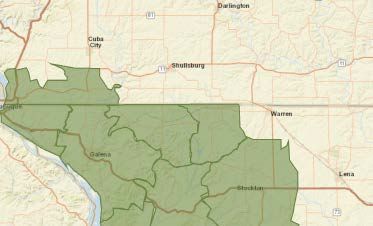
MIDWEST MEDICAL CENTER
            COMMUNITY HEALTH NEEDS ASSESSMENT

            TABLE OF CONTENTS
            I.         Introduction							                                                                                               3
                         Executive Summary                                                                                               3
                         Background								                                                                                              4
                         Community Health Needs Assessment Population			                                                                 5
                         Midwest Medical Center Service Area Demographics 		                                                             5

            II.        Establishing the CHNA Infrastructure and Partnerships			                                                         20

            III.       Defining the Purpose and Scope                      				                                                         20

            IV.        Data Collection and Analysis						                                                                             21
                         Description of Process and Methods Used				                                                                  21
                         Description of Data Sources						                                                                         21-22, 34

            V.         Identification and Prioritization of Needs				                                                                  38

            VI.        Description of the Community Health Needs Identified			                                                         38

            VII.       Resources Available to Meet Priority Health Needs			                                                          40-41

            VIII.      Steps Taken Since the Last CHNA to Address Identified Needs                                                   42-43

            IX.        Documenting and Communicating Results                          		                                               43

            X.         References				                                                                                                  43

            XI. Implementation Strategy				                                                                                          44-50

Copyright ©2016 by the Illinois Critical Access Network (ICAHN). All rights reserved. The contents of this publication may not be copied, reproduced,
replaced, distributed, published, displayed, modified, or transferred in any form or by any means except with the prior permission of ICAHN. Copyright
infringement is a violation of federal law subject to criminal and civil penalties.

2 I Midwest Medical Center
Midwest Medical Center Community Health Needs Assessment
COMMUNITY HEALTH NEEDS ASSESSMENT
I. INTRODUCTION
Executive Summary
Midwest Medical Center (MMC) conducted a Community Health Needs Assessment (CHNA) over a period of months
in the summer of 2016. The CHNA is a systematic process involving the community to identify and analyze commu-
nity health needs as well as community assets and resources in order to plan and act upon priority community health
needs. This assessment process results in a CHNA report which assists the hospital in planning, implementing,
and evaluating hospital strategies and community benefit activities.
The Community Health Needs Assessment was developed and conducted in partnership with representatives from
the community by a consultant provided through the Illinois Critical Access Hospital Network (ICAHN). ICAHN is a
not-for-profit 501(c)(3) corporation, established in 2003 for the purposes of sharing resources, education, promoting
operational efficiencies and improving healthcare services for member critical access hospitals and their rural
communities.
The process involved the review of several hundred pages of demographic and health data specific to the Midwest
Medical Center service area. The secondary data and previous public health planning conclusions drew attention to
several common issues of rural demographics and economics and drew emphasis to issues related to mental health
services, wellness, obesity, and related issues.
In addition, the process involved focus groups comprised of area healthcare providers and partners and persons
who represent the broad interests of the community served by the hospital including those with special knowledge
of, or expertise in public health. Members of medically underserved, low-income, and minority populations served
by the hospital or individuals or organizations representing the interests of such populations also provided input.
The medically underserved are members of a population who experience health disparities, are at risk of not receiving
adequate medical care as a result of being uninsured or underinsured, and/or experiencing barriers to healthcare
due to geographic, language, financial, or other factors.
Two focus groups met on July 18, 2016, to discuss the overall state of health and the local delivery of healthcare,
and health-related services. They identified positive recent developments in local services and care and also identified
issues or concerns that they felt still existed in the area.
A third group comprised of members or representatives of members of the focus groups then met and considered the
qualitative and quantitative data gathered and estimated feasibility and effectiveness of possible interventions by the
hospital to impact these health priorities; the burden, scope, severity, or urgency of the health needs; the health
disparities associated with the health needs; the importance the community places on addressing the health needs;
and other community assets and resources that could be leveraged through strategic collaboration in the hospital’s
service area to address the health needs.
As an outcome of the prioritization process, discussed above, several potential health needs or issues flowing from the
primary and secondary data were not identified as significant current health needs and were not advanced for future
consideration.
Five needs (three being clusters of related needs) were identified as significant health needs and prioritized:
1. Mental health
2. Wellness
3. Substance abuse
4. Maintaining volunteers and family involvement in health improvement
5. Transportation
Midwest Medical Center I 3The consultant then compiled a report detailing key data and information that influenced the process and set out the
conclusions drawn by the participants. This report was delivered to Midwest Medical Center in August, 2016.
Background
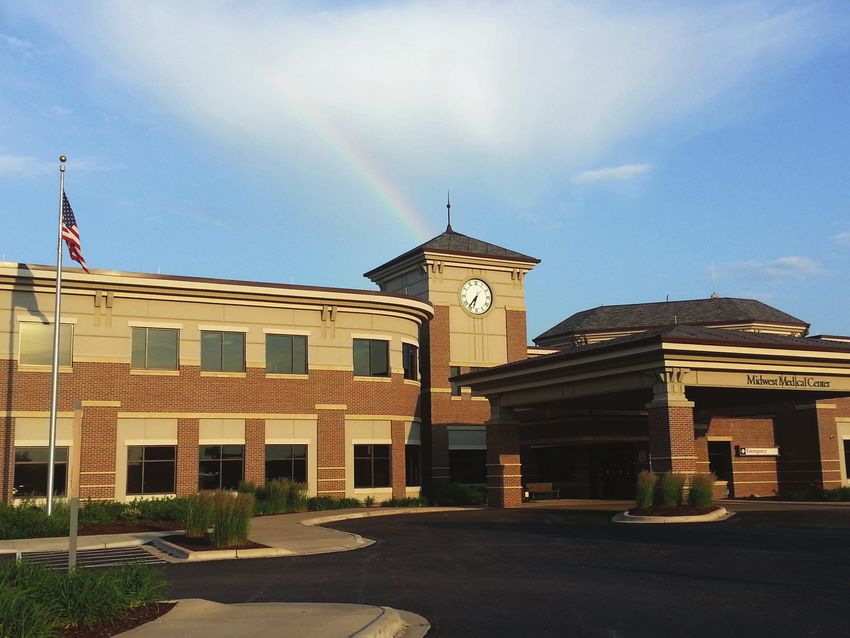
Midwest Medical Center began serving the healthcare needs of Galena and the surrounding communities on December 5,
2007, when it officially replaced Galena-Stauss Hospital & Healthcare Center, a 45-year-old, 25-bed critical access facility
that had become unable to expand and improve medical services due to building challenges and a landlocked location.
Provisions in the Affordable Care Act (ACA) require charitable hospitals to conduct a Community Health Needs Assessment
(CHNA).
The CHNA is a systematic process involving the community to identify and analyze community health needs as well as
community assets and resources in order to plan and act upon priority community health needs. This assessment process
results in a CHNA report which assists the hospital in planning, implementing, and evaluating hospital strategies and
community benefit activities. The Community Health Needs Assessment was developed and conducted, in partnership with
representatives from the community, by a consultant provided through the Illinois Critical Access Hospital Network (ICAHN).
ICAHN is a not-for-profit 501(c)(3) corporation, established in 2003 for the purposes of sharing resources, education,
promoting operational efficiencies and improving healthcare services for member critical access hospitals and their rural
communities. ICAHN, with 55 member hospitals, is an independent network governed by a nine-member board of directors,
with standing and project development committees facilitating the overall activities of the network. ICAHN continually strives
to strengthen the capacity and viability of its members and rural health providers. Midwest Medical Center is a member of
the Illinois Critical Access Hospital Network. The Community Health Needs Assessment will serve as a guide for planning and
implementation of healthcare initiatives that will allow the hospital and its partners to best serve the emerging health needs
of Galena and the surrounding area.
The population assessed was the identified service area in Jo Daviess County in Illinois and Grant County and a very small
portion of Lafayette County, both in Wisconsin. Data collected throughout the assessment process was supplemented with:
• A local asset review
• Qualitative data gathered from broad community representation
• Focus groups, including input from local leaders, medical professionals, health professionals, and community members
who serve the needs of persons in poverty and the elderly
Midwest Medical Center is a not-for-profit hospital.
4 I Midwest Medical CenterMidwest Medical Center Community Health Needs Assessment
COMMUNITY HEALTH NEEDS ASSESSMENT POPULATION
For the purpose of this CHNA, Midwest Medical Center defined its primary service area and populations as the general
population within the geographic area in and surrounding the city of Galena defined in detail below. The hospital’s patient
population includes all who receive care without regard to insurance coverage or eligibility for assistance.
DEMOGRAPHICS
Midwest Medical Center’s service area is comprised of approximately 575 square miles, with a population of approximately
23,461 and a population density of 41 people per square mile. The service area consists of the following rural communities:
Cities and Towns Villages
• East Dubuque • Apple River
• Galena • Elizabeth
• Hanover
• Scales Mound
• Stockton
• Hazel Green, WI
Illustration 1. Midwest Medical Center Service Area
Fillmore
ESRI – 2016
Midwest Medical Center I 5TOTAL POPULATION CHANGE, 2000-2010
According to U.S. Census data, the population in the hospital service area grew from 23,433 people to 23,955 between the
years 2000 and 2010, a 2.23% increase.
Report Area Total Population Total Population Total Population Percentage
2000 Census 2010 Census Change, 2000-2010 Population Change,
2000-2010
Service Area Estimates 23,433 23,955 522 2.23%
Jo Daviess County, IL 22,289 22,678 389 1.75%
Grant County, WI 49,597 51,208 1,611 3.25%
Lafayette County, WI 16,137 16,836 699 4.33%
Illinois 12,416,145 12,830,632 414,487 3.34%
Wisconsin 5,363,669 5,686,986 323,317 6.03%
Total Area (Counties) 88,023 90,722 2,699 3.07%
Data Source: Community Commons
The Hispanic population increased in Jo Daviess County, IL by 267 (78.07%), increased in Grant County, WI by 369
(131.79%), and increased in Lafayette County, WI by 430 (467.39%).
In Jo Daviess County, IL additional population changes were as follows: White 0.25%, Black 143.18%, American Indian/
Alaska Native 95.65%, Asian 100%, and Native Hawaiian/Pacific Islander 1,000%.
In Grant County, WI additional population changes were as follows: White 1.92%, Black 127.04%, American Indian/Alaska
Native 60.94%, Asian 35.65%, and Native Hawaiian/Pacific Islander 25%.
In Lafayette County, WI additional population changes were as follows: White 1.95%, Black 129.41%, America Indian/Alaska
Native 166.67%, Asian 61.11%, and Native Hawaiian/Pacific Islander -100%.
6 I Midwest Medical CenterMidwest Medical Center Community Health Needs Assessment
POPULATION BY AGE GROUPS
Population by gender was 50% male and 50% female, and the region has the following population numbers by age groups:
Report Area Total Population Ages 0-4 Ages 5-17 Ages 18-24 Ages 25-34
Service Area Estimates 23,461 1,099 3,586 1,504 2,103
Jo Daviess County, IL 22,427 1,044 3,400 1,501 2,039
Grant County, WI 51,272 2,812 7,859 8,906 5,384
Lafayette County, WI 16,847 1,073 3,130 1,296 1,904
Illinois 12,868,747 810,671 2,244,295 1,253,226 1,781,319
Wisconsin 5,724,692 347.284 969,377 557,036 727,998
Report Area Continued Ages 35-44 Ages 45-54 Ages 55-64 Ages 65+
Service Area Estimates 2,454 3,304 3,891 5,520
Jo Daviess County, IL 2,382 3,185 3,708 5,168
Grant County, WI 5,096 6,658 6,401 8,156
Lafayette County, WI 1,835 2,599 2,322 2,688
Illinois 1,699,140 1,823,332 1,560,481 1,696,283
Wisconsin 703,763 847,881 747,354 823,999
Data Source: Community Commons
HIGH SCHOOL GRADUATION RATE
Within the service area, 94.76% of students are receiving their high school diploma within four years. This is higher than the
Healthy People 2020 target of 82.4%. This indicator is relevant because research suggests education is one of the strongest
predictors of health.
Report Area Average Freshman Estimated Number of On-Time
Base Enrollment Diplomas Issued Graduation Rate
Service Area Estimates 263 249 94.76
Jo Daviess County, IL 248 218 87.9
Grant County, WI 616 562 91.2
Lafayette County, WI 241 224 93
Illinois 169,361 131,670 77.7
Wisconsin 72,089 65,410 90.7
Note: This indicator is compared with the state average. Data Source: Community Commons
Healthy People is a federal health initiative which provides science-based, 10-year national objectives for improving the health
of all Americans. For three decades, Healthy People has established benchmarks and monitored progress over time in order
to encourage collaborations across communities and sectors, empower individuals toward making informed health decisions,
and measure the impact of prevention activities. Healthy People 2020 (HP2020) continues in this tradition with the launch on
December 2, 2010 of its ambitious, yet achievable, 10-year agenda for improving the nation’s health.
Midwest Medical Center I 7POPULATION WITHOUT A HIGH SCHOOL DIPLOMA (Ages 25 and Older)
Within the service area, there are 1,362 persons aged 25 and older without a high school diploma (or equivalent) or higher.
This represents 7.89% of the total population aged 25 and older. This indicator is relevant because educational attainment
is linked to positive health outcomes.
Report Area Population Age 25+ Population Age 25+ % Population Age 25+
With No HS Diploma With No HS Diploma
Service Area Estimates 17.272 1,362 7.89%
Jo Daviess County, IL 16,482 1,372 8.32%
Grant County, WI 31,695 2,943 9.29%
Lafayette County, WI 11,348 1,146 10.1%
Illinois 8,560,555 1,062,144 12.41%
Wisconsin 3,850,995 356,189 9.25%
Note: This indicator is compared with the state average. Data Source: Community Commons
POPULATION WITH ASSOCIATE’S LEVEL DEGREE OR HIGHER
In the service area, 32.42% of the population aged 25 and older, or 5,599 people have obtained an Associate’s level degree
or higher. This indicator is relevant because educational attainment has been linked to positive health outcomes.
Report Area Population Age 25+ Population Age 25+ % Population Age 25+
With Associate’s With Associate’s
Degree or Higher Degree or Higher
Service Area Estimates 17,272 5,599 32.42%
Jo Daviess County, IL 16,482 5,513 33.45%
Grant County, WI 31,695 9,859 31.11%
Lafayette County, WI 11,348 3,077 27.11%
Illinois 8,560,555 3,373,016 39.4%
Wisconsin 3,850,955 1,436,187 37.29%
Note: This indicator is compared with the state average. Data Source: Community Commons
8 I Midwest Medical CenterMidwest Medical Center Community Health Needs Assessment
POVERTY – CHILDREN BELOW 100% FPL
Poverty is considered a key driver of health status. Within the service area, 10.57% or 487 children are living in households
with income below 100% of the Federal Poverty Level (FPL). This indicator is relevant because poverty creates barriers to
access including health services, healthy food, and other necessities that contribute to poor health status.
Report Area Population Under Age 18 Population Under Age 18 Population Under Age 18
in Poverty Below 100% FPL in Poverty Below 100% FPL
Service Area Estimates 4,606 487 10.57%
Jo Daviess County, IL 4,361 500 11.47%
Grant County, WI 10,384 1,910 18.39%
Lafayette County, WI 4,124 721 17.48%
Illinois 3,011,614 612,922 20.35%
Wisconsin 1,291,469 239,549 18.55%
Note: This indicator is compared with the state average. Data Source: Community Commons
POVERTY – CHILDREN BELOW 200% FPL
Within the service area, 31.31% or 1,442 children are living in households with income below 200% of the Federal Poverty
Level (FPL). This indicator is relevant because poverty creates barriers to access including health services, healthy food,
and other necessities that contribute to poor health status.
Report Area Population Under Age 18 Population Under Age 18 Population Under Age 18
in Poverty Below 200% FPL in Poverty Below 200% FPL
Service Area Estimates 4,606 1,442 31.31%
Jo Daviess County, IL 4,361 1,445 33.13%
Grant County, WI 10,384 4,076 39.25%
Lafayette County, WI 4,124 1,719 41.68%
Illinois 3,011,614 1,243,877 41.3%
Wisconsin 1,291,469 508,522 39.38%
Note: This indicator is compared with the state average. Data Source: Community Commons
Midwest Medical Center I 9POPULATION IN POVERTY (100% FPL and 200% FPL)
Poverty is considered a key driver of health status. Within the service area, 8.86% or 2,054 individuals are living in households
with income below 100% of the Federal Poverty Level (FPL). This is lower than the Illinois statewide poverty level of 14.41%
and the Wisconsin statewide poverty level of 13.26%. Within the service area, 26.5% or 6,140 individuals are living in house-
holds with income below 200% of the Federal Poverty Level (FPL). This is lower than the Illinois statewide poverty level of
31.86% and lower than the Wisconsin statewide poverty level of 30.82%. This indicator is relevant because poverty creates
barriers to access including health services, nutritional food, and other necessities that contribute to poor health status.
Report Area Total Population Population Below 100% FPL Population Below 200% FPL
Service Area Estimates 23,170 2,054 6,140
Jo Daviess County, IL 22,183 1,988 5,898
Grant County, WI 47,266 7,851 16,730
Lafayette County, WI 16,665 1,862 5,220
Illinois 12,566,139 1,810,470 4,004,005
Wisconsin 5,571,083 738,557 1,717,264
Note: This indicator is compared with the state average. Data Source: Community Commons
INCOME – FAMILIES EARNING OVER $75,000
In the service area, 44.77%, or 2,990 families report a total annual income of $75,000 or greater. Total income includes all
reported income from wages and salaries as well as income from self-employment, interest or dividends, public assistance,
retirement, and other sources.
Report Area Total Families Families With Income Percent Families With
Over $75,000 Income Over $75,000
Service Area Estimates 6,679 2,990 44.77%
Jo Daviess County, IL 6,401 2,823 44.1%
Grant County, WI 12,162 4,408 36.24%
Lafayette County, WI 4,607 1,698 36.86%
Illinois 3,131,125 1,480,485 47.28%
Wisconsin 1,469,359 643,222 43.78%
Note: This indicator is compared with the state average. Data Source: Community Commons
10 I Midwest Medical CenterMidwest Medical Center Community Health Needs Assessment
POPULATION WITH ANY DISABILITY
Within the service area, 12.59% or 2,926 individuals are disabled in some way. This is higher than the statewide disabled
population level of 10.62% in Illinois and higher than the statewide disabled population level of 11.45% in Wisconsin. This
indicator is relevant because disabled individuals comprise a vulnerable population that requires targeted services and
outreach by providers.
Report Area Total Population (For Whom Total Population Percent Population
Disability Status is Determined) With a Disability With a Disability
Service Area Estimates 23,247 2,926 12.59%
Jo Daviess County, IL 22,264 2,673 12.01%
Grant County, WI 50,150 5,520 11.01%
Lafayette County, WI 16,748 1,791 10.69%
Illinois 12,690,056 1,347,468 10.62%
Wisconsin 5,649,703 646,635 11.45%
Note: This indicator is compared with the state average. Data Source: Community Commons
CHILDREN ELIGIBLE FOR FREE/REDUCED PRICE LUNCH
Within the service area, 1,180 public school students (33.76%) are eligible for free/reduced price lunch out of 3,495
total students enrolled. This is lower than the Illinois statewide free/reduced price lunch of 50.97% and lower than
the Wisconsin statewide free/reduced price lunch of 41.91%. This indicator is relevant because it assesses
vulnerable populations which are more likely to have multiple health access, health status, and social support needs.
Additionally, when combined with poverty data, providers can use this measure to identify gaps in eligibility and enrollment.
Report Area Total Students Number Free/ % of Free/Reduced Price
Reduced Price Eligible Lunch Eligible
Service Area Estimates 3,495 1,180 33.76%
Jo Daviess County, IL 3,353 1,091 32.54%
Grant County, WI 7,007 2,891 41.29%
Lafayette County, WI 2,678 1,068 39.88%
Illinois 2,049,231 1,044,588 50.97%
Wisconsin 873,841 365,711 41.91%
Note: This indicator is compared with the state average. Data Source: Community Commons
Midwest Medical Center I 11FOOD INSECURITY RATE
This indicator reports the estimated percentage of the population that experienced food insecurity at some point during the
report year. Food insecurity is the household-level economic and social condition of limited or uncertain access to adequate
food.
Report Area Total Population Food Insecure Percent Food Insecure
Population, Total Population
Service Area Estimates 23,878 2,751 11.52%
Jo Daviess County, IL 22,602 2,570 11.37%
Grant County, WI 51,080 6,390 12.51%
Lafayette County, WI 16,841 1,760 10.45%
Illinois 12,882,135 1,755,180 13.62%
Wisconsin 5,741,713 714,000 12.43%
Note: This indicator is compared with the state average. Data Source: Community Commons
INCOME – PER CAPITA INCOME
The per capita income for the service area is $29,513. This includes all reported income from wages and salaries as well as
income from self-employment, interest or dividends, public assistance, retirement, and other sources. The per capita income
in this service area is the average (mean) income computed for every man, woman, and child in the specified area.
Report Area Total Population Total Income (S) Per Capita Income ($)
Service Area Estimates 23,461 $692,415,492 $29,513
Jo Daviess County, IL 22,427 $661,072,768 $29,476
Grant County, IL 51,272 $1,145,593,856 $22,343
Lafayette County, WI 16,847 $410,567,808 $24,370
Illinois 12,868,747 $386,312,175,616 $30,019
Wisconsin 5,724,692 $159,757,680,640 $27,906
Note: This indicator is compared with the state average. Data Source: Community Commons
12 I Midwest Medical CenterMidwest Medical Center Community Health Needs Assessment
INCOME – PUBLIC ASSISTANCE INCOME
This indicator reports the percentage of households receiving public assistance income. Public assistance income includes
general assistance and Temporary Assistance to Needy Families (TANF). Separate payments received for hospital or other
medical care (vendor payments) are excluded. This does not include Supplemental Security Income (SSI) or non-cash
benefits such as food stamps.
Report Area Total Households Households With Percent Households With
Public Assistance Income Public Assistance Income
Service Area Estimates 9.904 78 0.79%
Jo Daviess County, IL 9,555 81 0.85%
Grant County, WI 19,472 314 1.61%
Lafayette County, WI 6,612 130 1.97%
Illinois 4,778,633 120,020 2.51%
Wisconsin 2,293,250 51,408 2.24%
Note: This indicator is compared with the state average. Data Source: Community Commons
INSURANCE – POPULATION RECEIVING MEDICAID
This indicator reports the percentage of the population with insurance enrolled in Medicaid (or other means-tested public
health insurance). This indicator is relevant because it assesses vulnerable populations which are more likely to have multiple
health access, health status, and social support needs. When combined with poverty data, providers can use this measure
to identify gaps in eligibility and enrollment.
Report Area Total Population For Population With Any Population Receiving Percent of Insured
Whom Insurance Status Health Insurance Medicaid Population Receiving
is Determined Medicaid
Service Area Estimates 23,247 21,664 2,834 13.08%
Jo Daviess County, IL 22,264 20,607 2,709 13.15%
Grant County, WI 50,150 45,480 8,188 18.0%
Lafayette County, WI 16,748 14,736 2,455 16.66%
Illinois 12,690,056 11,126,169 2,282,641 20.52%
Wisconsin 5,649,703 5,159,942 988,556 19.16%
Note: This indicator is compared with the state average. Data Source: Community Commons
Midwest Medical Center I 13INSURANCE – UNINSURED ADULTS
The lack of health insurance is considered a key driver of health status. This indicator reports the percentage of adults age 18
to 64 without health insurance coverage. This indicator is relevant because lack of insurance is a primary barrier to healthcare
access including regular primary care, specialty care, and other health services that contributes to poor health status.
Report Area Total Population Population With % Population With Population Without % Population Without
Age 18-64 Medical Insurance Medical Insurance Medical Insurance Medical Insurance
Service Area Estimates 13,167 11,072 84.09% 2,094 15.91%
Jo Daviess County, IL 12,494 11,090 88.76% 1,404 11.24%
Grant County, WI 28,835 25,429 88.19% 3,406 11.81%
Lafayette County, WI 9,844 8,466 86.0% 1,378 14.0%
Illinois 7,910,376 6,800,762 85.97% 1,109,614 14.03%
Wisconsin 3,485,151 3,132,934 89.89% 352,217 10.11%
Note: This indicator is compared with the state average. Data Source: Community Commons
INSURANCE – UNINSURED CHILDREN
The lack of health insurance is considered a key driver of health status. This indicator reports the percentage of children under
age 19 without health insurance coverage. This indicator is relevant because lack of insurance is a primary barrier to health-
care access including regular primary care, specialty care, and other health services that contributes to poor health status.
Report Area Total Population Population With % Population With Population Without % Population Without
Under Age 19 Medical Insurance Medical Insurance Medical Insurance Medical Insurance
Service Area Estimates 4,915 4,640 94.41% 276 5.61%
Jo Daviess County, IL 4,486 4,271 95.21% 215 4.79%
Grant County, WI 10,803 10,039 92.93% 764 7.07%
Lafayette County, WI 4,302 3,807 88.49% 495 11.51%
Illinois 3,099,273 2,983,260 96.26% 116,013 3.74%
Wisconsin 1,338,933 1,278,131 95.46% 60,802 4.54%
Note: This indicator is compared with the state average. Data Source: Community Commons
14 I Midwest Medical CenterMidwest Medical Center Community Health Needs Assessment
POPULATION RECEIVING SNAP BENEFITS
This indicator reports the estimated percentage of households receiving the Supplemental Nutrition Assistance Program
(SNAP) benefits. This indicator is relevant because it assesses vulnerable populations which are more likely to have multiple
health access, health status, and social support needs. When combined with poverty data, providers can use this measure
to identify gaps in eligibility and enrollment.
Report Area Total Households Households Receiving % Households Receiving
SNAP Benefits SNAP Benefits
Service Area Estimates 9,904 582 5.88%
Jo Daviess County, IL 9,555 562 5.88%
Grant County, WI 19,472 1,925 9.89%
Lafayette County, WI 6,612 670 10.13%
Illinois 4,778,633 599,455 12.54%
Wisconsin 2,293,250 290,441 12.67%
Note: This indicator is compared with the state average. Data Source: Community Commons
POPULATION WITH LOW FOOD ACCESS
The indicator reports the percentage of the population living in census tracts designated as food deserts. A food desert is
defined as a low-income census tract where a substantial number or share of residents has low access to a supermarket
or large grocery store. This indicator is relevant because it highlights populations and geographies facing food insecurity.
Report Area Total Population Population With % Population With
Low Food Access Low Food Access
Service Area Estimates 23,954 4,119 17.2%
Jo Daviess County, IL 22,678 4,411 19.45%
Grant County, WI 51,208 8,427 16.46%
Lafayette County, WI 16,836 2,590 15.38%
Illinois 12,830,632 2,623,048 20.44%
Wisconsin 5,686,986 1,317,596 23.17%
Note: This indicator is compared with the state average. Data Source: Community Commons
LOW INCOME POPULATION WITH LOW FOOD ACCESS
This indicator reports the percentage of the population of low income residents that have low food access. It further focuses
data provided for the entire population in the chart above.
Report Area Total Population Low Income Population With % Population With
Low Food Access Low Food Access
Service Area Estimates 23,954 939 3.92%
Jo Daviess County, IL 22,678 1,001 4.41%
Grant County, WI 51,208 2,714 5.30%
Lafayette County, WI 16,836 702 4.17%
Illinois 12,830,632 584,658 4.56%
Wisconsin 5,686,986 301,930 5.31%
Note: This indicator is compared with the state average. Data Source: Community Commons
Midwest Medical Center I 15UNEMPLOYMENT RATE
Total unemployment in the service area for August 2016 was 671 or 5.4% of the civilian non-institutionalized population age
16 and older (non-seasonally adjusted). This indicator is relevant because unemployment creates financial instability and
barriers to access including insurance coverage, health services, healthy food, and other necessities that contribute to poor
health status.
Report Area Labor Force Number Employed Number Unemployed Unemployment Rate
Service Area Estimates 12,545 11,874 671 5.4%
Jo Daviess County, IL 11,746 11,086 660 5.6%
Grant County, WI 28,343 27,260 1,083 3.8%
Lafayette County, WI 9,692 9,399 293 3.0%
Illinois 6,592,749 6,224,159 368,590 5.6%
Wisconsin 3,109,874 2,990,899 118,975 3.8%
Note: This indicator is compared with the state average. Data Source: Community Commons
GROCERY STORE ACCESS
This indicator reports the number of grocery stores per 100,000 population. Grocery stores are defined as supermarkets and
smaller grocery stores primarily engaged in retailing a general line of food such as canned and frozen foods, fresh fruits and
vegetables, and fresh and prepared meats, fish, and poultry. Included are delicatessen-type establishments. Convenience
stores and large general merchandise stores that also retail food, such as supercenters and warehouse club stores, are
excluded. This indicator is relevant because it provides a measure of healthy food access and environmental influences
on dietary behaviors.
Report Area Total Population Number of Establishments, Rate
Establishments Per 100,000 Population
Service Area Estimates 23,955 4 16.70%
Jo Daviess County, IL 22,678 4 17.64
Grant County, WI 51,208 11 21.48
Lafayette County, WI 16,836 6 35.64
Illinois 12,830,632 2,850 22.2
Wisconsin 5,686,986 1,027 18.1
Note: This indicator is compared with the state average. Data Source: Community Commons
16 I Midwest Medical CenterMidwest Medical Center Community Health Needs Assessment
RECREATION AND FITNESS FACILITY ACCESS
This indicator reports the number per 100,000 population of recreation and fitness facilities as defined by North American
Industry Classification System (NAICS) Code 713940. This indicator is relevant because access to recreation and fitness
facilities encourages physical activity and other health behaviors.
Report Area Total Population Number of Establishments, Rate per
Establishments 100,000 Population
Service Area Estimates 23,955 1 4.17
Jo Daviess County, IL 22,678 1 4.41
Grant County, WI 51,069 26 50.9
Lafayette County, WI 16,766 4 23.9
Illinois 12,882,135 10,428 80.9
Wisconsin 5,742,713 4,706 81.9
Data Source: Community Commons
ACCESS TO DENTISTS
This indicator reports the number of dentists per 100,000 population. This indicator includes all dentists qualified as having a
doctorate in dental surgery (D.D.S.) or dental medicine (D.M.D.), who are licensed by the state to practice dentistry and who
are practicing within the scope of that license.
Report Area Total Population, 2013 Dentists, 2013 Dentists, Rate per
100,000 Population
Service Area Estimates 23,699 9 38.00
Jo Daviess County, IL 22,407 9 40.2
Grant County, WI 51,069 16 31.3
Lafayette County, WI 16,766 5 29.8
Illinois 12,882,135 8,865 68.8
Wisconsin 5,742,713 3,522 61.3
Data Source: Community Commons
Midwest Medical Center I 17ACCESS TO MENTAL HEALTH PROVIDERS
This indicator reports the rate of the county population to the number of mental health providers including psychiatrists,
psychologists, clinical social workers, and counselors that specialize in mental healthcare.
Report Area Estimated Population Number of Mental Ratio of Mental Health Mental Health Care
Health Providers Providers to Population Provider Rate
(1 Provider per X persons) (Per 100,000 Population)
Service Area Estimates No data No data No data No data
Jo Daviess County, IL 22,252 10 2,225.2 44.9
Grant County, WI 51,830 49 1,057.8 94.5
Lafayette County, WI 16,853 28 601.9 166.1
Illinois 12,806,917 23,090 554.7 180.2
Wisconsin 5,745,786 9,813 585.5 170.7
Data Source: Community Commons
DENTAL CARE UTILIZATION
This indicator reports the percentage of adults aged 18 and over who self-report that they have not visited a dentist, dental
hygienist, or dental clinic within the past year. This indicator is relevant because engaging in preventive behaviors decreases
the likelihood of developing future health problems. This indicator can also highlight a lack of access to preventative care, a
lack of health knowledge, insufficient provider outreach, and/or social barriers preventing utilization of services.
Report Area Total Population Total Adults Without Percent Adults With
Age 18+ Recent Dental Exam No Dental Exam
Service Area Estimates Suppressed Suppressed Suppressed
Jo Daviess County, IL 18,034 5,397 29.9%
Grant County, WI 39,899 13,015 32.6%
Lafayette County, WI 12,431 4,016 32.3%
Illinois 9,654,603 2,981,670 30.9%
Wisconsin 4,326,412 1,086,059 25.1%
Data Source: Community Commons
18 I Midwest Medical CenterMidwest Medical Center Community Health Needs Assessment
PREVENTABLE HOSPITAL EVENTS
This indicator reports the discharge rate (per 1,000 Medicare enrollees) for conditions that are Ambulatory Care Sensitive
(ACS). ACS conditions include pneumonia, dehydration, asthma, diabetes, and other conditions which could have been
prevented if adequate primary care resources were available and accessed by those patients. This indicator is relevant
because analysis of ACS discharges allows demonstrating a possible “return on investment” from interventions that reduce
admissions (for example, uninsured or Medicaid patients) through better access to primary care resources.
Report Area Total Medicare Ambulatory Care Sensitive Ambulatory Care Sensitive
Part A Enrollees Condition Hospital Discharges Condition Hospital
Discharge Rate
Service Area Estimates 4,995 244 48.94
Jo Daviess County, IL 4,599 223 48.5
Grant County, WI 8,189 417 50.9
Lafayette County, WI 2,276 145 64.1
Illinois 1,420,984 92,604 65.2
Wisconsin 547,961 27,710 50.6
Data Source: Community Commons
Overall, the service area of Midwest Medical Center is similarly to slightly better positioned in many key economic and other
demographic indicators when compared not only to state and federal measures but also to the overall data from the counties
touched.
Midwest Medical Center I 19II. ESTABLISHING THE CHNA INFRASTRUCTURE AND PARTNERSHIPS
Midwest Medical Center led the planning, implementation, and completion of the Community Health Needs Assessment
through a consulting arrangement with the Illinois Critical Access Hospital Network. Terry Madsen, an ICAHN consultant,
attorney, and former educator and community development specialist, met with hospital executive staff to define the
community, scope of the project, and special needs and concerns. An internal working group, possible local sources
for secondary data and key external contacts were identified, and a timeline was established.
Internal
Midwest Medical Center undertook a three-month planning and implementation effort to develop the CHNA, identify and
prioritize community health needs for its service area. These planning and development activities included the following steps:
• The project was overseen at the operational level by the CEO.
• Arrangements were made with ICAHN to facilitate two focus groups and a meeting to identify and prioritize significant
needs. ICAHN was also engaged to collect, analyze, and present secondary data and to prepare a final report for
submission to Midwest Medical Center.
• The CEO worked closely with ICAHN’s consultant to identify and engage key community partners and to coordinate local
meetings and group activities.
External
Midwest Medical Center also leveraged existing relationships that provided diverse input for a comprehensive review and
analysis of community health needs in the hospital’s service area. These external steps included:
• The CEO secured the participation of a diverse group representatives from the community and the health profession.
• The ICAHN consultant provided secondary data from multiple sources set out below in the quantitative data list.
• Participation included representatives of the county health department serving the great majority of the area served
by the hospital.
III. DEFINING THE PURPOSE AND SCOPE
The purpose of the CHNA was to 1) evaluate current health needs of the hospital’s service area, and 2) identify resources
and assets available to support initiatives to address the health priorities identified.
20 I Midwest Medical CenterMidwest Medical Center Community Health Needs Assessment
IV. DATA COLLECTION AND ANALYSIS
The overarching framework used to guide the CHNA planning and implementation is consistent with the Catholic Health
Association’s (CHA) Community Commons CHNA flow chart shown below:
Starter Tools Choose Data Collection & Interpretation Identification,
& Resources Geographic Partners Prioritization
CHNA Data Platform Community & Selection
Assets & of Health
Resources
Health Drivers of Data
Needs
Why do a CHNA? Metropolitan Outcomes Health Platform Other
Data Data
(broken out by stakeholder) Statistical Area Data Report Secondary
Data Interpretation
Process
Community
Key Community
Where Service Input Health
Demographics Driver
to begin? Area Needs
Data Public
Health
Expert Input Prioritization
• Drawn from exemplary data sets Process
Effective Processes State
& Practices
Implementation Strategy Development
Guidelines County Selection Prioritized
& Checklists Health Drivers of Needs that of Needs Community
Outcomes Health will be
addressed Health
Data Data Needs
Applying
References Zip Code Evidence,
Leveraging
Resources
FAQ Custom
Implementation Needs that
will not be CHNA
Strategy addressed Report
Report
Midwest Medical Center I 21DESCRIPTION OF DATA SOURCES Quantitative The following quantitative sources were reviewed for health information: Source and Description Behavioral Risk Factor Surveillance System – The BRFSS is the largest, continuously conducted telephone health survey in the world. It enables the Centers for Disease Control and Prevention (CDC), state health departments, and other health agencies to monitor modifiable risk factors for chronic diseases and other leading causes of death. US Census – National census data is collected by the US Census Bureau every 10 years. Centers for Disease Control and Prevention – Through the CDC’s National Vital Statistics System, states collect and disseminate vital statistics as part of the US’s oldest and most successful intergovernmental public health data sharing system. County Health Rankings – Each year, the overall health of each county in all 50 states is assessed and ranked using the latest publicly available data through a collaboration of the Robert Wood Johnson Foundation and the University of Wisconsin Population Health Institute. Community Commons – Community Commons is an interactive mapping, networking, and learning utility for the broad-based healthy, sustainable, and livable communities’ movement. Illinois Department of Employment Security – The IDES is the state’s employment agency. It collects and analyzes employment information. National Cancer Institute – The National Cancer Institute coordinates the National Cancer Program, which conducts and supports research, training, health information dissemination, and other programs with respect to the cause, diagnosis, prevention, and treatment of cancer, rehabilitation from cancer, and the continuing care of cancer patients and the families of cancer patients. Illinois Department of Public Health – The IDPH is the state agency responsible for preventing and controlling disease and injury, regulating medical practitioners, and promoting sanitation. HRSA – The Health Resources and Services Administration of the U.S. Department of Health and Human Services develops health professional shortage criteria for the nation and uses that data to determine the location of Health Professional Shortage Areas and Medically Underserved Areas and Populations. Local IPLANs – The Illinois Project for Local Assessment of Needs (IPLAN) is a community health assessment and planning process that is conducted every five years by local health jurisdictions in Illinois. Environmental Systems Research Institute – ESRI is an international supplier of Geographic Information System (GIS) software, web GIS, and geodatabase management applications. ESRI allows for specialized inquiries at the zip code, or other defined, level. Illinois State Board of Education – The ISBE administers public education in the state of Illinois. Each year, it releases school ‘report cards’ which analyze the make-up, needs, and performance of local schools. U.S. Department of Agriculture – USDA, among its many functions, collects and analyzes information related to nutrition and local production and food availability. 22 I Midwest Medical Center
Midwest Medical Center Community Health Needs Assessment

SECONDARY DATA DISCUSSION
The County Health Rankings rank the health of nearly every county in the nation and show that much of what affects health
occurs outside of the doctor’s office. The County Health Rankings confirm the critical role that factors such as education,
jobs, income, and environment play in how healthy people are and how long they live.

Published by the University of Wisconsin Population Health Institute and the Robert Wood Johnson Foundation, the Rankings
help counties understand what influences how healthy residents are and how long they will live. The Rankings look at a variety
of measures that affect health such as the rate of people dying before age 75, high school graduation rates, access to
healthier foods, air pollution levels, income, and rates of smoking, obesity, and teen births. The Rankings, based on the latest
data publicly available for each county, are unique in their ability to measure the overall health of each county in all 50 states
on the multiple factors that influence health. (County Health Rankings and Roadmaps, 2016)

Jo Daviess County is ranked 5th out of 102 Illinois counties in the Rankings for Health Outcomes, released in April 2016.
Grant County is ranked 37th out of the 72 Wisconsin counties in the Rankings, released in April 2016.

HEALTH RANKING OBSERVATIONS
Table 1. Health Ranking Observations for Jo Daviess County, IL, and Grant County, WI

        Observation             Jo Daviess County, IL         Illinois             Grant County, WI               Wisconsin
       Adults reporting                 12%                    17%                       13%                        15%
      poor or fair health
  Adults reporting no leisure           28%                    22%                       23%                        22%
    time physical activity
        Adult obesity                   29%                    27%                       30%                        29%
    Children under age 18               16%                    20%                       19%                        18%
        living in poverty
          Uninsured                     13%                    15%                       12%                        11%
        Teen birth rate               22/1,000               33/1,000                  14/1,000                   26/1,000
        (ages 15-19)
      Alcohol-impaired                  36%                    36%                       33%                        38%
       driving deaths
       Unemployment                     6.2%                  7.1%                       4.8%                       5.5%

                                                                                             Midwest Medical Center I 23
The Illinois Behavioral Risk Factor Surveillance System provides health data trends through the Illinois Department of Public
Health in cooperation with the Centers for Disease Control and Prevention, Office of Surveillance, Epidemiology, and
Laboratory Services.
The following tables reflect information from the IBRFSS that indicate areas of likely healthcare needs.
Table 2. Diagnosed Disease Factors – Jo Daviess County
35%
33% 33%
30%
30% 29% 29%
26%
25%
25%
20%
15%
12% 12%
10% 10%
7%
5%
0%
Arthritis High Blood Pressure Diabetes
2006 2009 2014 Illinois
IBFRSS, 2016 Report
Diagnosis of arthritis is above the state level and has increased over the recent past. Diagnosis of high blood pressure was
equal to the state level in 2006 and increased over the state level in 2009. Data for high blood pressure in 2014 was not
availlable. Diagnosis of diabetes was below the state level in 2006 and increased over the state level in 2009 and 2014.
24 I Midwest Medical CenterMidwest Medical Center Community Health Needs Assessment
Table 3. Health Risk Factors – Jo Daviess County
35%
30% 30%
29%
28%
25% 24%
23%
22%
20% 20%
20%
17%
16%
15%
15%
11%
10%
5%
0%
Alcohol Tobacco Obesity
2006 2009 2014 Illinois
IBFRSS, 2016 Report
Tobacco use has decreased and remains below the state level. The rate of persons reporting obesity has increased
and is similar to the state level in the IBRFSS and the more recent data from the County Health Rankings. Alcohol use
remains above the state level and is decreasing.
ADDITIONAL DIAGNOSED DISEASE FACTORS (Jo Daviess County)
Disease Factor Jo Daviess County, 2014 Illinois, 2014
COPD 4.6% 5.8%
Kidney disease 1.5% 2.6%
Skin cancer 8.6% 4.2%
Other cancer 9.7% 5.4%
IBFRSS, 2016 Report
In 2016, the IBRFSS released additional diagnosed disease factors. These new measures can be seen in the table above.
There are no linear comparisons available for the new factor.
Midwest Medical Center I 25TEEN BIRTHS
The indicator reports the rate of total births to women between the ages of 15-19. This indicator is relevant because in many
cases, teen parents have unique social, economic, and health support services. Additionally, high rates of teen pregnancy
may indicate the prevalence of unsafe sex practices.
Report Area Female Population Births to Mothers Teen Birth Rate
Ages 15-19 Ages 15-19 (Per 1,000 Population)
Service Area Estimates Suppressed Suppressed Suppressed
Jo Daviess County, IL 592 13 22.03
Grant County, WI 2,055 31 15.08
Lafayette County, WI 567 10 17.64
Illinois 448,356 15,692 35.0
Wisconsin 194,406 5,346 27.5
Note: This indicator is compared with the state average. Data Source: Community Commons, 2016
LOW BIRTH WEIGHT
This indicator reports the percentage of total births that are low birth weight (under 2,500 grams). This indicator is relevant
because low birth weight infants are at high risk for health problems. This indicator can also highlight the existence of health
Report Area Female Population Births to Mothers Teen Birth Rate, Percentage
Ages 15-19 Ages 15-19 (Per 1,000 Population)
Service Area Estimates Suppressed Suppressed Suppressed
Jo Daviess County, IL 1,547 107 6.9%
Grant County, WI 4,095 233 5.7%
Lafayette County, WI 1,435 85 5.9%
Illinois 1,251,656 105,139 8.4%
Wisconsin 499,401 34,958 7.0%
Note: This indicator is compared with the state average. Data Source: Community Commons, 2016
26 I Midwest Medical CenterMidwest Medical Center Community Health Needs Assessment
CANCER PROFILES
The State Cancer Profiles compiled by the National Cancer Institute lists Jo Daviess County, IL, at a Level 8 for all cancers,
which means that the cancer rate is similar to the U.S. rate and is falling over the recent past. The State Cancer Profiles
compiled by the National Cancer Institute lists Grant County, WI, at Level 6 for all cancers, which means that the cancer rate
overall is similar to the U.S. rate and is stable over the recent past. This is confirmed by the local cancer data set out on
pages below.
Cancer Incidence – Breast
The indicator reports the age adjusted incidence rate (cases per 100,000 population per year) of breast cancer adjusted to
2000 U.S. standard population age groups (under age 1, 1-4, 5-9, ..., 80-84, 85 and older). This indicator is relevant because
cancer is a leading cause of death, and it is important to identify cancers separately to better target interventions.
Report Area Female Population Average New Cases Annual Incidence Rate
Per Year (Per 100,000 Population)
Service Area Estimates Suppressed Suppressed Suppressed
Jo Daviess County, IL 1,830 19 103.8
Grant County, WI 2,965 32 107.9
Lafayette County, WI 1,081 11 101.7
Illinois 732,106 9,349 127.7
Wisconsin 335,111 4,209 125.5
Note: This indicator is compared with the state average. Data Source: Community Commons, 2016
Cancer Incidence – Colon and Rectum
The indicator reports the age adjusted incidence rate (cases per 100,000 population per year) of colon and rectum cancer
adjusted to 2000 U.S. standard population age groups (under age 1, 1-4, 5-9, ..., 80-84, 85 and older). This indicator is
relevant because cancer is a leading cause of death, and it is important to identify cancers separately to better target
interventions.
Report Area Total Population Average New Cases Annual Incidence Rate
Per Year (Per 100,000 Population)
Service Area Estimates Suppressed Suppressed Suppressed
Jo Daviess County, IL 3,496 15 42.9
Grant County, WI 6,220 26 41.8
Lafayette County, WI 2,093 9 43
Illinois 1,359,829 6,364 46.8
Wisconsin 645,679 2,615 40.5
Note: This indicator is compared with the state average. Data Source: Community Commons, 2016
Midwest Medical Center I 27Cancer Incidence – Lung
The indicator reports the age adjusted incidence rate (cases per 100,000 population per year) of lung cancer adjusted
to 2000 U.S. standard population age groups (under age 1, 1-4, 5-9, ..., 80-84, 85 and older). This indicator is relevant
because cancer is a leading cause of death, and it is important to identify cancers separately to better target interventions.
Report Area Total Population Average New Cases Annual Incidence Rate
Per Year (Per 100,000 Population)
Service Area Estimates Suppressed Suppressed Suppressed
Jo Daviess County, IL 3,689 19 51.5
Grant County, WI 6,335 34 53.5
Lafayette County, WI 2,135 11 51.5
Illinois 1,346,397 9,344 69.4
Wisconsin 644,570 3,977 61.7
Note: This indicator is compared with the state average. Data Source: Community Commons, 2016
Cancer Incidence – Prostate
The indicator reports the age adjusted incidence rate (cases per 100,000 population per year) of prostate cancer adjusted
to 2000 U.S. standard population age groups (under age 1, 1-4, 5-9, ..., 80-84, 85 and older). This indicator is relevant
because cancer is a leading cause of death, and it is important to identify cancers separately to better target interventions.
Report Area Total Male Population Average New Cases Annual Incidence Rate
Per Year (Per 100,000 Population)
Service Area Estimates Suppressed Suppressed Suppressed
Jo Daviess County, IL 1,805 24 132.9
Grant County, WI 2,955 37 125.2
Lafayette, WI 993 12 120.8
Illinois 631,965 8,778 138.9
Wisconsin 312,422 4,049 129.6
Note: This indicator is compared with the state average. Data Source: Community Commons, 2016
28 I Midwest Medical CenterMidwest Medical Center Community Health Needs Assessment
MORTALITY
Mortality – Cancer
This indicator reports the rate of death due to malignant neoplasm (cancer) per 100,000 population. Figures are reported
as crude rates, and as rates age-adjusted to year 2000 standard. Rates are resummarized for report areas from county level
data, only where data is available. This indicator is relevant because cancer is a leading cause of death in the United States.
Report Area Total Population Average Annual Deaths, Crude Death Rate Age-Adjusted Death Rate
2007-2011 (Per 100,000 Population) (Per 100,000 Population)
Service Area Estimates Suppressed Suppressed Suppressed Suppressed
Jo Daviess County, IL 22,606 62 274.3 167.6
Grant County, WI 51,098 108 211.4 168.4
Lafayette County, WI 16,824 36 214.0 167.2
Illinois 12,850,811 24,263 188.8 176.5
Wisconsin 5,707,426 11,268 197.7 170.1
Note: This indicator is compared with the state average. Data Source: Community Commons, 2016
Red numbers indicate rates that exceed state levels. The green highlights that the indicated service area is below the state level.
Mortality – Heart Disease
Within the service area, the rate of death due to coronary heart disease per 100,000 population is 212.54. Figures are
reported as crude rates, and as rates age-adjusted to the year 2000 standard. Rates are resummarized for report areas
from county level data, only where data is available. This indicator is relevant because heart disease is a leading cause
of death in the United States.
Report Area Total Population Average Annual Deaths, Crude Death Rate Age-Adjusted Death Rate
2007-2011 (Per 100,000 Population) (Per 100,000 Population)
Service Area Estimates Suppressed Suppressed Suppressed Suppressed
Jo Daviess County, IL 22,606 54 239.76 145.3
Grant County, WI 51,098 106 207.05 155.3
Lafayette County, WI 16,824 36 211.6 162.7
Illinois 12,850,811 24,877 193.58 177.4
Wisconsin 5,707,426 11,172 195.74 162.3
Note: This indicator is compared with the state average. Data Source: Community Commons, 2016
Midwest Medical Center I 29Mortality – Ischaemic Heart Disease
Within the service area, the rate of death due to ischaemic heart disease per 100,000 population is 103.4. This rate is
greater than the Healthy People 2020 target of less than or equal to 103.4. Figures are reported as crude rates, and as rates
age-adjusted to the year 2000 standard. Rates are resummarized for report areas from county level data, only where data is
available. This indicator is relevant because heart disease is a leading cause of death in the United States.
Report Area Total Population Average Annual Deaths, Crude Death Rate Age-Adjusted Death Rate
2007-2011 (Per 100,000 Population) (Per 100,000 Population)
Service Area Estimates Suppressed Suppressed Suppressed Suppressed
Jo Daviess County, IL 22,606 31 138 83.4
Grant County, WI 51,098 63 122.5 92.4
Lafayette County, WI 16,824 25 148.6 115.1
Illinois 12,850,811 14,927 116.2 106.5
Wisconsin 5,707,426 6,728 117.9 98.3
Note: This indicator is compared with the state average. Data Source: Community Commons, 2016
Cancer Incidence – Lung Disease
This indicator reports the rate of death due to chronic lower respiratory disease per 100,000 population. Figures are reported
as crude rates, and as rates age-adjusted to the year 2000 standard. Rates are resummarized for report areas from
county level data, only where data is available. This indicator is relevant because lung disease is a leading cause of death
in the United States.
Report Area Total Population Average Annual Deaths, Crude Death Rate Age-Adjusted Death Rate
2007-2011 (Per 100,000 Population) (Per 100,000 Population)
Service Area Estimates Suppressed Suppressed Suppressed Suppressed
Jo Daviess County, IL 22,606 11 50.43 30.7
Grant County, WI 51,098 31 61.06 45.4
Lafayette County, WI 16,824 5 30.91 24.3
Illinois 12,850,811 5,353 41.65 39.5
Wisconsin 5,707,426 2,573 45.07 38.7
Note: This indicator is compared with the state average. Data Source: Community Commons, 2016
30 I Midwest Medical CenterMidwest Medical Center Community Health Needs Assessment
Mortality – Stroke
The Healthy People 2020 target is less than or equal to 33.8. Figures are reported as crude rates, and as rates age-adjusted
to year 2000 standard. Rates are resummarzied for report areas from county level data, only where data is available. This
indicator is relevant because stroke is a leading cause of death in the United States.
Report Area Total Population Average Annual Deaths, Crude Death Rate Age-Adjusted Death Rate
2007-2011 (Per 100,000 Population) (Per 100,000 Population)
Service Area Estimates Suppressed Suppressed Suppressed Suppressed
Jo Daviess County, IL 22,606 17 73.4 42.7
Grant County, WI 51,098 32 63.4 44.0
Lafayette County, WI 16,824 6 33.3 25.5
Illinois 12,850,811 5,322 41.4 38.2
Wisconsin 5,707,426 2,544 44.6 37.1
Note: This indicator is compared with the state average. Data Source: Community Commons, 2016
Mortality – Unintentional Injury
This indicator reports the rate of death due to unintentional injury (accident) per 100,000 population. Figures are reported as
crude rates, and as rates age-adjusted to year 2000 standard. Rates are resummarized for report areas from county level
data, only where data is available. This indicator is relevant because accidents are a leading cause of death in the U.S.
Report Area Total Population Average Annual Deaths, Crude Death Rate Age-Adjusted Death Rate
2007-2011 (Per 100,000 Population) (Per 100,000 Population)
Service Area Estimates Suppressed Suppressed Suppressed Suppressed
Jo Daviess County, IL 22,606 10 44.24 34.6
Grant County, WI 51,098 19 37.97 32.4
Lafayette County, WI 16,824 9 53.49 54.5
Illinois 12,850,811 4,225 32.87 31.9
Wisconsin 5,707,426 2,690 47.12 43.1
Note: This indicator is compared with the state average. Data Source: Community Commons, 2016
Midwest Medical Center I 31Mortality – Premature Death
This indicator reports Years of Potential Life Lost (YPLL) before age 75 per 100,000 population for all causes of death,
age-adjusted to the 2000 standard. YPLL measures premature death and is calculated by subtracting the age of death
from the 75-year benchmark. This indicator is relevant because a measure of premature death can provide a unique
and comprehensive look at overall health status.
Report Area Total Population Total Premature Total Years of Years of Potential Life
2008-2010 Average Deaths Potential Life Lost Lost, Rate Per 100,000
2008-2010 Average Population
Service Area Estimates Suppressed Suppressed Suppressed Suppressed
Jo Daviess County, IL 22,678 81 1,083 4,776
Grant County, WI 51,208 155 3,029 5,914
Lafayette County, WI 16,836 48 887 5,271
Illinois 12,830,632 43,349 809,525 6,309
Wisconsin 5,686,986 18,931 341,235 6,000
Note: This indicator is compared with the state average. Data Source: Community Commons, 2016
Infant Mortality
This indicator reports the rate of deaths to infants less than one year of age per 1,000 births. This indicator is relevant
because high rates of infant mortality indicate the existence of broader issues pertaining to access to care and maternal
and child health.
Report Area Total Births Total Infant Deaths Infant Mortality Rate
Per 1,000 Births
Service Area Estimates Suppressed Suppressed Suppressed
Jo Daviess County, IL 1,085 5 4.7
Grant County, WI 2,920 12 4.1
Lafayette County, WI 1,050 6 5.8
Illinois 879,035 6,065 6.9
Wisconsin 357,880 2,290 6.4
Note: This indicator is compared with the state average. Data Source: Community Commons, 2016
32 I Midwest Medical CenterYou can also read