2017 Kentucky Minority Health Status Report - The Cabinet for Health and Family Services presents: The Department for Public Health, ASTHO
←
→
Page content transcription
If your browser does not render page correctly, please read the page content below
2017
Kentucky Minority Health Status Report

                            The Cabinet for Health and Family Services
                            presents: The Department for Public Health,
                              Office of Health Equity 2017 Minority
                                       Health Status Report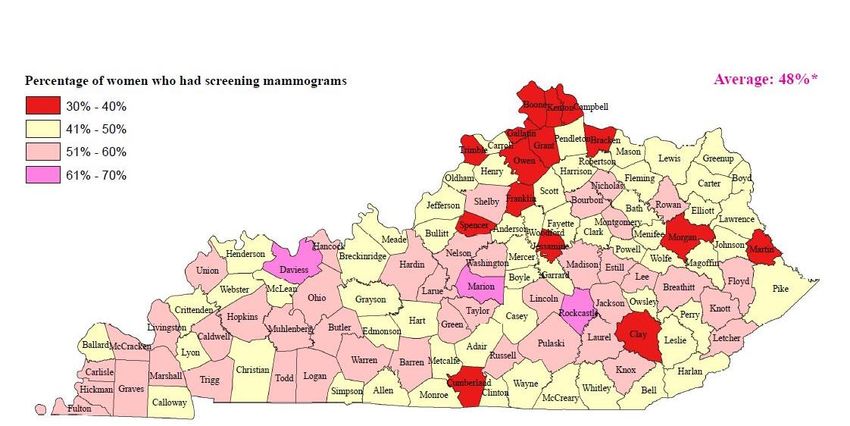
The 2017 Kentucky Minority Health Status Report
DEPARTMENT FOR PUBLIC HEALTH
On behalf of the
CABINET FOR HEALTH AND FAMILY SERVICES

For More Information

To access or download copies of this report, visit:
http://chfs.ky.gov/dph/officeofhealthequity

For more information about the legislation requiring the Minority Health Status
Report (KRS 216.2929, Section 4), visit: http://www.lrc.ky.gov/Statutes/search.aspx

Suggested Citation
The 2017 Minority Health Status Report. Kentucky Cabinet for Health and
Family Services, Department for Public Health, Office of Health Equity.
Frankfort, KY: 2017.
Message from the Commissioner
Through the Office of Health Equity (OHE), the Kentucky Department for Public Health (DPH) works to
eliminate health disparities and inequities among racial and ethnic minorities, rural, and low-income
populations in the state of Kentucky. DPH fosters a model of inclusion through partnerships with local
health departments, state agencies and legislators to strengthen efforts to improve the health of the
commonwealth. It is through these partnerships that health disparities and inequities among Kentuckians
will be reduced and lives will be saved.

The 2017 Kentucky Minority Health Status Report is a biennial report compiled by OHE to monitor trends
of health disparities and inequities in Kentucky. The report serves as a tool to educate and raise awareness
regarding the health of disparate populations, as well as a resource with potential to influence policy.

Health equity is defined in Healthy People 2020 (HP2020) as “…the attainment of the highest level of
health for all people.” Health inequities are often rooted in social injustices, both conscious and
unintentional, which render individuals and populations vulnerable to adverse health outcomes. Achieving
health equity through the improvement of Kentucky’s health outcomes will require addressing the
conditions in which Kentuckians live, learn, work, and play through both population-based and targeted
methods focused on the areas of greatest need.

Many opportunities exist in Kentucky to promote health equity. Socioeconomic factors, such as extensive
poverty and poor educational achievement along with social indicators such as poor access to healthcare
and food insecurity, provide opportunities to create a culture of health in all communities across the
commonwealth. The Department for Public Health’s State Health Improvement Plan (SHIP) integrates a
heath equity framework into five focus areas targeted towards improving health outcomes in Kentucky.
The department will utilize partnerships to leverage resources to promote initiatives that address the
significant health disparities affecting minority and vulnerable populations in the Commonwealth of
Kentucky.

Sincerely,

Jeffery D. Howard Jr., MD
Acting Commissioner
Department for Public Health

Table of Contents
Executive Summary ....................................................................................................................... iii
   Key Findings from the 2017 Kentucky Minority Health Status Report ..................................... iii
Introduction ................................................................................................................................... iv
   Historical Context ..................................................................................................................... iv
Full Report....................................................................................................................................... 1
   Demographics.............................................................................................................................. 1
       Race and Ethnicity................................................................................................................... 1
       Age by Race and Ethnicity ...................................................................................................... 1
       Race by Counties ..................................................................................................................... 3
   Social Risk Factors .................................................................................................................... 4
       Education ................................................................................................................................. 4
       Income, Poverty, and Unemployment ..................................................................................... 5
       Adverse Childhood Experiences ........................................................................................... 6
       Juvenile Justice ....................................................................................................................... 6
       Home Ownership ..................................................................................................................... 7
       Health Insurance Status ........................................................................................................... 8
   Health Risk Factors ..................................................................................................................... 9
       Preventive Health Screenings .................................................................................................. 9
       Mental Health ........................................................................................................................ 11
       Intellectual and Developmental Disabilities .......................................................................... 12
       Oral Health ............................................................................................................................ 13
       Overweight and Obesity ........................................................................................................ 13
       Tobacco Use .......................................................................................................................... 14
       Smoking During Pregnancy .................................................................................................. 16
   Health Outcomes ....................................................................................................................... 17
       Life Expectancy ..................................................................................................................... 17
       Infant Mortality ..................................................................................................................... 17
       Adult Mortality ...................................................................................................................... 18
       Cancer.................................................................................................................................... 19
       Cardiovascular Diseases ........................................................................................................ 20
       Asthma................................................................................................................................... 21
       Diabetes ................................................................................................................................. 21
       Teen Pregnancy ..................................................................................................................... 22
       Sexually Transmitted Infections (STI) .................................................................................. 23
       HIV ........................................................................................................................................ 24
       Hepatitis C ............................................................................................................................. 26
       Drug Overdose ...................................................................................................................... 26
Health Equity Moving Forward..................................................................................................... 28

                                                                          i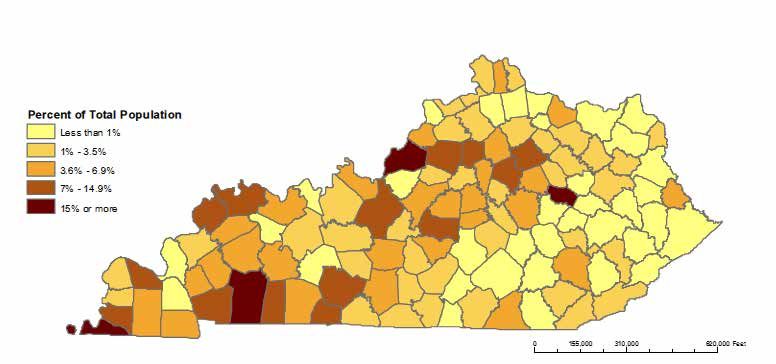
Recommendations ......................................................................................................................... 28
Conclusion ..................................................................................................................................... 29
Strengths and Limitations .............................................................................................................. 29
Appendix ....................................................................................................................................... 31

                                                                        ii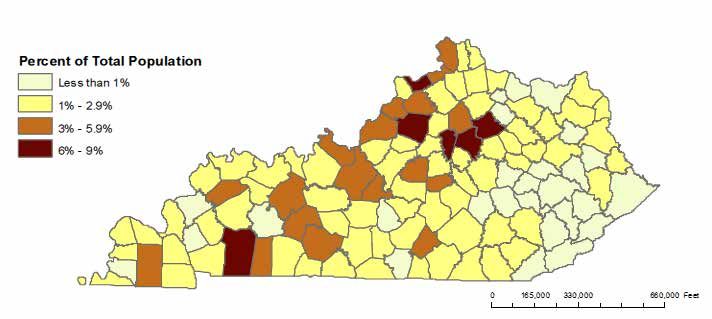
Executive Summary
Key Findings from the 2017 Kentucky Minority Health Status Report
Demographics
Racial and ethnic minority groups in Kentucky are younger than their White counterparts.
Black residents make up more than 15% of the populations of Jefferson, Christian, and
Fulton counties.
Counties with the highest Hispanic populations are Fayette, Bourbon, Christian, Jessamine,
Shelby, and Carroll counties.
Attainment of a Bachelor’s degree or higher is highest among Asians, while Blacks and
Hispanics have the lowest college graduation rates.
Asian households in Kentucky have the highest median income at $61,215, while Blacks
have the lowest at $30,418.
Hispanics and Blacks have higher unemployment rates when compared to Whites.
Black and Hispanic residents are more likely to be renters in the state, while their White
counterparts are more likely to own a home.
Health Risk Factors
In fiscal year 2015, only 18.5% of Medicaid-enrolled women ages 40-64 received
screening mammograms.
Hispanic women in the state are less likely to receive a Pap test than White women, a
downward trend from 2014.
Hispanics had the lowest colonoscopy screening rate compared to Blacks and Whites
between 2014 and 2016.
Among those in 2016 with 14 or more mentally unhealthy days in the past month,
Hispanics had the highest rate at 19.7%, with Blacks having the second highest rate at
16.2%.
Kentucky has the lowest percentage of persons with intellectual and developmental
disabilities (IDD) who exercise regularly at 45%, versus 77% nationally.
Persons with IDD in Kentucky also have a higher rate of obesity than the national average
(42% versus 34%)
Black Kentuckians visit the dentist or dental clinic consistently less often than their
Hispanic and White counterparts.
Blacks have the highest rate of obesity when compared to Hispanics and Whites.
White high school adolescents in the state are much more likely to smoke cigarettes than
their Black counterparts.
Health Outcomes in Kentucky
Black men have the shortest life expectancy of all groups when stratified by race and
gender.
Black infants continue to be nearly twice as likely to die in the first year of life as White
infants.
Blacks have a higher mortality rate for cerebrovascular disease than Whites.
Blacks have a significantly higher cancer mortality rate than Whites for prostate, breast
and colorectal cancer.
Blacks are more likely to die from asthma than any other racial or ethnic group.
The age-adjusted mortality rate for diabetes is greater for Blacks than Whites.
The overall teen pregnancy rate in Kentucky remains above the national average, and
Hispanics have the highest rate among racial and ethnic groups in Kentucky.
Blacks have higher rates of gonorrhea and syphilis when compared to Hispanics and
Whites.
Blacks have higher rates of HIV when compared to Hispanics and Whites.
White residents die of drug overdoses in Kentucky at the highest rate compared to other
racial and ethnic groups.
iii
Introduction
Historical Context
The Office of Health Equity (OHE) was established in September of 2008 through funding from
the United States Department of Health and Human Services (DHHS), Office of Minority Health.
OHE continues to work to address health disparities among racial and ethnic minorities, low-income,
and geographically isolated populations in the commonwealth by focusing on the following goals:
Increasing awareness of the significance and impact of health disparities in Kentucky;
Educating stakeholders on the actions necessary to improve the health outcomes for racial
and ethnic minorities, rural, and low-income populations in Kentucky;
Improving the health and healthcare outcomes for racial and ethnic minorities, and
underserved communities through evidence-based tailored approaches that account for
differences in culture and language;
Improving the coordination and utilization of research and evaluation outcomes to
advance health equity for racial and ethnic minorities and underserved communities; and
Strengthening partnerships by increasing the capacity of leadership in Kentucky to address
health disparities at all levels.
DPH strives to understand the relationship between health services, socioeconomic status,
environment, literacy levels, legislative policies, and their impact on the health outcomes of
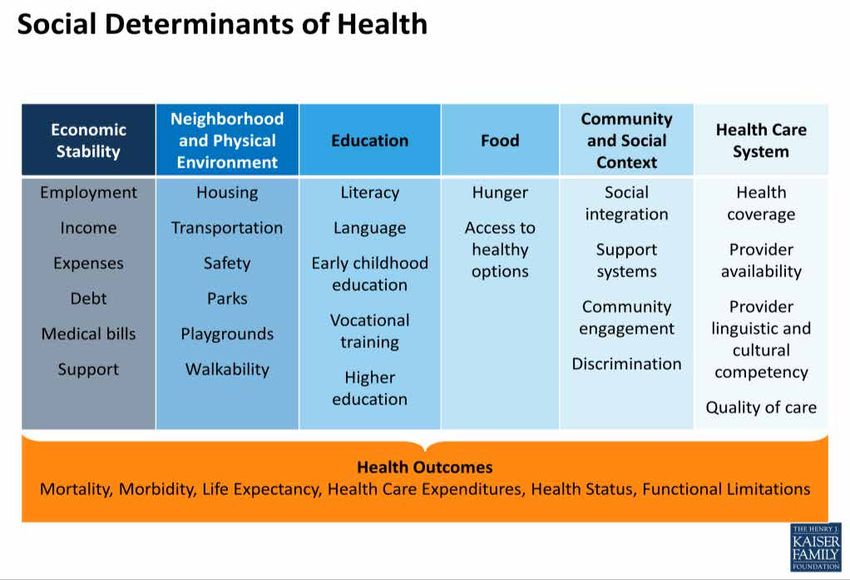
Kentuckians. Research describes these root causes as the social determinants of health (SDOH), and
demonstrates their association to adverse health outcomes (Figure1). Achieving health equity will
require addressing these SDOH through both population-based and targeted methods focusing on the
areas with the greatest need to improve the commonwealth’s overall health. By advancing the
understanding of the root causes of health disparities, and their role in perpetuating health inequities
at the community level, OHE promotes health equity for all marginalized and vulnerable
populations.
Figure 1: Social Determinants of Health1
ivWe work to create equity not just related to health and health care, but to educate communities about
access to high quality education, safe affordable housing, fair economic development, and other social
conditions as components of a heathy and productive community.
Healthy People 2020 provided recommendations for addressing disparities and defined a health
disparity as “a particular type of health difference that is closely linked with social, economic, and/or
environmental disadvantage.” 2 In addition, Healthy People 2020 defines health equity as the
“attainment of the highest level of health for all people,” and states that to achieve it, “…requires
valuing everyone equally with focused and ongoing societal efforts to address avoidable inequalities,
historical and contemporary injustices, and the elimination of health and healthcare disparities.”2
The 2017 Minority Health Status Report (MHSR) highlights the disparities affecting Kentuckians
and provides recommendations for improving health outcomes throughout the state. The MHSR is
produced biennially in odd-numbered years in compliance with the KRS 216.2929, Section 4.
The report provides the most current data describing disparities that exist in the commonwealth
through multiple data sources, including the Behavioral Risk Factor Surveillance System (KyBRFS),
the U.S. Census, the American Community Survey (ACS), and other sentinel surveillance systems.
Recognizing that disparities also exist geographically within the state, this report will primarily
highlight racial and ethnic disparities. The MHSR is a resource that can be used to engage
communities in understanding the social determinants of health and their relationship to health
disparities. This document provides data that support the focus areas of DPH’s 2017 State Health
Improvement Plan (SHIP) and the 2017 State Health Assessment (SHA) goals of advancing the
health and wellbeing of the citizens of Kentucky.
As the country moves forward in planning for Health People 2030, several foundational
principles will be used to guide the nation in eliminating health dispartities. The health and well
being of populations amd communities are essential in a fully funtioning and equitabe society.
Kentucky will model those guidelines in achieving health and wellbeing in efforts of eliminating
health disparities and achieving health equity.
vFull Report
Demographics
Race and Ethnicity
In 2016, the U.S. Census estimated the population in Kentucky to be 4,436,974 residents. The
majority of Kentucky’s population is White, but 15% of the population is comprised of minority
races and ethnicities.
Chart 1: Kentucky Population by Race and Ethnicity, 2016
Hispanic or Latino Asian
4% 1% Other
2%
Black or African
American
8%
White
85%
White Black or African American Hispanic or Latino Asian Other
Source: Kentucky State Data Center, U.S. Census Bureau, Population Estimates, 2016
Age by Race and Ethnicity
White residents comprise the majority of the population in Kentucky at 3,770,240 people with a
median age of 40.13 years. Eight percent of Kentucky’s total population are Black, an estimated
357,930 people, with a median age of 33 years.3 Hispanics comprise 4% of the Kentucky population
at an estimated 155,520 people with a median age of 24.5 years.3 Both Blacks and Hispanics have
younger median ages and smaller elderly populations compared to the White population. Among
all racial and ethnic groups, there are fewer elderly males compared to females. According to the
U.S. Census Bureau, the state’s population grew 2.2 % between 2010 and 2016.4
1Chart 2: Kentucky Population by Age and Gender: Whites, 2015
85+
65 - 74
Age 45 - 54
30 - 34
20 - 24
Female
10 - 14
Male
0-4
15 10 5 0 5 10 15
Population (in ten thousands)
Source: U.S. Census Bureau, Population Estimates, 2011 - 2015.
Chart 3: Kentucky Population by Age and Gender: Blacks, 2015
85+ Male
Female
65 - 74
45 - 54
30 - 34
Age
20 - 24
10 - 14
0-4
15 10 5 0 5 10 15
Population (in ten thousands)
Source: U.S. Census Bureau, Population Estimates, 2011 - 2015.
2Chart 4: Kentucky Population by Age and Gender: Hispanics, 2015
85+ Female
Male
65 - 74
45 - 54
30 - 34
Age
20 - 24
10 - 14
0-4
20 15 10 5 0 5 10 15 20
Population (in ten thousands)
Source: U.S. Census Bureau, Population Estimates, 2011 - 2015.
Race by Counties
Five-year estimates from the American Community Survey (ACS) indicate the majority of the
Black population in Kentucky resides in the Louisville area and the central, western and
southwestern regions of the state. Blacks make up more than 15% of the populations of Fulton,
Christian, and Jefferson counties.
ACS survey data noted that the Hispanic population of Kentucky is concentrated in the central and
western regions of the state. Counties with the highest percentage of Hispanics are: Fayette,
Bourbon, Christian, Jessamine, Shelby, and Carroll counties. The maps below are a valuable
resource in targeting culturally sensitive programs and projects for specific minority populations.
Figure 2: Percentage of non-Hispanic Black Population by County
2011 – 2015, 5-year Estimates
Source: 2011-2015 American Community Survey (U.S. Census Bureau)
3Figure 3: Percentage of Hispanic Population by County
2011 – 2015, 5-year Estimates
Source: 2011 – 2015 American Community Survey (U.S. Census Bureau)
Social Risk Factors
Education
Research has shown that of the socioeconomic status indicators, educational attainment has the
strongest influence on health decisions and outcomes. 5 A significant difference is seen among
racial/ethnic groups when looking at educational attainment.
In Kentucky, Asians have the highest percentage of those with a bachelor’s degree or higher when
compared to all other racial/ethnic groups. A less marked difference is seen among Whites, who
have the second highest percentage of college graduates among all other racial and ethnic minorities
in the state.
Chart 5: Percentage of Kentuckians over 25 Years Old who have a Bachelor’s Degree or
Higher, by Race, Ethnicity and Gender 2011 - 2015
AI/AN 17.0
19.3
Asian 61.3
49.5
Race/Ethnicity
Black 14.3
17.7
Hispanic 15.2
18.2
Male Female
White 22.0
23.0
0 10 20 30 40 50 60 70
Percentage
Source: U.S. Census Bureau, American Community Survey, 2011-2015, 5-year estimates. Notes: AI/AN: American Indian/Alaska
Native, Hispanic includes Latino
4Income, Poverty, and Unemployment
Research has also linked income and other socioeconomic indicators to health outcomes.5 In
Kentucky, Asians have the highest median household income at $61,215, while Blacks have the
lowest at $30,418.6
Poverty affects children at similar rates with the exception of the Asian population, but significant
disparities exist among residents 65 and older. Although poverty affects all age groups, children
and the elderly are the most vulnerable. Similarly, Hispanics and Blacks have higher unemployment
rates when compared to Whites.
Chart 6: Poverty Rates in Kentucky by Age Group and Race/Ethnicity, 2011-2015
60
50.2 Hispanic Black White AI/AN Asian
50 45.0 47.1
44.8
40 34.5
Percentage
31.8 31.5 29.4
30
22.7
18.8 17.1
20 15.5 15.8
10.6
10 7.4
0
< 5 y/o 65+ y/o All
Age
Source: U.S. Census Bureau, American Community Survey, 2011-2015, 5-year estimates. Notes: AI/AN: American Indian/Alaska
Native, Hispanic includes Latino
Chart 7: Unemployment Rate in Kentucky by Race and Ethnicity, 2016
White 4.8
Hispanic 7.9
Race/Ethnicity
Black 6.9
Total 4.9
0 1 2 3 4 5 6 7 8 9
Percentage
Source U.S. Bureau of Labor Statistics/Local Area Unemployment Statistics Information and Analysis, 2016
5Adverse Childhood Experiences
Adverse childhood experiences (ACEs) are traumatic childhood experiences of abuse, neglect, and
household dysfunction before the age of 18 that can impact one’s health and well-being across the
lifespan.7 A growing body of research has identified ACEs as major risk factors for many health
conditions, and poor children are more than twice as likely to have three or more ACEs which can
negatively impact developmental and health outcomes into adulthood.8
Kentucky Behavioral Risk Factor Surveillance System (KyBRFS) data suggest that as the number
of ACEs increase, so does the risk for poor physical and mental health outcomes when compared to
those with no ACEs.9 Sustainable improvements in public health require a shift in focus to include
the prevention of ACEs, resilience building, and the provision of trauma-informed services. The
Sustainable Development Goals developed by the United Nations provide global public health
prevention efforts to reduce ACEs and their life-course effect on health.10
Chart 8: Prevalence of Selected Health Risk Factors among Kentucky Adults aged 18 Years
and Older by ACE Score Group, 2015
40 37.0
35 33.1
30
24.7
25
Weighted %
20 17.6 18.1 16.8
16.3
14.1
15 11.3 10.3
9.9
10 8.2
5
0
Current Smoking Binge Drinking Asthma Depression
0 (No ACE) 1-2 (Low ACE) 3+ (High ACE)
Source: Kentucky Behavioral Risk Factor Surveillance System, 2015
Juvenile Justice
Studies of incarcerated youth have found ACEs prevalence (the total number of individuals in a
population who have a disease or health condition at a specific period in time) more than twice that
found in the general population.11 Juvenile justice involvement is also linked to higher risk for poor
social outcomes including unemployment, low educational attainment, and low wages. 12 The
disproportionate distribution of these social determinants of health in addition to ACEs make
justice-involved youth a disadvantaged population at significantly higher risk for poor health
outcomes when compared to youth not involved with the justice system.
Data from the Kentucky Department of Juvenile Justice show that Black youth disproportionately
enter the justice system through law enforcement and school referrals, and are less likely to receive
case diversion – instances where offenses are eligible for legal processing but are resolved without
filing formal charges. Disparities between Black and White individuals have increased since 2014.
Further examination revealed economic status, education, location, family structure, and bias
among those interacting with youth in the juvenile justice system are risk factors for
disproportionate minority contact.13
6Chart 9: Kentucky Department of Juvenile Justice, Annual Statewide Contact Rates by
Race and Ethnicity, 2015
120 White Black Hispanic Asian Native Other
107.8
100
80.2 76.5
80
Percentage
57.5 58.9
60 56.7
53.4
46.7
36.4 33.7 40.0
40
23.1 22.0
16.8
20 12.5 13.9
4.3 2.7 8.8 7.4
0.6
0
All referrals per 1,000 Law enforcement School-related referrals Cases diverted per 100
referrals per 1,000 per 1,000 referrals
Referral Group
Source: Jenkins, E., Kentucky Department of Juvenile Justice. Kentucky Updated Plan for Compliance with the Disproportionate
Minority Contact Core Requirement. Appendix 3. 2017
Home Ownership
Research has shown that homeownership, when compared to renting, has a positive impact on life
satisfaction as well as the cognitive and behavioral outcomes of children. 14,15 In Kentucky, all
minority groups are less likely to own homes compared to White residents. For example, over 60%
of Black and Hispanic residents in Kentucky rent their homes.
Chart 10: Home Ownership and Renter-Occupied Homes in Kentucky, by Race and
Ethnicity, 2011-2015
Owner Occupied Renter Occupied
120
100
80 29.0
48.3 46.3
Percentage
62.3 63.7
60
40 71.0
51.7 53.7
20 37.7 36.3
0
White Black or African Hispanic or Asian American
American Latino Indian and
Alaska Native
Race/Ethnicity
Source: U.S. Census Bureau, American Community Survey, 2011-2015, 5-year estimates.
Notes: AI/AN: American Indian/Alaska Native, Hispanic includes Latino.
7Health Insurance Status
Improving equity begins with improving access to health care services. This is impacted by
insurance status and cost. Research has shown that minorities and those with low socioeconomic
status are often uninsured more often than their counterparts. Uninsured rates in the U.S. have
decreased from 13.3% in 2013 to 8.8% in 2016 – an overall reduction of 4.6%.16 The U.S. Census
Bureau’s 2016 Health Insurance Coverage report stated that Kentucky was among the top states in
the nation for reductions in the uninsured rate, with a decrease from 14.3% in 2013 to 5.1% in
2016.16 Although we have made progress in ensuring coverage for all Kentuckians, 30.6% of
Hispanics are still without coverage.
Benefind, Kentucky’s online service for programs such as Medicaid, the Kentucky Children’s
Health Insurance Program (KCHIP), the Supplemental Nutrition Assistance Program (SNAP), food
benefits, the Kentucky Transitional Assistance Program (KTAP), or cash assistance continues to
work to ensure continued coverage for all persons of the commonwealth.
Chart 11: Kentucky Residents with No Health Insurance Coverage by Age, Race, and
Ethnicity, 2016
35 30.6
30
25
20
Percentage
15 10.4
7.8 8.3 9.0
10 6.2 7.0 6.1
3.2 2.4 3.0
5 0.1 0.9 0.2
0Health Risk Factors
Preventive Health Screenings
Preventive health services lower costs and improve health outcomes.17 According to the Centers
for Disease Control and Prevention (CDC) National Center for Health Statistics (NCHS), as of
2015 the age-adjusted rate of women 40 and over who had a mammogram in the previous two years
was 64%.18 Over the past several years the KyBRFS data, a self-report telephone surveillance
system designed to collect data on individual risk behaviors and preventive health practices, has
been used to describe Kentucky women’s mammography screening practices.
KyBRFS data indicated that Kentucky women, especially women of color, were receiving
mammograms at a higher rate than the national average. However, upon careful review of local
health department data reported to the CDC, DPH’s Women’s Cancer Screening Program
(KWCSP) determined that Medicaid claims data gave a more accurate and reliable screening rate
for Medicaid eligible women of screening age. In fiscal year 2015, 208,634 women ages 40-64
years were enrolled in the Medicaid program. Among these enrolled women, only 38,458 (18.5%)
women had screening mammograms. This Medicaid population presents an opportunity for focused
social and cultural messaging and outreach to navigate women who have not had a mammogram
in the recommended timeframe to screening services.
According to KyBRFS data, the rate of cervical cancer screening Pap tests for adult women has
increased among all minority groups with the exception of Hispanics, who showed a decline from
67.0% in 2014 to 58.1% in 2016. CDC data indicate that nationally in 2015, the age-adjusted rate
of women 18 and over who had a Pap test within the past 3 years was 70.2%.18
New guidelines from the United States Preventive Services Taskforce now recommend that routine
screenings begin at a later age (21 years of age), and provide an option for less frequent screenings
in combination with other testing.19 The decrease in the percentage of women receiving Pap tests
within the last three years may be a reflection of the institution of new standards of care in medical
practices throughout the state. It is possible that the impact of these revised Pap test screening and
follow up guidelines has resulted in an overall decline or decrease in the number of Pap tests
performed in Kentucky.
KyBRFS data indicate that in 2012, 67% of age appropriate Kentucky adults had a sigmoidoscopy
or colonoscopy. This percentage increased to 71% in 2014, and has remained unchanged at 71.7%
in 2016. This is due to several factors including Medicare coverage of screening colonoscopies for
beneficiaries at increased risk of colon cancer, mini-grants provided to communities to increase
screening, and legislation creating the Kentucky Colon Cancer Screening Program among other
events and initiatives. Although the rates of colon cancer screening by sigmoidoscopy or
colonoscopy increased for both White and Black residents from 2012, to 2016, the screening rate
among the Hispanic population decreased between 2014 and 2016. Blacks have the highest
screening rate among racial and ethnic groups, yet higher rates of colon cancer incidence and
mortality compared to White residents. Efforts to increase colorectal cancer screening rates for
earlier detection should include tailored approaches that address cultural, institutional, and access
barriers across geography, race/ethnicity, and gender.
9Figure 4: Screening Mammograms among Kentucky Medicaid Enrollee Women 40-64 years
of age, FY 2015 and 2016
Source: Maratha, Sivaram “Ram”. Kentucky Women’s Cancer Screening Program. July 1, 2017. Includes women enrolled in
Kentucky Medicaid between July 1, 2014 and June 30, 2016. Excludes dual eligibles, Medicaid waiver recipients, and those who had
less than 90 days of Medicaid coverage. Data are preliminary and subject to change.
Chart 13: Percentage of Kentucky Women over 18 Years Old, Who Have Had a Pap Test in
the Past Three Years, by Race and Ethnicity, 2012 – 2016
White Black Hispanic
100 90.5
90 84.0 82.6
80.5
80 76.5 75.6
69.0 67.0
70
58.1
Percentage
60
50
40
30
20
10
0
2012 2014 2016
Year
Source: Kentucky Behavioral Risk Factor Surveillance System, 2012-2016
10Chart 14: Percentage of Kentuckians over 50 Years Old, Who Have Ever Had a
Sigmoidoscopy or Colonoscopy, by Race and Ethnicity, 2012 - 2016
90
White Black Hispanic
80 76.2 76.0
70.0 70.0 67.5 72.0
70 66.4 64.8
63.4
Percentage 60
50
40
30
20
10
0
2012 2014 2016
Year
Source: Kentucky Behavioral Risk Factor Surveillance System, 2012-2016
Mental Health
In 2015, 17.9% of the adult population in the United States had a mental illness (a mental,
behavioral, or emotional disorder excluding developmental and substance use disorders) according
to the National Institutes of Health.20 Research has shown that mental health conditions exacerbate
the ability to cope with chronic illnesses, which make both the illness and the mental health
condition worse.21
In 2016, Kentuckians were asked to self-report the number of days in the past month their mental
health was not good, including days effected by stress, depression or problems with emotions.
Among those reporting 14 or more mentally unhealthy days in the past month, Hispanics had the
highest rate at 19.7% with Blacks having the second highest at 16.2%.
Chart 15: Percentage of Adults Mentally Unhealthy for 14 Days or More in Past Month by
Race and Ethnicity, 2016
25
White Black Hispanic
19.7
20
16.2
14.3
15
Percentage
10
5
0
White Black Hispanic
Race/Ethnicity
Source: Kentucky Behavioral Risk Factor Surveillance System, 2016
11Intellectual and Developmental Disabilities
Poor health outcomes in Kentucky are accentuated even more for individuals with intellectual and
developmental disabilities (IDD). Individuals with IDD are at an extreme disadvantage related to
health and wellness outcomes.
According to the National Core Indicators (NCI) Adult Consumer Survey (HSRI and NASDDS,
2017), Kentucky has the smallest percentage of individuals with IDD who exercise regularly of any
participating state (only 45% of Kentuckians with IDD compared to 77% in the national sample for
individuals with IDD). Persons with IDD also have a higher rate of obesity than the national average
(42% for Kentuckians with IDD compared to 34% nationally). The data below demonstrate the
need for inclusion in preventive screenings efforts for Kentuckians with IDD.
Chart 16: Preventive Screening Rates for Kentuckians with Intellectual and Developmental
Disabilities, 2015
Within past year Within past two years Within past three years Never
60 53
50
42
Percentage
40
30 27 27 25
20 22
20 13
9
10 5 4 2
0
Colorectal Screening PAP Test for Women 18 Mammogran for Women
and Older Over 40
Source: CDC Disability and Health Data System: Kentucky Data (2015)
Chart 17: National Core Indicator Data for Kentuckians with Intellectual and
Developmental Disabilities, 2016
Kentuckians with IDD National Sample for Individuals with IDD
90
77
80
Percentage
70 60
60 53
50 45 42 45 42 41
40 34 34
27
30 21
20
10
0
Exercise Obesity Rate Dentist Visit Colorectal Pap Test Mammogram
Regularly within Past Screening within past
Year year
Source: Disability impacts ALL of US. Atlanta, GA: Author Human Services Research Institute and National Association of State
Directors of Developmental Disabilities Services (2017). Adult consumer survey 2015-2016: Final report. Cambridge MA: Human
Services Research Institute.
12Oral Health
Poor oral health can be a major risk factor for cardiovascular disease and stroke.22 In 2014 and
2016, more than 30% of Kentucky adults did not see a dentist during the past year. This finding is
comparable to national data, which show that 64% of Americans between 18 and 64 and 62.7% of
Americans 65 and older saw a dentist in the past year.18 The KyBRFS data indicate that Blacks visit
the dentist or dental clinic at consistently lower rates than their Hispanic and White counterparts.
Chart 18: Percentage of Adult Kentuckians Who Visited the Dentist or Dental Clinic within
the Past Year for Any Reason, by Race and Ethnicity, 2012 - 2016
White Black Hispanic
80
70 66.4 65.4 66.7
61.2 61.6 62.3
55.9 58.2
60 53.0
Percentage
50
40
30
20
10
0
2012 2014 2016
Year
Source: Kentucky Behavioral Risk Factor Surveillance System, 2012-2016
Overweight and Obesity
Overweight and obesity are not just risk factors, but are classified as chronic diseases as well.23
Middle-aged adults and minorities are at highest risk. Overweight and obesity are defined by a
person’s body mass index (BMI); a BMI of 25.0 – 25.9 is considered overweight and a BMI greater
than 30 is considered obese.
According to the CDC, over one-third of U.S. adults are obese, which increases the risk of heart
disease, stroke, Type II Diabetes and cancer. 24 The annual cost of obesity is estimated to be
between $147 and $210 billion.25 About a third of adult Kentuckians are considered overweight
and another third are obese, percentages which did not change much from 2011 to 2016. Hispanics
are less likely to be obese whereas Blacks have the highest rates of combined overweight and
obesity.
13Chart 19: Overweight and Obesity Prevalence among Adults in Kentucky, by Race and
Ethnicity, 2011-2016
Overweight
White Black Hispanic
45 40.7
37.1 37.2
40
35.9 35.5 33.0 35.0
35 36.6
34.9 33.2
30 32.8 33.4 32.0 32.6 32.6
Percentage
25 26.7 29.4
20 22.1
15
10
5
0
2011 2012 2013 2014 2015 2016
Year
Obesity
White Black Hispanic
50 43.2 42.6 44.3
42.0 40.9
40.2
40 34.5
29.5 30.6 32.8 31.3
34.2
30
Percentage
30.2
29.2
20 25.8
22.2 22.2
10 18.4
0
2011 2012 2013 2014 2015 2016
Year
Source: Kentucky Behavioral Risk Factor Surveillance System, 2011-2016
Tobacco Use
Smoking is the leading cause of preventable deaths in the United States, leading to lung cancer and
other cancers, heart disease, stroke and respiratory diseases.26 In 2015, Kentucky had the highest
rates of tobacco use at 26% while the U.S. average was 15.1%.27Smoking rates in high school
adolescents have shown a downward trend from 26% in 2007 to 14.3% in 2017.28 The same is true
for cigarette use among middle school students and the use of electronic vapor products among
both middle and high school students. White high school adolescents are much more likely to
smoke cigarettes than their Black counterparts, but this trend does not continue into adulthood.
Though Blacks initiate smoking at a later age than Whites, adult smoking rates are similar to or
higher than that of White Kentuckians.
The significant increase in smoking rates between adolescence and adulthood has been linked to
aggressive marketing and the absence of protective factors such as parental opposition and sports
participation present during adolescence.29 Hispanic high school students have seen a significant
reduction in smoking rates from 32.1% in 2007, to a prevalence of 25.6% in 2015, and a dramatic
decrease to 12.4% in 2017.30 However, the Youth Behavioral Risk Factor Survey (YRBS) data for
Hispanics was not available for 2009 – 2013. Tobacco use among disadvantaged populations is
influenced by multiple factors such as such as socioeconomic status, mental and behavioral health
issues, toxic stress, predatory marketing, and the capacity of communities to mount effective
tobacco control initiatives.31 Tobacco efforts must address these factors in culturally appropriate
14ways in order to maintain progress among all racial and ethnic groups and reduce disparities.
Chart 22: Percentage of Adult Current Smokers in Kentucky, by Race and Ethnicity,
2011-2016
White Black Hispanic
40
35 33.8
31.5
30 28.5 28.2 29.1
27.9 26.9 26.5 26.6 26.5
25.5 25.8
25 23.7 23.8 24.3
Percentage
22.4
19.9 20.0
20
15
10
5
0
2011 2012 2013 2014 2015 2016
Year
Source: Kentucky Behavioral Risk Factor Surveillance System, 2011-2016
Chart 20: Prevalence of Current Cigarette Use among High School Adolescents in
Kentucky, by Race and Ethnicity, 2007-2017
White Black
30 27.0 27.1
25.1
25
18.9
20 17.2 17.0
14.4 14.4 15.1
Percentage
15 11.9
10.6
10 6.3
5
0
2007 2009 2011 2013 2015 2017
Year
Source: Youth Risk Behavioral Surveillance System, 2007-2017 Note: Data for the Hispanic population is not available for all years.
15Smoking During Pregnancy
According to birth certificate data, 8.4%32 of women in the United States smoked during pregnancy
in 2014, down from 12.3% in 2010.33 The self-reported prevalence of smoking during pregnancy
is lower among minorities in Kentucky than for White Kentuckians. Smoking during pregnancy
can result in tissue damage in unborn babies, low birth weight, miscarriage, and stillbirth. Smoking
can also cause difficulty in becoming pregnant.34 Kentucky was recently awarded funding by the
CDC to participate in the national Pregnancy Risk Assessment Monitoring System (PRAMS).
PRAMS is a population-based survey designed to examine maternal behaviors and experiences
before, during and after a woman’s pregnancy, and during the early infancy of her child. PRAMS
supplements data collected from birth certificates for planning and assessing perinatal health
programs on a state level. These findings can be used to develop and assess public health programs
and policies to improve maternal and infant health. Data collection began in 2017 and will be
available in 2018.
Chart 23: Percentage of Resident Live Births to Mothers Smoking During Pregnancy, by
Race and Ethnicity in Kentucky 2012-2015*
30 White Black Hispanic
24.2 23.5
25 22.6
21.4
20
16.0
Percentage
14.5 14.3
15 13.1
10
4.6 4.4 4.6
3.6
5
0
2012 2013 2014 2015
Year
Source: Kentucky Vital Statistics, Kentucky Live Birth Certificate Files 2012-2015
*Birth data from 2012-2015 are preliminary. The percentage was calculated based on live births to mothers smoking during any
trimester of pregnancy. Hispanic origin and race not mutually exclusive. People of Hispanic origin may fall into any of the race
categories. Resident data includes events which occurred to the residents of the specified geographic area, regardless of place of
occurrence.
16Health Outcomes
Life Expectancy
While White females in Kentucky have historically had the highest life expectancy, in 2013 Black
women also reached a life expectancy of 78 years. Black men have consistently had the lowest life
expectancy of all groups when stratified by race and gender. With the exception of White males,
life expectancy has decreased for all groups since 2015. The health disparities that exist among
minority groups correlate with life expectancy. Social indicators such as housing, education,
income, discrimination, racism, and stress, all contribute to premature death.35
Chart 24: Life Expectancy in Kentucky by Race and Gender, 2009-2016
80.0
78.0
76.0
74.0 White Females
Age in Years
Black Females
72.0
White Males
70.0 Black Males
68.0
66.0
2009 2010 2011 2012 2013 2014 2015 2016
Year
Source: Kentucky Vital Statistics, Death Certificate Files 2009-2016. Analysis by the Kentucky State Data Center, 2017
Infant Mortality
Throughout the world, infant mortality is a primary benchmark used to measure a population’s
social, economic, and health-related wellbeing. According to the National Center for Health
Statistics (NCHS), the rate of infant mortality in the United States decreased 29% from 2005 to
2014.36 However, Kentucky’s infant mortality rate for both White and Black populations continue
to be above the national rate of 5.9 per 1,000 live births.37
Furthermore, Black infants continue to be nearly twice as likely to die as White infants. The primary
component of racial disparities in Kentucky childhood deaths is infant mortality. 38 This
disproportionate burden reveals the need for prevention efforts targeted towards mothers before,
during, and after pregnancy to reduce deaths among Kentucky’s Black infant population.
17Chart 25: Infant Mortality Rates per 1,000 Live Births by Year, and by Race and Ethnicity
in Kentucky, 2012-2015*
16 14.3
13.9
14
12.2
12 10.4
Rate per 1,000 9.0
10
7.9
7.2 7.3
8
6 6.7 6.7 6.6
6.0
4
2
White Black Hispanic
0
2012 2013 2014 2015
Year
Source: Kentucky Vital Statistics, Death Certificate and Birth Certificate Files 2012-2015
Note: *2013-2015 data are preliminary and may change.
Adult Mortality
From 1999-2015, the national age-adjusted mortality rate for both White and Black populations
declined significantly. During the same period, Blacks experienced a sharper decrease reducing the
Black-White disparity mortality rates from 33% to 16%. However, Blacks under sixty-five had
higher levels of risk behaviors, chronic conditions, and mortality for conditions most common in
those sixty-five and older.39 In Kentucky, the leading causes of death are cancer, heart disease,
chronic respiratory diseases, injuries, and strokes.
The demographic data highlighted earlier in the report noted the Hispanic population in Kentucky
as significantly younger than the White population. Since the overall leading causes of death for
the commonwealth primarily reflect diseases more commonly found in older individuals, rates
among the Hispanic population are significantly lower than that of the Black and White
populations. When stratified by race and ethnicity the mortality rates among Kentucky’s Black
population are consistent with or lower than the rates among White residents, with the exception
of mortality rates for cerebrovascular disease, which are higher among Blacks.
As the proportion of the Black population 65 and older increases and parallels the White population,
the prevalence of causes of death associated with older age among this population will increase.
Since mortality rates for many chronic illnesses increase with age, factors such as late stage
diagnoses, obesity, and hypertension combined with SDOH risk factors such as low income, low
educational attainment, poor quality housing, and poor transportation access could result in the
development of further disparities between Black and White Kentuckians as the Black population
ages. It is critical that Kentucky make a concerted effort to address not only behavioral risk factors
among these populations such as obesity and tobacco use, but also the root causes of poor health
outcomes: the built environment, healthcare access, unemployment, education, poverty, and access
to healthy, affordable foods.39
18Chart 26: Leading Causes of Death in Kentucky, Age-Adjusted Rates per 100,000 by Race
and Ethnicity, 2015*
250
White Black Hispanic
195.7 197.1 197.4 193.8
200
Rates per 100,000
150
100
71.1 65.4 67.3
53.1 47.0
45.8 43.6
50 40.0
21.0 25.9 17.2
0
Cancer Heart Disease Chronic Lower Accidents Cerebrovascular
Respiratory (Unintentional Diseases
Injuries)
Cause of Death
*Mortality data from 2015 are preliminary AAR: Age-adjusted rates are per 100,000 U.S. standard 2000 population. Resident data
include events which occurred to the residents of the specified geographic area, regardless of place of occurrence. Hispanic Origin
and Race are not mutually exclusive. People of Hispanic Origin may fall into any of the race categories.
Cancer
Although cancer incidence and mortality rates are trending downward in the commonwealth,
Kentucky still leads the nation in both categories.40,41 The incidence rate among Black Kentuckians
in all cancer sites is lower than rates among the Kentucky and White populations, however Black
residents have a significantly higher cancer mortality rate than both Whites and Kentuckians overall
in prostate, breast and colorectal cancer. This may be due to lower diagnostic screening rates, later
diagnosis and disparities in cancer treatment.
Research has also shown that historical and contemporary social inequities at multiple levels across
the lifespan influence exposure to cancer risk factors, and that relationships with systems are critical
to ensuring positive cancer outcomes. Identified barriers such as fears related to the cost of cancer
screening, diagnostic exams, and treatment, even among the insured, may prevent individuals from
receiving life-saving diagnostics and treatment. Identifying the disease at a later stage, time to
treatment and/or refusal of treatment all impact prognoses. Additionally, differences in mortality
rates have been linked to provider bias and social determinants of health such as access to
healthcare, poverty, income, and education.
Table 1: Invasive Cancer Incidence and Mortality Rates in Kentucky, by Race, 2011-2015
Incidence Rates Mortality Rates
Cancer Sites KY Black White KY Black White
All sites 521.1 512.2 520.6 200.3 214.0 199.8
Prostate 113.0 165.2 105.6 19.7 36.7 18.9
Breast 66.2 70.0 66.1 12.2 16.2 11.8
Lung & Bronchus 95.3 84.5 96.0 69.3 67.8 69.7
Colorectal 50.0 55.2 49.7 17.1 20.2 16.9
Source: KY Cancer Registry http://cancer-rates.info/ky/index.php. Note: All rates are per 100,000. Rates are age-adjusted to the 2000
U.S. Standard Million Population
19Cardiovascular Diseases
Cardiovascular disease death rates in Kentucky have consistently declined over the last twenty
years. In addition, the disparity gap between Kentucky Black and White residents has become
almost non-existent. The Kentucky age-adjusted death rate for Blacks mirror the national rate,
while the age-adjusted death rate for White Kentuckians is higher than the rate for Whites
nationally.
While the same declining trend for cerebrovascular disease can be seen nationally for Blacks and
Whites, the age-adjusted death rate for Blacks in Kentucky is higher than that of White
Kentuckians. Though cardiovascular disease death rates continue to decline, this trend may not
remain stable over time especially for certain demographics. Factors such as continued tobacco use,
hypertension, diabetes, and obesity increase the risk of cardiovascular disease.42 Stroke risk factors
are similar to those of cardiovascular disease, however sickle cell disease increases the risk of
ischemic stroke.43
Chart 27: Age-Adjusted Death Rates for Major Cardiovascular Diseases by Race for KY
and U.S., 1999 – 2015 with 95% Confidence Intervals
450
KY - Black or African American
400 KY - White
US - Black or African American
Age-Adjusted Rate (per 100,000)
350 US - White
300
250
200
150
100 Data Source: Centers for Disease Control and Prevention, National Center for Health Statistics.
Compressed Mortality File 1999-2015 on CDC WONDER Online Database, released December 2016. Data
50 are from the Compressed Mortality File 1999-2015 Series 20 No. 2U, 2016, as compiled from data provided
by the 57 vital statistics jurisdictions through the Vital Statistics Cooperative Program.
0
1999 2000 2001 2002 2003 2004 2005 2006 2007 2008 2009 2010 2011 2012 2013 2014 2015
Year
Chart 28: Age Adjusted Death Rates for Cerebrovascular Diseases by Race for KY and
U.S., 1999 – 2015 with 95% Confidence Intervals
KY - Black or African American
120
KY - White
US - Black or African American
Age-Adjusted Rate (per 100,000)
100 US - White
80
60
40
Data Source: Centers for Disease Control and Prevention, National Center for Health Statistics. Compressed
20 Mortality File 1999-2015 on CDC WONDER Online Database, released December 2016. Data are from the
Compressed Mortality File 1999-2015 Series 20 No. 2U, 2016, as compiled from data provided by the 57 vital
statistics jurisdictions through the Vital Statistics Cooperative Program.
0
1999 2000 2001 2002 2003 2004 2005 2006 2007 2008 2009 2010 2011 2012 2013 2014 2015
Year
20Asthma
While women die from asthma at a higher rate than men, Blacks are more likely to die from asthma
than any other racial or ethnic group.44 Kentucky’s adult asthma prevalence rate was 11.7% in 2016,
higher than the national rate of 7.6%. 45 Asthma prevalence among the Black population in
Kentucky is comparable to or slightly higher than that of the White population.
According to data mapped by EnviroHealthLink, Kentucky’s Environmental Public Health
Tracking Network, the highest rates of asthma emergency department visits from 2012-2016 were
found in the Kentucky River, Cumberland Valley, Western, and Central parts of the state, as well
as in Boyd, Jefferson, Monroe, and Fulton counties.
Though the cause of asthma is not fully understood, common triggers are tobacco smoke (including
secondhand smoke), mold, outdoor air pollution, and insect droppings.46 These triggers are more
common in low-income neighborhoods and households, and low-income communities with low
rates of home ownership often face more barriers to reducing asthma triggers than those who own
their own homes. Home visiting programs that focus on reducing triggers in the home have been
shown to be an effective and feasible asthma management strategy.47
Chart 29: Adult Asthma Prevalence in Kentucky, by Race and Ethnicity, 2011-2016
16
14.3 White Black
14 12.9 12.8 13.0
11.9 11.8
12 11.3 11.4
10.3 10.6
10 9.4 9.1
Percentage
8
6
4
2
0
2011 2012 2013 2014 2015 2016
Year
Source: Kentucky Behavioral Risk Factor Surveillance System, 2011-2016
Diabetes
In Kentucky, the prevalence of adult diabetes increased from 10.4% in 2011 to 13.1% in 2016.
According to the KyBRFS, Blacks have slightly higher rates when compared to Whites for the
years surveyed. Though there is not a significant disparity in the prevalence of Type II Diabetes,
there are significant disparities in mortality rates.
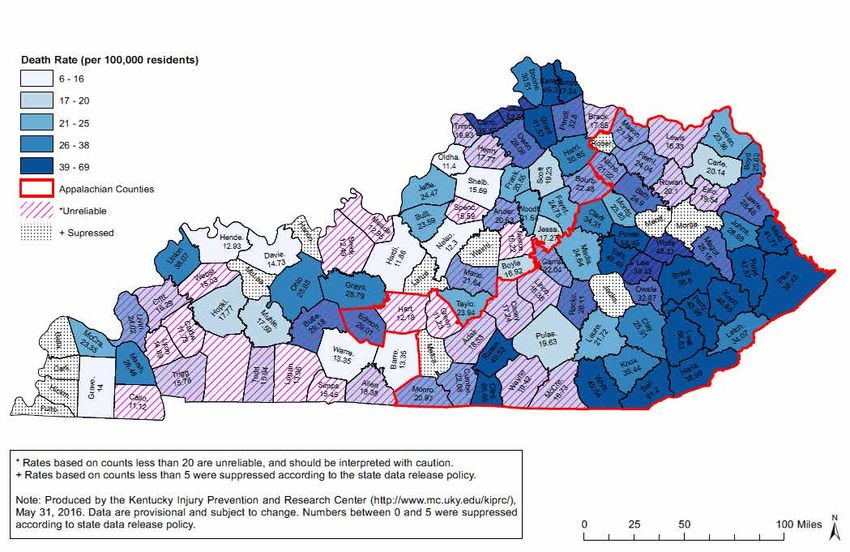
According to the 2017 Kentucky Diabetes Report, the age-adjusted mortality rate for Black men in
Kentucky is 1.4 times greater than for White men in Kentucky (39.6 per 100,000 versus 27.7 per
100,000), and the mortality rate for Black women in Kentucky is 35.4 per 100,000 compared to
19.0 per 100,000 for White women.48 These disparities suggest differences in access to prevention
services and treatment, and educational resources needed to successfully manage this chronic
condition. Individuals with Type II Diabetes are more likely to also suffer from oral health diseases,
stroke, hypertension, chronic kidney disease, and cancer.49,50
21Chart 30: Adult Diabetes Prevalence in Kentucky, by Race and Ethnicity, 2011-2016
White Black
18 15.9 15.6
16 14.5 14.5
12.9 13.5 13.3
14 12.5
12 10.4 10.6 11.0
Percentage 10.2
10
8
6
4
2
0
2011 2012 2013 2014 2015 2016
Year
Source: Kentucky Behavioral Risk Factor Surveillance System, 2011-2016
Chart 31: Age-Adjusted Death Rates for Diabetes (All Ages) By Race and Gender for KY
and U.S., 2014
White Males Black Males White Females Black Females
45 42.7
39.6
Age-Adjusted Rate (per 100,000)
40
35.4
35 33.1
30 27.7
24.1
25
19.0
20
15.3
15
10
5
0
Kentucky U.S.
Source: The 2017 Kentucky Diabetes Report
Teen Pregnancy
The national teen birth rate hit a record low in 2015, at 22.3 births for every 1,000 women ages 15-
19.38 The same trend is reflected in Kentucky data. The teen pregnancy rate is the lowest ever
recorded for Kentucky declining 44% from 2008 to 2015. However, the rate in the commonwealth
remains well above the national average at 31.4 per 1,000 in 2015, causing Kentucky to have the
6th highest teen birth rate in the country.51
Substantial disparities persist in teen birth rates and teen pregnancy in the commonwealth. The
highest rate of teen pregnancy among racial and ethnic groups is in the Hispanic population. Similar
rates are seen in Appalachian counties of the state where the 2015 teen birth rate was 42.8 per 1,000
births. Childbearing continues to carry significant social and economic costs. Efforts to build upon
successes and reduce disparities should focus on community assets, enhancing the resilience of teen
parents, and improving the integration of the SDOH for distressed communities.
22Chart 31: Resident Teen Pregnancy Rates (15-19 Years) in Kentucky by Race and
Ethnicity, 2011-2015*
60 White Black Hispanic
51.4
50 48.3
41.0 39.9 41.5
Rate per 1,000 40 3…
33.2 30.1
38.0 36.4
30 32.6
29.5
20
10
0
2012 2013 2014 2015
Year
*Birth data from 2011-2015. Rates are per 1,000 population. Hispanic Origin and Race are not mutually exclusive. People of
Hispanic Origin may fall into any of the race categories. Resident data include events which occurred to the residents of the specified
geographic area, regardless of place of occurrence.
Sexually Transmitted Infections (STI)
In Kentucky, Blacks have higher rates of primary and secondary syphilis and gonorrhea than
Hispanics and Whites. The disparities in both syphilis and gonorrhea are alarming. The highest rate
is seen in those who did not self-identify a race or ethnicity and are grouped as “Other” per reporting
guidelines. Gonorrhea is especially common among individuals ages 15-24, and facilitates the
transmission of HIV.52 Primary and secondary syphilis, the most common stages of the infection,
have reached national rates not seen in twenty years. Syphilis, when transmitted from mother to
child, causes complications and if left untreated can lead to chronic disabilities.53
Research has shown that racial disparities in STI rates are not due to race or ethnicity, but rather
social conditions that are more likely to affect minorities.54 STI rates can be higher in communities
where factors such as poverty, low access to and utilization of high quality healthcare services, low
educational attainment, and feelings of hopelessness are prevalent due to historical and
contemporary injustices. When persons with limited social networks reside in communities with
high STI rates, there is a greater likelihood that the overall prevalence will remain high and
disparities will persist.55 It is important to develop and support community resilience initiatives as
well as culturally tailored interventions that address the unique differences in social networks
between racial and ethnic groups to narrow the vast disparities in STI rates.
23You can also read