A SPATIAL ANALYSIS OF CHILD NUTRITION IN WEST AFRICA - RESAKSS WORKING PAPER NO. 23 - USAID
←
→
Page content transcription
If your browser does not render page correctly, please read the page content below
ReSAKSS Working Paper No. 23

              December 2008

A Spatial Analysis of Child Nutrition
           in West Africa

            Christopher Legg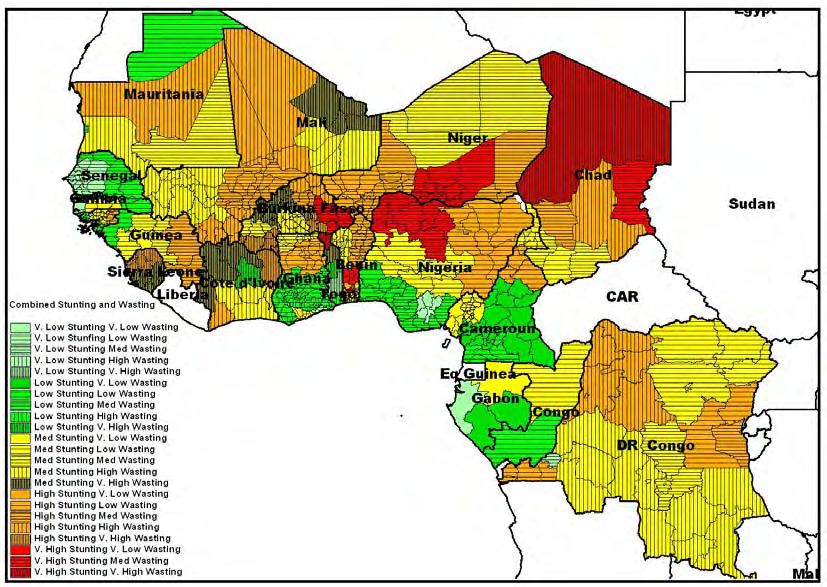
Regional Strategic Analysis and Knowledge
             Support System
                (ReSAKSS)

     ReSAKSS Working Paper No. 23

                December 2008

     A Spatial Analysis of Child Nutrition
                in West Africa

               Christopher Legg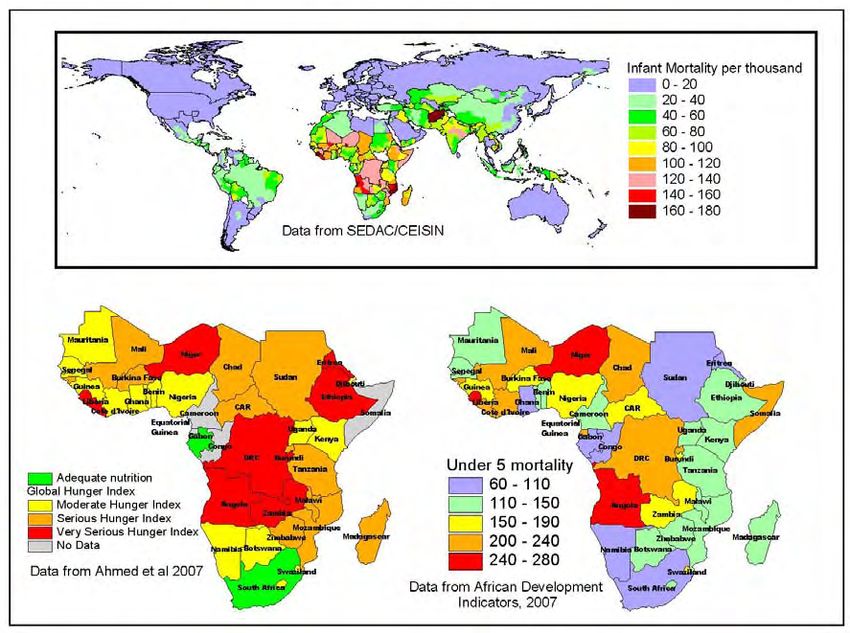
About ReSAKSS

The Regional Strategic Analysis and Knowledge Support System (ReSAKSS) is an Africa-wide
network of regional nodes supporting the Common Market of Eastern and Southern Africa
(COMESA), the Economic Community of West African States (ECOWAS), and the Southern
African Development Community (SADC), in collaboration with the International Food Policy
Research Institute (IFPRI) and the Africa-based centers of the Consultative Group on
International Agricultural Research (CGIAR), to facilitate the implementation of the AU/NEPAD
Comprehensive Africa Agriculture Development Program (CAADP) and other regional
agricultural development initiatives in Africa.

The ReSAKSS nodes offer high-quality analyses to improve policymaking, track progress,
document success, and derive lessons for the implementation of the CAADP agenda.
ReSAKSS is jointly funded by the United States Agency for International Development (USAID),
the UK Department for International Development (DFID), and the Swedish International
Development Cooperation Agency (SIDA). The nodes are implemented by the International
Crops Research Institute for the Semi-Arid Tropics (ICRISAT), the International Institute of
Tropical Agriculture (IITA), the International Livestock Research Institute (ILRI) and the
International Water Management Institute (IWMI), in collaboration with regional and national
partners.

About the Working Paper series

The goal of the ReSAKSS Working Paper series is to provide timely access to preliminary
research and data analysis results that relate directly to strengthening ongoing discussions and
critical commentaries on the future direction of African agriculture and rural development. The
series undergoes a standard peer review process involving at least one reviewer from within the
ReSAKSS network of partners and at least one external reviewer. It is expected that most of the
working papers eventually will be published in some other form and that their content may be
revised further.

For more information, contact:

Coordinator
Regional Strategic Analysis and Knowledge Support System-West Africa (ReSAKSS-WA)
Oyo Road, PMB 5320
Ibadan, Oyo State
Nigeria
Telephone: +234 (2) 241 2626
E-mail: resakss-wa@cgiar.org
www.wa.resakss.org

                                               ii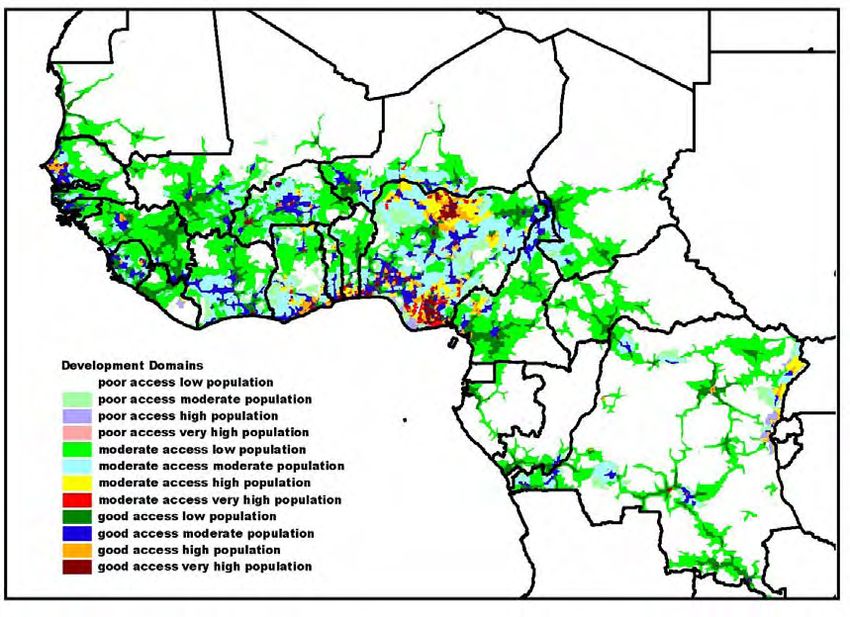
The author

Christopher Legg is a GIS Consultant to ReSAKSS-West Africa.

Legg, Christopher.2008. A Spatial Analysis of Child Nutrition in West Africa. ReSAKSS Working Paper
No. 23, ReSAKSS-West Africa.

                Except where otherwise noted, this work is licensed under a Creative Commons
                Attribution 3.0 License.

                                                  iii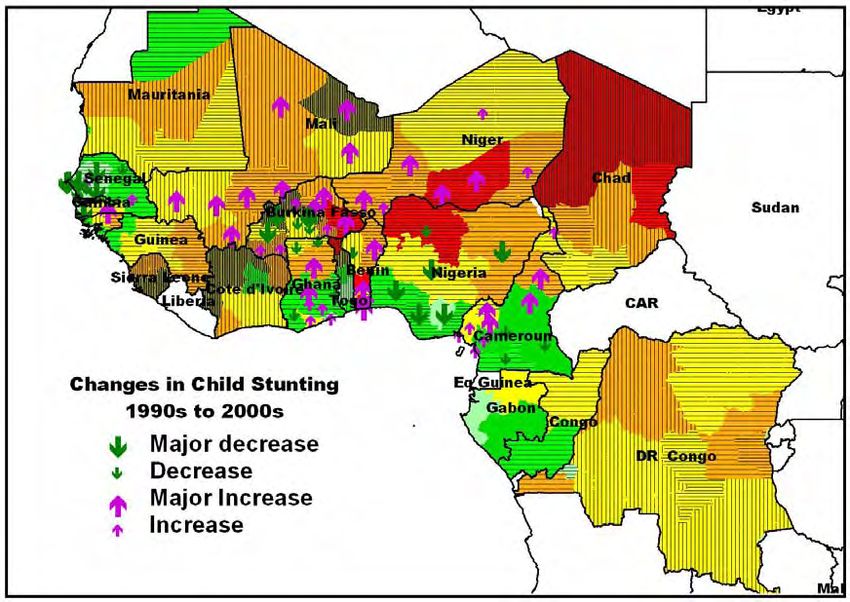
Table of Contents

Abstract ............................................................................................................................. 5
Introduction ....................................................................................................................... 6
Child Nutrition in Context .................................................................................................. 6
Data Sources for West and Central Africa ........................................................................ 8
   DHS Data ...................................................................................................................... 8
   MICS ............................................................................................................................. 9
   CIESIN ........................................................................................................................ 10
   Sub-National Agricultural Production Statistics ........................................................... 11
   Population Data........................................................................................................... 11
   Climate Data ............................................................................................................... 12
Comparison of DHS, MICS and CIESIN datasets........................................................... 13
Spatial Aspects of Child Nutrition .................................................................................... 15
Child Nutrition and Climate ............................................................................................. 21
Child Nutrition and Agricultural Production ..................................................................... 24
The Role of Livestock...................................................................................................... 31
Child Nutrition and Development Domains ..................................................................... 36
The Temporal Dimension of Child Nutrition in West Africa ............................................. 38
Suitability for Crop Diversification ................................................................................... 43
Conclusions and Recommendations............................................................................... 46
References ...................................................................................................................... 52

                                                                  iv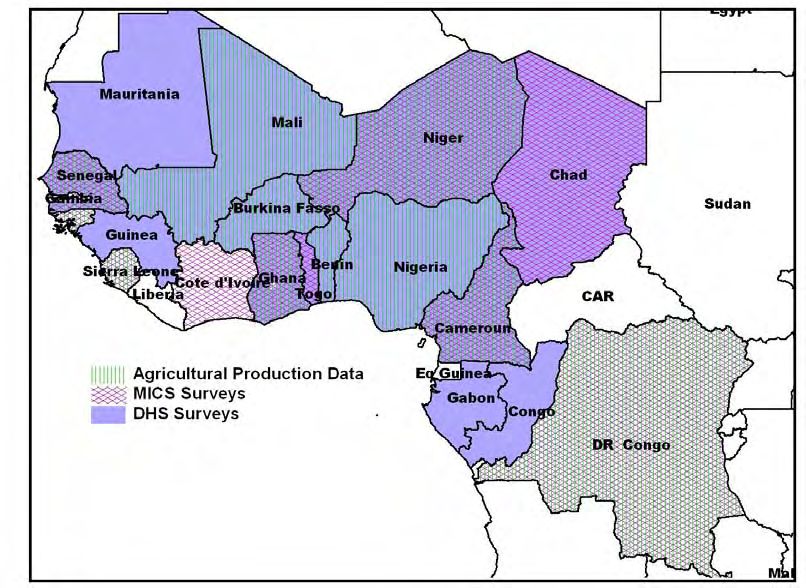
Abstract

Data on child nutrition in West and Central Africa from Measure DHS and Multiple
Indicator Cluster Surveys undertaken between 1992 and 2006 has been mapped and
analysed in relation to climatic zones, development domains and agricultural production.

Child malnutrition is most serious in the more arid parts of the region, where more
drought-tolerant crops such as millet, sorghum and maize are dominant. The more
humid areas, where root crops are dominant, show generally lower child malnutrition.
Population densities do not have a significant influence on malnutrition rates, although
actual numbers of malnourished children are highest in areas of very high population
density. Counter-intuitively, areas with best access to markets show higher incidence of
child malnutrition. High densities of cattle and small ruminants do not normally result in
improved child nutrition. The potential for improved nutrition and food security offered by
mixed livestock and cropping systems appears not to have yet been realized through
most of the region. Although there have been some local improvements in child nutrition
in the region since the early 1990’s, the overall situation is either near-static or declining.
Agricultural development directed at improved nutrition appears not to have been
effective.

More data is required in order to refine this study. DHS-type surveys need to be
undertaken at finer spatial resolution in some countries, especially Nigeria, where
population densities are very high. More detailed and timely agricultural production and
food consumption data is needed for many countries in order to better target agricultural
development efforts. Improved biophysical data on climatic requirements of improved
varieties of staple crops would help to identify areas where introduction of new varieties
might contribute to better nutrition.

                                               5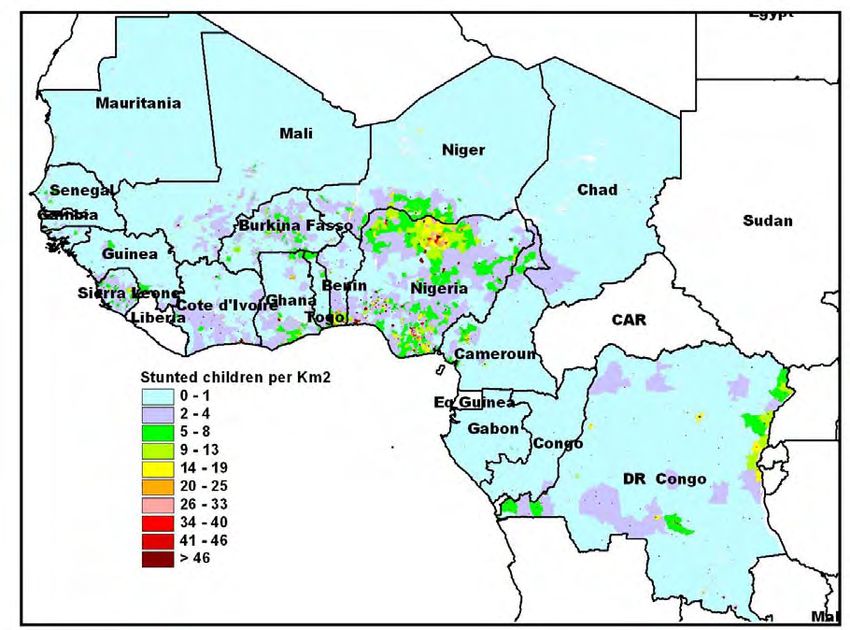
Introduction

One of the objectives of the Strategic Analysis and Knowledge Support System (SAKSS) is to
assist in targeting investment in agricultural research for development to those areas where it is
most needed and where impact will be highest. The nutritional status of children is a most
important indicator of the health of a community, and can predict the future health and vigor of
society. The methodology for conducting regular demographic and health surveys which use
sampling techniques to measure a wide range of indicators of mother, child and family health and
well-being is now highly developed, and Measure DHS and MICS surveys are now undertaken in
many countries of Africa at intervals of eight years or less. These surveys have become spatially
more detailed and are disaggregated to the 2nd administrative level (province or region) in most
countries, and even to the third level (district or state) in some countries. The West Africa node of
SAKSS (ReSAKSS-WA) is accumulating up to date disaggregated agricultural production data for
most countries in the region, and this permits an analysis of relationships between agricultural
production, farming systems and child nutrition. GIS analysis can also be carried out of the spatial
distribution of child malnutrition in relation to climatic zones and development domains in order to
highlight those areas where malnutrition is most prevalent, and where development assistance
can have greatest impact in alleviating malnutrition. This report presents results to date in this
ongoing study.

Child Nutrition in Context

Child malnutrition, more specifically under-nutrition, since malnutrition includes over-
nutrition which is predominantly a problem in more developed countries, and is also
growing amongst the urban elite of less-developed countries, is a global problem.
However, of the 40 countries with a child stunting prevalence of 40% or more, 23 are in
Africa, 16 in Asia, and one in Latin America (Black et al 2007). Figure 1 shows the global
distribution of infant mortality, usually a consequence of poverty and malnutrition, and
highlights the concentration in Africa. Ahmed et al (2007) comment “As it is, the ultra
poor are overwhelmingly concentrated in one region—Sub-Saharan Africa is home to
more than three-quarters of the world’s ultra poor. Sub-Saharan Africa is also the only
region in the world in which there are more ultra poor than medial or subjacent poor.” In
2004, 121 million Sub-Saharan Africans lived on less than a meager $0.50 a day.
Hunger is a challenge to human dignity and human rights. But hunger is also a threat to
security and stability, and to the ability of nations to prosper socially and economically.
Most deaths from hunger do not occur in high-profile emergencies but in unnoticed
crises, in areas and populations that are the most destitute and vulnerable. The poorest
and most marginalized people—the so-called bottom billion—cling to survival on less
than US$1 a day, often below the level at which development work can meaningfully
begin. Higher rates of child malnutrition and child mortality are found in poor households.
Poor families not only struggle to put a sufficient quantity of food on the table, but are
also prone to food insecurity with regard to the quality of their diets: even when dietary
energy requirements are met, their diets may lack essential micronutrients such as iron,
iodine, zinc, and vitamin A.
Because undernourished people are less productive and child malnutrition has severe
and permanent consequences for physical and intellectual development, poverty and
hunger can become entwined in a vicious cycle. Babies born to severely undernourished
and anemic mothers are at higher risk of being underweight and dying soon. If they
survive, they will never make up for the nutritional shortfalls at the very beginning of their
lives. Adults who were malnourished as children are less physically and intellectually
productive, have lower educational attainment and lifetime earnings, and are affected by
higher levels of chronic illness and disability. Poverty is a key factor affecting the
underlying determinants of household food security, caring capacity, and health
environments. Poor households and individuals are unable to achieve food security,
have inadequate resources for care, or cannot utilize resources for health on a
sustainable basis (Smith and Haddad 2000).

Despite a global trend of poverty shifting toward urban areas, the incidence of poverty is
still higher in rural areas. The poorest and most undernourished households are located
furthest from roads, markets, schools, and health services. In Sub-Saharan Africa,
overall progress in the 1990s was slow. The proportion of people who were food-energy
deficient decreased, but there was very little improvement in underweight in children and
in the under-five mortality rate.

While remarkable progress has been made in some regions (notably East Asia and the
Pacific), progress has been slow in regions where poverty and hunger are severe. As a
result, the first MDG goal (halving the proportion of people living on less than $1 per day
by 2015) seems far out of reach for most of Sub-Saharan Africa.

Table 1.Some Development and Nutrition Indicators in SAKSS regions in Sub-Saharan Africa.
          Low      Global    Safe                                                                    Malaria
          Birth    Hunger    water     Rural                     U5          Infant      HIV         deaths               U
          Weight   Index     access    Sanitation   Life         Mortality   mortality   infection   per       Stunting   Weight
 Region   %        2003      %         %            Expectancy   per 000     per 000     %           000       %          %
 WA-
 SAKSS    15       23.75     39        28           46.3         187         105         3.5         171       36.7       28.3
 SA-
 SAKSS    14       19.65     58        39           43.0         126         84          16.6        234       43.3       24.0
 EA-
 SAKSS    16       29.68     40        26           48.0         128         80          4.2         139       41.3       31.8
Data from World Bank, 2008, SCF 2007

Figure 1 shows that, although most indices of child nutrition are high throughout Sub-
Saharan Africa, there are considerable differences between countries. When indices are
re-calculated for the three SAKSS regions of Africa, weighted for population in each
country, the differences between the regions are not as great as between countries, as
shown in Table 1. The Southern Africa region (SA-SAKSS) shows higher levels of
physical development than the others, with higher percentages of people having access
to safe water and improved sanitation, although child stunting and malaria deaths are
higher and life expectancy lower, possibly as a result of significantly higher HIV infection.
Highest Global Hunger Index and incidence of underweight children is in the East
African region, while highest rates of under-5 and infant mortality are found in West and
Central Africa.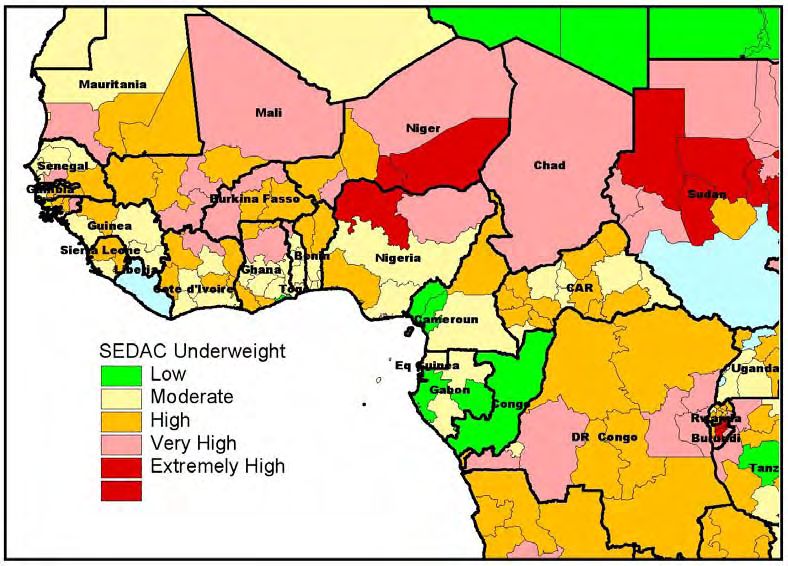
Figure 1. Global and Sub-Saharan African distribution of child health from various indicators.

Data Sources for West and Central Africa
DHS Data
Three indices of child nutrition are presented in the Measure DHS country reports (DHS,
1988; DHS, 1989; DHS, 1992,A,B; DHS, 1993; DHS, 1994, a, B, C; DHS, 1995; DHS,
1996; DHS, 1997; DHS, 1998; DHS, 1999, A, B, C; DHS, 2000, A, B, C, D; DHS, 2001,
A, B; DHS. 2002, A, B; DHS, 2004; DHS, 2005, A, B; DHS, 2006, A, B, C; DHS, 2007).
Each of these indices—height-for-age (TPA), weight-for-height (PPT), and weight-for-
age (PPA)—gives different information about growth and body composition used to
assess nutritional status. The height-for-age index is an indicator of linear growth
retardation. Children whose height-for-age Z-score is below minus two standard
deviations (-2 SD) from the median of the reference population are considered short for
their age (stunted) and are chronically malnourished. Children who are below minus
three standard deviations (-3 SD) from the median of the reference population are
considered severely stunted. Stunting reflects failure to receive adequate nutrition over a
long period of time and is also affected by recurrent and chronic illness. Height-for-age,
therefore, represents the long-term effect of malnutrition in a population and does not
vary according to recent dietary intake.

The weight-for-height index measures body mass in relation to body length and
describes current nutritional status. Children whose Z-scores are below minus two
standard deviations (-2 SD) from the median of the reference population are considered
thin (wasted) for their height and are acutely malnourished. Wasting represents the
failure to receive adequate nutrition in the period immediately preceding the survey and
may be the result of inadequate food intake or a recent episode of illness causing loss of
weight and the onset of malnutrition. Children whose weight-for-height is below minus
three standard deviations (-3 SD) from the median of the reference population are
considered severely wasted.

Weight-for-age is a composite index of height-for-age and weight-for-height. It takes into
account both acute and chronic malnutrition. Children whose weight-for-age is below
minus two standard deviations from the median of the reference population are classified
as underweight.

The DHS estimates of percentages of stunted, wasted and underweight children under
five years can be further classified for purposes of inter-country comparison. Table 2
presents a classification proposed by FAO.

Table 2. FAO classification of Child Malnutrition
Indicators           Low                  Moderate      High               Very High
Stunting             40%
Wasting              15%
Underweight          30%

The size of administrative unit on which DHS surveys are based varies widely from
country to country, but is normally the “Province” or equivalent unit, rather than the
“district”. This means that the total population in each unit varies between half a million
and four million across most of the region. Nigeria is anomalous in this respect. DHS
sampling in Nigeria was based on six “regions”, which are extremely large for the
population density, and thus have between 15 million and 30million people in each unit.
In order for the Nigeria DHS results to be comparable in terms of sampling levels and
representativity to the other countries in the region, the sampling units should have been
much smaller, possibly based on States rather than regions.

MICS
The Multiple Indicator Cluster Survey (MICS) is a household survey programme
developed by UNICEF to assist countries in filling data gaps for monitoring the situation
of children and women. Many of the data collected are essentially identical to Measure-
DHS, particularly the child nutrition indicators, and MICS is capable of producing
statistically sound, internationally comparable estimates of these indicators. MICS was
originally developed in response to the World Summit for Children to measure progress
towards an internationally agreed set of mid-decade goals. The first round of MICS was
conducted around 1995 in more than 60 countries. A second round of surveys was
conducted in 2000 (around 65 surveys), and resulted in an increasing wealth of data to
monitor the situation of children and women (MICS 2000, A, B, C, D and E). For the first
time it was possible to monitor trends in many indicators and set baselines for other
indicators. The current round of MICS is focused on providing a monitoring tool for the
World Fit for Children, the Millennium Development Goals (MDGs), as well as for other
major international commitments, such as the UNGASS on HIV/AIDS and the Abuja
targets for malaria. 21 of the 48 MDG indicators can be collected in the current round of
MICS.
CIESIN
The Center for International Earth Science Information Network (CIESIN) through its
Socio-Economic Data and Applications Center (SEDAC) has produced compilations of
global data on child malnutrition and mortality (CIESIN 2005). The Global Sub-national
Prevalence of Child Malnutrition dataset consists of estimates of the percentage of
children with weight-for-age z-scores that are more than two standard deviations below
the median of the NCHS/CDC/WHO International Reference Population. Data are
reported for the most recent year with sub-national information available at the time of
development. The data products include a shapefile (vector data) of percentage rates,
grids (raster data) of rates (per thousand in order to preserve precision in integer
format), the number of children under five (the rate denominator), and the number of
underweight children under five (the rate numerator), and a tabular dataset of the same
and associated data. This dataset is produced by the Columbia University Center for
International Earth Science Information Network (CIESIN).

The Global Sub-national Infant Mortality Rates consists of estimates of infant mortality
rates for the year 2000. The infant mortality rate for a region or country is defined as the
number of children who die before their first birthday for every 1,000 live births. The data
products include a shapefile (vector data) of rates, grids (raster data) of rates (per
10,000 live births in order to preserve precision in integer format), births (the rate
denominator) and deaths (the rate numerator), and a tabular dataset of the same and
associated data. Over 10,000 national and sub-national units are represented in the
tabular and grid datasets, while the shapefile uses approximately 1,000 units in order to
protect the intellectual property of source datasets for Brazil, China, and Mexico.

These data sets have been compiled from DHS data plus UNICEF and WHO data sets,
and include all data collected before 2000. For West Africa they are less detailed (in
terms of the minimum size of administrative units covered) than the most recent DHS
and MICS data-sets. In some cases (for example Chad) there is no sub-national
disaggregation. The data is available as grid or shape files from
http://sedac.ciesin.org/povmap/

Table 3. Current Availability of Agricultural Statistics, DHS and MICS Data
Country           agric          Source            DHS child nutrition     MICS child
                  data                                                     nutrition
Benin                     2000   Agromaps             1996, 2001, 2006
Burkina Faso              2004   Govt Statistics      1993, 1999, 2003
Cameroon                  2003   Govt Statistics      1991, 1998, 2004                   2000
Central African                                          1994 (not sub-                   2006
Republic                                                      national)      (not sub-national)
Chad                                                        1997, 2004     2000 (not truly sub-
                                                                                      national)
Congo                                               2005 (not truly sub-
                                                               national)
Cote d’Ivoire                                      1994, 1999 (not sub-        2000 (not sub-
                                                               national)       national), 2006
DRC                       1996   Agromaps                                                 2001
Gabon                                                             2000
Gambia                    1998   Agromaps                                                2000
                                                                                         2006
Ghana                     2003   Govt Statistics     1988, 1993, 1998,                   2006
                                                                  2003
Guinea                                                      1999, 2005
Guinea Bissau             1992   Agromaps                                                2006
Country agric Source DHS child nutrition MICS child
data nutrition
Mali 1993 Agromaps 1987, 1996, 2001,
2006
Mauritania 2001
Niger 2005 Govt Statistics 1992, 1998, 2006 2000
2006
Nigeria 2006 Govt Statistics 1990, 1999, 2003
(not truly sub-
national)
Senegal 1997 Agromaps 1986, 1993, 2005 2000
Sierra Leone 2002 OCHA/SLIS 2000
2006
Togo 1988, 1998 2000 (not sub-
national), 2006
Sub-National Agricultural Production Statistics
A primary source of sub-national agricultural production data for Africa is the AgroMaps
database, prepared by the International Food Policy Research Institute (IFPRI), FAO
and SAGE (George, Nachtergaele and Koohafkan, 2003) The shortcomings of existing
data and an increasing necessity to have better global land-use data to support their
respective programs, led IFPRI, FAO and SAGE to set up in early 2002, the Agro-MAPS
(Mapping of Agricultural Production Systems) Initiative. The institutions agreed to pool
their resources and to jointly prepare, with the support of national and regional
institutions, the Agro-MAPS database. It was agreed that the database would contain
selected agricultural statistics (viz. crop production, area harvested and crop yields)
aggregated by sub-national administrative districts. These statistics represent a limited,
yet very important component of agricultural land use.
AGROMAPS data has been supplemented with more recent agricultural statistics for
Burkina Faso, Cameroon, Ghana, Niger, Nigeria and Sierra Leone, as listed in Table 2,
and new shapefiles have been prepared to supplement AGROMAPS for West Africa.
Additional data is currently being collected by ReSAKSS-WA, and this report will be
updated as new data becomes available.
Population Data
This was obtained in two forms from http://sedac.ciesin.org/gpw/index.jsp Gridded
Population of the World (GPWv3) is the third edition of a large-scale data product that
demonstrates the spatial distribution of human populations across the globe (Balk and
Yetman,2004). The purpose of the GPWv3 project is to provide a spatially
disaggregated population layer that is compatible with datasets from social, economic,
and earth science fields. The output is unique in that the distribution of human
population is converted from national or sub-national spatial units (usually administrative
units) of varying resolutions, to a series of geo-referenced quadrilateral grids at a
resolution of 2.5 arc minutes.
The Global Rural-Urban Mapping Project (GRUMP) provides a new suite of data
products that add rural-urban specification to GPWv3. This project was developed out of
a need for researchers to be able to distinguish population spatially by urban and rural
areas( Balk et al 2004). The central data product resulting from GRUMP is a Gridded
Population of the World with Urban Reallocation in which spatial and population data of
both administrative units and urban extents are gridded at a resolution of 30 arc-
seconds.The gridded population data, divided into rural and urban populations, was used to calculate the number of malnourished children, according to the DHS and MICS indicators, per square kilometer across the WA-SAKSS region. Climate Data Analysis of the distribution of child malnutrition by agro-ecozones has been aided by the use of gridded data on precipitation and temperature produced by the Climate Research Unit of the University of East Anglia (New et al 2000, New et al 2002), downloaded from http://www.cru.uea.ac.uk/cru/data/hrg.htm . The climate data was also used to calculate suitability for different staple crops. Figure 2. Available DHS, MICS and Agricultural Production Data The areas in West Africa covered by recent disaggregated DHS and MICS surveys, and where sub-national agricultural production statistics are available, are shown in Figure 2. DHS data is also available for Mauritania, Central African Republic, Congo and Gabon, but only at very coarse resolution. Cote d’Ivoire was covered by early national DHS surveys, and a disaggregated survey was recently undertaken by MICS. Liberia has not been covered by either DHS or MICS surveys. Sub-national agricultural statistics are not yet available to the author for Chad, Guinea, Cote d’Ivoire, Liberia or Togo.
Comparison of DHS, MICS and CIESIN datasets

Table 4. Mean National Indicators from DHS and MICS

Country                        Stunt DHS     Stunt MICS   Waste DHS    Waste MICS     U/W DUS     U/W MICS
Ghana                          29.9          23           7.1          5              22.1        18
Niger                          41.1          40           20.7         14             49.6        40
Cote d’Ivoire                  25.2          23.4         7.8          7.2            21.2        20.5
Togo                           21.7          23.7         12.3         14.3           25.1        26.8

The DHS and MICS datasets on child nutrition should be broadly comparable, since the
methodology was designed to be the same, and the sample sizes were similar. Only
three countries (Ghana, Senegal and Niger) were sampled by both DHS and MICS at
the same levels of disaggregation. Cameroon, Chad and Togo were also sampled by
MICS, but results for child nutrition are not yet available on their website. The dates of
the MICS and DHS surveys in Senegal and Niger were different; both countries were
sampled by MICS in 2000, while the most recent DHS survey in Senegal was in 2005
and in Niger in 2006. Despite the date differences, the results of the two surveys were
broadly similar, as shown in Table 4 (Mean national values for DHS and MICS surveys
in nearest years) and Charts 1 and 2 (disaggregated data).

                          60
                                                                             R2 = 0.6824
                          50
          Stunting MICS

                          40

                          30

                          20

                          10

                          0
                               0.0    10.0        20.0     30.0       40.0     50.0        60.0    70.0
                                                            Stunting DHS

Chart 1. Correlation between DHS and MICS child stunting, Senegal and Niger
20
18
R2 = 0.2895
16
14
Wasting MICS 12
10
8
6
4
2
0
0.0 2.0 4.0 6.0 8.0 10.0 12.0 14.0
Wasting DHS
Chart 2. Correlation between DHS and MICS child wasting, Senegal and Niger
Differences between the two sets of results are no greater than between different year
surveys by the same agency (See section 10 below). We can therefore use both data
sets (MICS and DHS) for regional studies in west and central Africa, taking advantage of
the fact that the two surveys did not normally duplicate each others efforts in the same
country. This effectively increases the number of study countries from 11 if only DHS
data are used, to 16 when MICS data is added. Although the MICS survey appears to
have been planned essentially as a “one-off” in 2000 for the Millenium Assesment, some
countries were sampled again in 2006. Time-series of MICS child nutrition indicators are
not available for most countries covered only by MICS surveys, although MICS data can
complement DHS data in countries covered by both surveys.
The CIESIN / SEDAC child underweight and infant mortality data is generally at a lower
spatial resolution than the most recent DHS and MICS data, but has effectively global
coverage. Earlier DHS data sets contributed to this compilation in West Africa, so it is
not surprising that correlations between the two data sets are good. Chart 3 shows the
correlation between reported child underweight percentages from CIESIN/SEDAC and
underweight percentages from combined DHS and MICS data. The two data sets
correlate well, with an R squared of better than 0.6. This means that the CIESIN/SEDAC
data can be used as a proxy for DHS/MICS in countries where full DHS surveys have
not been carried out recently. It is unfortunate that CIESIN/SEDAC only mapped child
malnourishment, and not the more specific stunting and wasting indicators.60.0
50.0
CIESIN Underweight
40.0
30.0
R2 = 0.6266
20.0
10.0
0.0
0.0 10.0 20.0 30.0 40.0 50.0 60.0 70.0
DHS Underweight
Chart 3. Correlation between Two Sets of Child Underweight data
200.0
180.0
R2 = 0.2964
160.0
140.0
Infant Mortality
120.0
100.0
80.0
60.0
40.0
20.0
0.0
0.0 10.0 20.0 30.0 40.0 50.0 60.0 70.0
Underweight (DHS and MICS)
Chart 4. Correlation between Infant Mortality and DHS/MICS Child Underweight
There is weak correlation between CIESIN/SEDAC infant mortality and the DHS/MICS
child nutrition indicators (infant mortality is not quantified in the DHS reports), as shown
by the example in Chart 4. The relationship is weak because the child nutrition indicators
are for children aged less than 5 years, while infant mortality concerns children less than
one year old only, and also infant mortality is strongly influenced by mothers health and
nutrition as well as the general incidence of disease, rather than just by child nutrition.
Spatial Aspects of Child Nutrition
The three main indicators of child malnutrition in West and Central Africa – stunting,
wasting and underweight, can be mapped on a regional scale to highlight trends in
malnutrition and areas of greatest concern. Figures 3, 4 and 5 map the three main
indicators, classified according to the FAO recommendations presented in Table 2.
There are significant differences between and similarities among the distribution of the
three indicators. It should be remembered that stunting is an indicator of long-term
dietary deficiency, while wasting is a shorter-term effect, exaggerated in years of poorharvests with relatively fast recovery in good years. This means that differences in the timing of DHS/MICS surveys in different countries can be expected to have a greater effect on the wasting indicator than on stunting. Figure 3. Child Stunting in West and Central Africa Figure 4. Child Wasting in West and Central Africa
Stunting in children under 5 years (Figure 3) shows a marked belt of very high and
extremely high (more than 50% of children stunted) incidence stretching from Chad
westwards through southern Niger, north-western Nigeria, Burkina Faso to northern
Ghana and southern Mali. Another area of very high stunting incidence is found in
Eastern DRC. Child wasting (Figure 4) is extremely high (more than 25% of children
wasted) in parts of Burkina Faso, and is also very high in much of Chad, Mali, DR Congo
and Guinea Bissau.

Figure 5. Underweight Children in West and Central Africa
Figure 6. Underweight children in West and Central Africa from CIESIN/SEDAC map

The distribution of underweight children (basically a composite of stunting and wasting)
as mapped from DHS and MICS data is shown in Figure 5. There are pockets of
extremely high underweight incidence in Burkina Faso, while the northern half of Chad
and southern Niger also show extremely high incidence. High incidence of underweight
children can be seen in central Ghana, eastern Mali, western Niger, north-western
Nigeria and southern Chad. The regional picture is confirmed in the lower-resolution
SEDAC data shown in Figure 6, although this does not show the extremely high
incidence in parts of Burkina, possibly because the lower resolution moderates extreme
values, or perhaps because of different years of data collection.
Figure 7. Infant Mortality in West and Central Africa

The distribution of infant mortality, derived from the CIESIN/SEDAC data, is shown in
Figure 7. The highest incidence in the region is in Sierra Leone and in southern Niger,
while Liberia and central Mali also have high infant mortality. Within the countries
covered by WA-SAKSS, lowest values of infant mortality are found in Mauritania,
Senegal, south-eastern Ghana, central Nigeria, western Cameroon and Gabon.

Figure 8. Combined Stunting and Wasting
In order to highlight areas where children are both chronically and acutely malnourished,
it is useful to map combined stunting and wasting, as shown in Figure 8. Based on the
FAO classification (Table 1) stunting and wasting are each divided into five classes. This
provides a potential 25 classes combining the two indicators. Not all these possible
classes exist, and the 18 classes observed in West Africa are shown in the map. Lowest
combined incidences of stunting and wasting are generally found in more humid coastal
districts, with the exception of Sierra Leone and DRC, while highest combined incidence
is seen in central Mauritania, northern Mali, northern and eastern Burkina, southern
Niger and Chad, and north-western DRC. In countries with a marked climatic gradient
such as Ghana, Nigeria and Cameroon, the combined incidence increases strongly from
south to north.

The DHS and MICS surveys provide child malnutrition indicators as percentages of the
population in every survey area, but for the purposes of targeting agricultural
development assistance it is sometimes useful to know the absolute numbers of children
affected. When considering impact of assistance, a very high incidence of child stunting
in a relatively unpopulated area may translate to very few children, while a more
moderate incidence in a very densely populated area might be a more practical target.

In order to calculate the actual numbers of malnourished children, the percentage of
affected children in each administrative unit must be multiplied by the actual number of
children. The DHS reports summarise the demography of each unit, so that the
percentage of the population under 5 years of age is known. The Gridded Population of
the World (GPW3) data from CIESIN (Balk, 2004) is used to calculate the numbers of
stunted and wasted children per square kilometer from the DHS statistics. Urban areas
are separated from rural using GRUMP maps (Balk et al 2004), and malnutrition indices
are adjusted for urban areas using urban/rural ratios from the DHS and MICS surveys.
Figure 9 shows the spatial distribution of stunted children calculated from the DHS and
MICS data.
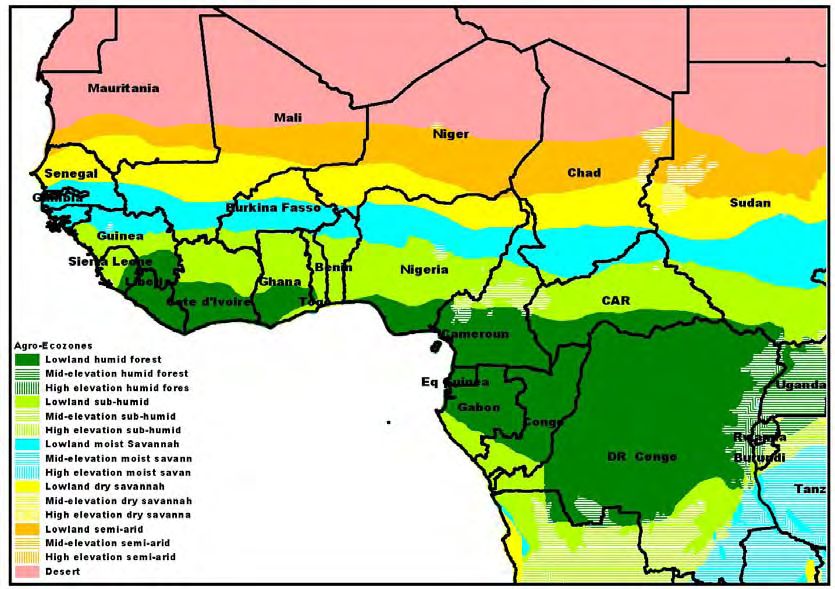
Figure 9. Distribution of Stunted Children in West and Central Africa

As might be expected, the distribution of numbers of malnourished children is strongly
controlled by population density. The extremely high population densities in Nigeria, as
compared to most of the other countries in the region, result in very high numbers of
stunted children in north-central Nigeria, and in the southern coastal regions, despite
percentage incidence of stunting being relatively low in Nigeria. Other concentrations are
seen in central southern Niger, central Burkina Faso, southern Benin Republic, southern
Ghana and coastal Senegal.

Child Nutrition and Climate
The main climatic factors controlling agriculture in West and Central Africa are the
amount and temporal distribution of rainfall. Minimum temperatures are rarely a control,
since there are no extensive areas of highland over 1500 metres elevation in the area
(with the exception of Eastern DRC). A useful indicator of possibilities for agriculture is
the Length of Growing Period (LGP) a composite of rainfall, humidity and soil physical
properties, which indicates the number of days in the year when normal crop growth will
occur. Lengths of growing period can be conveniently grouped into zones, usually known
as Agro-ecozones, within which agricultural conditions are relatively constant (See
Figure 10). Apart from length of growing period, these zones are also classified on the
basis of elevation into lowland, mid-elevation and high elevation zones, but in West
Africa the only significant mid-elevation zones are in central and western Cameroon and
in the Jos Plateau of Nigeria.
Figure 10. Agro-Ecological Zones of West and Central Africa (Legg,2004)

The distribution of administrative areas with high incidence of child stunting and wasting
can be analysed in relation to the agro-ecozones in which they lie, in order to determine
whether climatic factors have any influence on child nutrition in the region. Table 5
present a matrix of the numbers of administrative areas by nine categories of combined
stunting and wasting and six ecozones. Zones with relatively low combined incidence of
stunting and wasting are numbered in black, those with elevated values of one or other
indicator in blue, and those with high incidences of both stunting and wasting in red.

It can be seen that high incidence of both stunting and wasting is more common in drier
ecozones than in the most humid. All areas in the semi-arid ecozone show high
incidence of both stunting and wasting, while in the dry savanna ecozone 70% of areas
show elevated values. In the humid forest ecozone, in comparison, only 20% of
administrative areas have high incidences of stunting and wasting. The sub-humid and
moist savanna ecozones are intermediate, with about 60% of areas having high
incidence. The correlations are not very strong however, except that the two extreme
ecozones, humid forest and desert, show much lower incidences of stunting and wasting
than the other zones.

Table 5. Matrix of numbers of administrative districts by malnutrition class and agro-ecozone
                                           semi-       dry          moist        sub-      humid
 Nutrition Class             desert        arid        savanna      savanna      humid     forest
 low stunting low wasting                                                  1                      2
 low stunting medium wasting                                    4          2           1
 low stunting high wasting                                      1                      1
 medium stunting low wasting                                                           1         5
 medium stunting medium
 wasting                            1                                        6         5         5
semi- dry moist sub- humid
Nutrition Class desert arid savanna savanna humid forest
medium stunting high
wasting 3 1 1 3 1
high stunting low wasting 2 4
high stunting medium wasting 2 6 10 1
high stunting high wasting 9 11 15 7 2
Another way of looking at relationships between malnutrition and eco-zones is to
calculate the total numbers of malnourished children, according to the three indicators, in
each ecozone. Charts 5 and 6 show the results of such a calculation. Chart 5 shows the
totals for all countries in the region, suggesting peaks of all three indicators in the moist
savanna and sub-humid ecozones. Chart 6 shows the total numbers of children when
Nigeria is excluded from the calculation. This shows the very strong effect of the
extremely high population in Nigeria. Highest numbers of stunted children are now
shown to be in the dry savannah and sub-humid ecozones, while numbers of wasted
children are greatest in the dry and moist savannas. The difference between different
eco-zones is not marked except for the desert and semi-arid ecozones, where numbers
of affected children are small.
7000000
6000000
number of children
5000000
4000000 Stunted
Wasted
3000000
Underweight
2000000
1000000
0
desert semi arid dry moist sub humid humid
savanna savanna forest
eco-zones
Chart 5. Distribution of malnourished children by three indicators in agro-ecozones2500000
2000000
number of children
1500000 Stunted
Wasted
1000000 Underweight
500000
0
desert semi arid dry moist sub humid humid
savanna savanna forest
eco-zones
Chart 6. Distribution of malnourished children by agro-ecozones omitting Nigeria
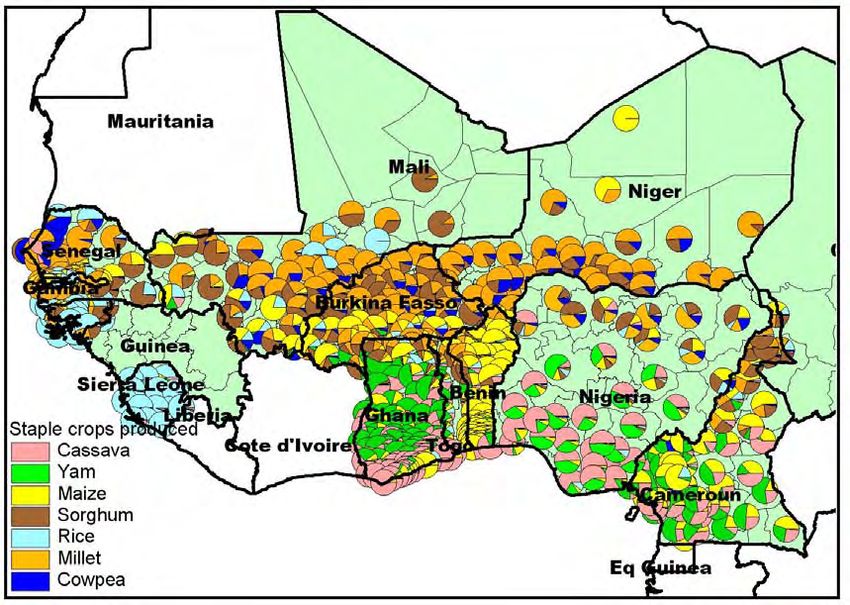
Figure 11. Relative Proportions of Staple Crops in West Africa
Child Nutrition and Agricultural Production
The relative proportions of the main staple food crops grown in West Africa, according to
available sub-national production statistics, are shown in Figure 11. The transition from
dominantly cassava and yams in the humid coastal regions, through a maize-dominatedzone to millet, sorghum and cowpea in the inland more dry areas is clear, and closely follows the farming systems identified by Dixon et al (2001) and shown in Figure 12. The main exceptions to the general picture are Sierra Leone and Guinea Bissau, where rice cultivation is dominant. Figure 12. Farming Systems in West Africa. From Dixon et al (2001) This distribution of staple food crops is governed mainly by rainfall, and to a lesser extent by tradition. A comparison of Figures 11 and 12 with the agro-ecozones shown in Figure 10 shows that root and tuber crops are confined mainly to the humid and sub- humid ecozones, while millet, sorghum and cowpea are crops of the dry savanna and semi-arid zone. A mixture of maize, root crops and more drought tolerant cereals is characteristic of the moist savanna. The nutritional status of children is mainly governed by food consumption, both quantity and nutritional quality, and disease. Food consumption quantity depends on availability of food either from family production, or purchased if household funds permit. Food quality depends also on family finances, but can also be cultural, where traditional foods may be inferior nutritionally to novel crops. Availability of home-grown food and of money
to purchase food is governed by numerous factors, including climate, land availability,
land tenure systems, markets and the financial status of the country. Climate can be
extremely variable, with periodic droughts severely affecting food production, and
unexpected floods also having disastrous consequences.

Data on food consumption are not yet available for the WA-SAKSS countries in
sufficiently disaggregated form to enable direct comparison with indicators of child
nutrition. Agricultural production statistics at province or district level are now available
for most countries in the region, although some are rather out of date. These can be
used as a proxy for food consumption in rural areas, since most production of food
staples is by smallholder farmers, and a significant proportion of food production is
usually consumed at home. There will obviously be some anomalies, with sales of food
crops by farmers to markets in their area and even far away, and purchase by farmers of
some of their food requirements.

Within West and Central Africa, there is no significant correlation between any of the
child nutrition indicators and food production, measured either as the potential total per
capita calorie intake from own production (total calories in annual crop production
divided by population*365) or as the proportional contribution of each major staple crop
to the total calorific production.

Within individual countries, especially large countries which cross many eco-zones and
farming systems, some very interesting correlations can be observed between child
nutrition indicators and the proportion of total food production contributed by specific
crops. In Nigeria, even though DHS sampling was very coarse, dividing this very large
and populous country into only six zones, some very significant correlations can be
seen.

                      14

                      12

                      10
                                                                           R2 = 0.722
            % Maize

                      8

                      6

                      4

                      2
                      0
                           0.0   10.0   20.0       30.0       40.0           50.0       60.0
                                                stunting %

Chart 7. Child Stunting and Proportion of Maize in Staple Crops, Nigeria
14
12
10
% Maize
8
R2 = 0.2042
6
4
2
0
0.0 2.0 4.0 6.0 8.0 10.0 12.0 14.0
Wasting %
Chart 8. Child Wasting and Proportion of Maize in Staple Crops, Nigeria
20
R2 = 0.9366
15
10
% Millet
5
0
00 10.0 20.0 30.0 40.0 50.0 60.0
-5
Stunting %
Chart 9. Child Stunting and Proportion of Millet in Staple Crops, Nigeria
25
20
R2 = 0.9671
15
% Sorghum
10
5
0
00 10.0 20.0 30.0 40.0 50.0 60.0
-5
Stunting %
Chart 10. Child Stunting and Proportion of Sorghum in Staple Crops, Nigeria.
As shown in Charts 7, 9 and 10, there is a strong positive correlation between child
stunting and the relative proportions of maize, millet and sorghum in total agricultural
production, while charts 11 and 13 show strong negative correlations between stunting
and the proportions of yams and cassava. Correlations with child wasting are less
strong, as shown in charts 8, 12 and 14. This does not suggest that maize, millet and
sorghum are intrinsically less nutritious than yams and cassava (calorifically speaking,
and in terms of micro-nutrients, the reverse is actually true), but rather that the more
humid eco-zones where cassava and yams are dominant food crops are more fertile,with more reliable climate and less soil degradation, than the drier eco-zones where
maize, millet and sorghum are dominant. In many countries, population densities are
also lower in the humid zones than in drier savannas, so more land per household is
available for farming. Similar, but less significant, correlations are seen in other countries
which cross eco-zones, for example Cameroon, as shown in Charts 15, 16 and 17.
Ghana shows similar trends, while countries such as Burkina Faso, which are essentially
within only a single agro-ecozone, show no correlations.
45
40
35
30
% Yam
25
R2 = 0.6799
20
15
10
5
0
0.0 10.0 20.0 30.0 40.0 50.0 60.0
Stunting %
Chart 11. Child Stunting and Proportion of Yams in Staple Crops, Nigeria
45
40
35
30
% Yam
25
R2 = 0.5688
20
15
10
5
0
0.0 2.0 4.0 6.0 8.0 10.0 12.0 14.0
Wasting %
Chart 12. Child Wasting and Proportion of Yams in Staple Crops, Nigeria
70
60
50
% Cassava
40
R2 = 0.868
30
20
10
0
0.0 10.0 20.0 30.0 40.0 50.0 60.0
Stunting %
Chart 13. Child Stunting and proportion of Cassava in staple crops in Nigeria70
60
50
% Cassava
40
30
R2 = 0.0504
20
10
0
0.0 2.0 4.0 6.0 8.0 10.0 12.0 14.0
Wasting %
Chart 14. Child Wasting and proportion of Cassava in staple crops in Nigeria
70
60
50
40
% Cassava
30
R2 = 0.3822
20
10
0
00 5.0 10.0 15.0 20.0 25.0 30.0 35.0 40.0 45.0 50.0
-10
-20
Stunting %
Chart 15. Child Stunting and proportion of Cassava in staple crops in Cameroon
70
60
50
% Cassava
40
R2 = 0.2041
30
20
10
0
0.0 1.0 2.0 3.0 4.0 5.0 6.0 7.0 8.0 9.0 10.0
Wasting %
Chart 16. Child Wasting and proportion of Cassava in staple crops in Cameroon80
70
60
50
% Yams
40
R2 = 0.3065
30
20
10
0
00 5.0 10.0 15.0 20.0 25.0 30.0 35.0 40.0 45.0 50.0
-10
Stunting %
Chart 17. Child Stunting and proportion of Yams in staple crops in Cameroon
14.0
12.0
10.0
R2 = 0.3818
% Wasting
8.0
6.0
4.0
2.0
0.0
0 1000 2000 3000 4000 5000 6000 7000
Calories per capita
Chart 18. Child Wasting and potential per capita calorie intake from own production, Nigeria
50.0
45.0
40.0
R2 = 0.4889
35.0
% Stunting
30.0
25.0
20.0
15.0
10.0
5.0
0.0
0 500 1000 1500 2000 2500
Calories per capita
Chart 19. Child Stunting and potential per capita calorie intake from own production, Sierra Leone
The potential per capita calorie intake from own production can be calculated from
agricultural production statistics and population data. Theoretically, higher calorific intake
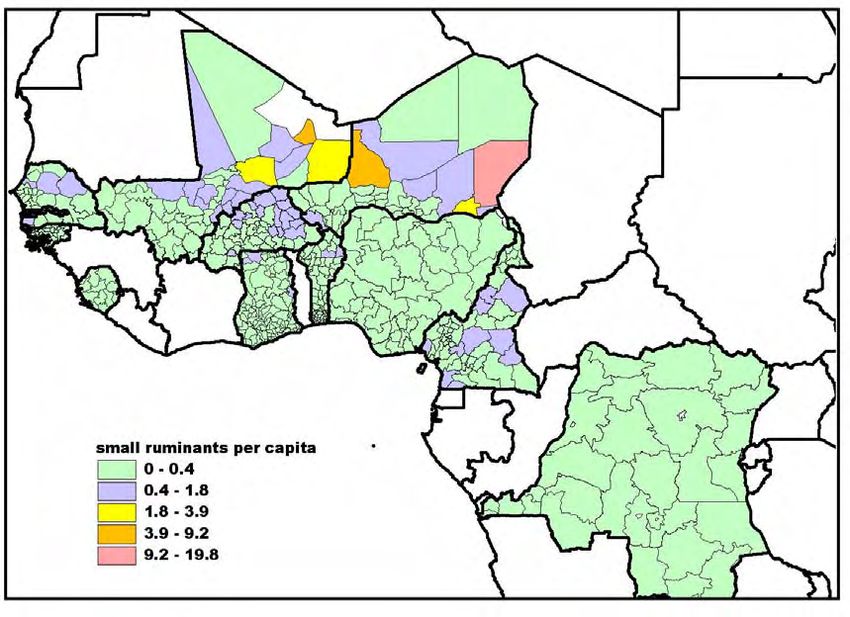
should lead to lower incidence of child malnutrition. In most countries of the region, thereis no significant correlation between potential calorific intake and malnutrition, but in the case of Nigeria there is a clear relationship between child wasting and potential calorie intake, as shown in Chart 18. There is no significant correlation between stunting and calorific intake. In Sierra Leone, on the other hand, there is a positive correlation between child stunting and potential calorific intake, as shown in Chart 19. This relationship is difficult to explain, but could result from unknown levels of food imports. Figure 13. Numbers of cattle per capita The Role of Livestock In parts of West and Central Africa, livestock are extremely important culturally and as sources of food and income. This is especially true in the less humid parts of the region, as shown in figures 13 and 14, the distribution of cattle and small ruminants (sheep and goats) per human capita, derived from FAO/ILRI data sets (Thornton et al, 2002; Steinfeld et al, 2006). The original grids of livestock numbers, produced by ILRI, have been aggregated to the administrative units used for child nutrition surveys, and then divided by the population of humans for each unit to give livestock numbers per capita. As shown in Figure 15, cattle are proportionally more important than small ruminants in the arid and moister portions of the region (exemplified by northern Niger and Northern Mali and the Congo basin respectively), while small ruminants are particularly important in the semi-arid areas in a zone stretching from northern Nigeria through Niger, central Mali and into Senegal. Within the small ruminants, the ratio of sheep to goats is quite variable (Figure 16), and may reflect cultural heritage rather than specific selection based on climate.
The numbers of cattle and small ruminants per human capita in the 616 administrative
units in the study area can be grouped into quartiles. The upper quartile for each
livestock group are classed as “very important” and the third quartile “significant”. This
results in eight categoris of relative combined importance of cattle and small ruminants,
as shown in Figure 16. In Senegal, Northern Mali, southern Niger and northern Nigeria,
small ruminants are very important and cattle relatively insignificant, while in some
humid areas like Guinea Bissau, Sierra Leone, south-eastern Cameroon and central
DRC cattle are very important and small ruminants insignificant. Cattle also dominate
over small ruminants in northern Niger, the far south of Mali, and areas in central Ghana
and Benin. There are large areas where both cattle and small ruminants are very
important, notably a zone from south-central Mali through Burkina Faso into northern
Ghana and Benin, most of Cameroon, and central Niger. Other areas show less
important, and often mixed, livestock concentrations.

Figure 14. Numbers of small ruminants per capita
Figure 15. Ratio of Cattle to Small Ruminants

Figure 16. Ratio of Sheep to Goats
Figure 17. Distribution of Livestock Systems

In order to examine more closely the connections between farming systems, including
livestock, and child nutrition, a new classification of the region into five basic farming
systems has been developed, based on declared agricultural production for each
administrative unit, divided by the population of the unit in order to normalize production
to population density. A total of eight crops – rice, maize, millet, sorghum, yams/sweet
potatoes, cassava, cowpeas and groundnuts – were used in the classification. The
results were simplified into four main zones based on dominant crops. The root crop
zone is dominated by cassava, yams and sweet potatoes, with minor production of other
crops. The mixed cereal and root zone produces maize, cassava and yams as dominant
crops, with minor sorghum, cowpea and groundnut. The moist cereal zone produces
maize, millet, sorghum, cowpea and groundnut with insignificant root crops, while the dry
cereal zone produces the same cereals but without maize. A fifth farming system has
rice as the dominant crop, with insignificant production of anything else. The geographic
distribution of these farming systems is shown in Figure 18.
Figure 18. Farming Systems based on per capita agricultural production

Table 6 shows the calculated mean values for the main indicators of child nutrition by
farming system, further sub-divided by livestock densities. The mean values for the five
main farming systems suggest that child nutrition, as measured by stunting and wasting,
becomes progressively worse from root crops through cereals and roots to moist and dry
cereals, with stunting increasing from 28.6% to 37.3% and wasting increasing from 7.8%
to 11.4%. Infant mortality increases from 76.4 per thousand to 108.9 per thousand. The
farming system dominated by rice shows intermediate values for stunting and wasting,
but very high infant mortality. Stunting, wasting and infant mortality show divergent
trends when averaged on livestock densities. Lowest values for stunting and wasting
(best nutrition) - 30.6% and 7.6% respectively - are found in areas with no significant
livestock. Highest stunting incidence (38.7%) is seen in areas with moderate
concentrations of small ruminants, but it is also high in areas with abundant cattle.
Highest incidence of wasting is seen in areas with abundant cattle. The unexpected
general conclusion is that keeping livestock leads to poorer child nutrition and increased
infant mortality. The worst stunting of all is in moist cereal areas with moderate
concentrations of small ruminants (50%) and root crop areas with abundant cattle
(45.5%), the worst wasting is seen in moist cereal areas with moderate cattle and
abundant small ruminants (16.6%) and dry cereal zones with abundant cattle and small
ruminants (16%), and worst child mortality is in rice-growing areas with abundant cattle
(148.5 per thousand).
Table 6. Matrix of Child Nutrition Indicators and Farming Systems and Livestock

Farming       Mean         No         cattle   CATT       Cattle +    CATTLE       Cattle    CATT        sr        SR
                        Livestock               LE          sr          + sr       + SR      LE +
System                                                                                        SR
  Root        28.6        29.0        29.1      45.5       22.5         30.4                  25.2      32.9
  crops        7.8          7.8        7.6       9.5       13.0          5.4                   6.1       6.5
              76.4        76.2        81.9     129.0       60.6         82.3                  69.3      66.5
 Cereals      31.5        31.0        31.8      32.4       32.2         32.3        33.1      30.3
   and         7.5          7.2        7.3       9.3        8.2          9.0        10.3       8.0
  Roots       81.9        82.1        76.9      89.3       85.6        103.2        90.8      88.6
  Moist       36.6         30.5       40.8      41.9       32.2         32.7        31.9      37.8      50.0      37.2
 Cereals      11.5          5.1        8.7      11.1       13.5         12.3        16.6      13.8      10.1       8.3
              94.4         65.9       97.2     106.5      102.0        102.5       105.9      99.2      87.3      81.3
  Dry         37.3        31.0        35.8      33.9       33.1         39.2        37.6      40.1      41.8      35.9
 Cereals      11.7          9.1        9.3      11.9       10.5         11.3        12.8      16.0      10.4      10.9
              108.9       92.0       103.9     124.0      104.0        116.8       113.2     113.5     114.4     106.7
  Rice        33.0        30.0        36.1     35.5        27.8         41.7        27.6      35.7                22.9
               9.4          7.5       10.5       9.6        8.6         12.3         8.5      10.0                11.9
              134.7       120.9      144.0     148.5      120.7        137.7       132.0     143.4                85.2
 Means                    30.6       33.2      35.2        31.7         35.0        35.5      36.5      38.7      36.6
                            7.5       8.2       9.9        10.2         10.2        12.3      13.1       9.3      11.7
                          84.1       93.1      116.2       94.6        108.5       113.7     103.5      99.9     109.2
Notes to Table 6. Nutrition indicators colour-coded as Stunting %, Wasting % and Infant Mortality per thousand. Livestock
density classes – lower case indicate third quartile of cattle or small ruminant abundance per capita human population,
UPPER CASE fourth quartile.

Child Nutrition and Development Domains
The concept of “development domains”, sometimes known as “recommendation
domains”, is central to GIS targeting for agricultural development (Place, et al, 2006;
Pender et al, 2006). Certain areas have a combination of favorable factors, for example
climate, soil quality, population density and access to markets, which increases the
probability of successful outcomes and maximises the number of farmers benefiting from
the intervention. GIS can be used to overlay digital maps of the different positive and
negative factors, to assign weights to them, and to produce new maps of the most
favorable areas for different kinds of agricultural development. Ease of access to
markets, in terms of cost or of time, can be quantified within a GIS based on locations of
markets and maps of transport routes and barriers to travel (Deichmann, 1997: Black et
al, 2004: Thornton et al 2006). A study undertaken for the West Africa SAKSS node in
2006 (Chamberlin, Legg and Sonder, in Prep) combined population density and market
access to classify West and Central Africa into twelve different development domains
based on four classes of population density and three classes of market access as
shown in figure 19.
Figure 19. Development Domains in West and Central Africa (Chamberlin, Legg and Sonder, in Prep)
Development domains are then overlain with the administrative areas used for child
nutrition studies, and the dominant development domain identified for each area. Mean
values of child nutrition indicators are calculated for each of the ten development
domains occupying significant areas in the region (domains with poor market access and
high to very high population density are insignificant). The results of this analysis are
summarised in Table 7.
Table 7. Matrix of Development Domains and Child Nutrition Indicators
Development Low population Moderate High population Very high
Domain density population density density population density
Poor market access 31.9 32.4
9 10.2
26.5 26.4
96.1 92.5
Moderate market 36.1 33.4 34.9 28.0
access 11.1 10.9 8.9 8.4
30.1 30.3 26.4 23.1
105.5 96.2 85.2 81.8
Good market 35.0 35.0 29.0 27.7
access 9.1 9.8 7.3 8.0
26.2 28.9 20.9 20.9
105.9 100.8 72.5 82.0
Key:- 31.9 = % stunting 10.2 = % wasting 26.4 = % underweight 92.5 = infant mortality per thousand
The results of this analysis are to some extent counter-intuitive. They suggest that most
indicators of child nutrition deteriorate as market access improves. In low populationYou can also read