Westport - flood forecasting roadmap for evacuation warnings - Prepared for West Coast Regional Council June 2019
←
→
Page content transcription
If your browser does not render page correctly, please read the page content below
Westport - flood forecasting
roadmap for evacuation warnings

 Prepared for West Coast Regional Council

 June 2019
Prepared by:
Maurice Duncan, Celine Cattoën, Richard Measures, Trevor Carey-Smith.

For any information regarding this report please contact:
Maurice Duncan

Senior Scientist
Applied Hydrology Group
+64-3-373 8786
Maurice.Duncan@niwa.co.nz

National Institute of Water & Atmospheric Research Ltd
PO Box 8602
Riccarton
Christchurch 8011

Phone +64 3 348 8987

NIWA CLIENT REPORT No: 2019115CH
Report date: June 2019
NIWA Project: ELF19507

 Quality Assurance Statement

 Reviewed by: Graeme Smart

 Formatting checked by: Rachel Wright

 Approved for release by: Helen Rouse

© All rights reserved. This publication may not be reproduced or copied in any form without the permission of
the copyright owner(s). Such permission is only to be given in accordance with the terms of the client’s contract
with NIWA. This copyright extends to all forms of copying and any storage of material in any kind of
information retrieval system.

Whilst NIWA has used all reasonable endeavours to ensure that the information contained in this document is
accurate, NIWA does not give any express or implied warranty as to the completeness of the information
contained herein, or that it will be suitable for any purpose(s) other than those specifically contemplated
during the Project or agreed by NIWA and the Client.
Contents

Executive summary .................................................................................................................. 6

1 Introduction ................................................................................................................... 7
 1.1 Scope .................................................................................................................... 7
 1.2 Report structure.................................................................................................... 7

2 Background .................................................................................................................... 9
 2.1 Flood hazard for the integrated family health centre ............................................. 9
 2.2 Buller River flood sources ...................................................................................... 9
 2.3 Current flood warning for Westport .................................................................... 11
 2.4 Existing NIWA flow and tide forecasting systems for Westport ............................ 11
 2.5 Hydrological monitoring ...................................................................................... 11
 2.6 Backup systems ................................................................................................... 13
 2.7 Key components for the flood forecasting roadmap ............................................ 14

3 Required forecast specifications................................................................................... 15
 3.1 Forecast accuracy ................................................................................................ 15
 3.2 Forecast reliability ............................................................................................... 16
 3.3 Forecast lead time ............................................................................................... 16
 3.4 Summary of forecast specifications ..................................................................... 17

4 Potential flood forecasting approaches ........................................................................ 18
 4.1 Observed upstream flow/level ............................................................................ 18
 4.2 Rainfall thresholds .............................................................................................. 18
 4.3 Rainfall radar....................................................................................................... 19
 4.4 Nowcasting and radar forecasts .......................................................................... 19
 4.5 Weather forecast rainfall..................................................................................... 20
 4.6 Hydrological (rainfall runoff) models ................................................................... 22
 4.7 Sea level dependant flow/rainfall thresholds ....................................................... 22
 4.8 Hydrodynamic modelling of flood levels .............................................................. 23
 4.9 Summary of identified forecasting options .......................................................... 23

5 Analysis of potential forecast lead time and accuracy .................................................. 24
 5.1 Analysis of gauge data ......................................................................................... 24
 5.2 Forecast rainfall .................................................................................................. 26

Westport - flood forecasting roadmap for evacuation warnings

5.3 Key findings from analysis of gauge data and forecast rainfall ............................. 31

6 Summary of possible modelling solutions .................................................................... 32

7 Conclusions and recommendations .............................................................................. 34
 7.1 Conclusion regarding the feasibility of developing a suitable flood forecasting
 system ................................................................................................................ 34
 7.2 Recommended forecast methodology ................................................................. 34
 7.3 Roadmap for implementing forecasting system................................................... 35
 7.4 Cost to implement forecasting roadmap ............................................................. 36
 7.5 Time to model implementation ........................................................................... 37

8 References.................................................................................................................... 38

Appendix A Forecast rainfall analysis...................................................................... 39

Appendix B Forecast rainfall events at station locations ........................................ 44

Tables
Table 3-1: Contingency table for computation of forecast performance metrics. 15
Table 3-2: Forecast accuracy grading based on POD and FAR scores. 15
Table 5-1: Summary of rainfall and flow during the largest floods recorded since 1986. 24
Table 5-2: Rainfall and runoff depths over a 48-hour period for the January 18th -19th 2017
 flood event. 30
Table 6-1: Summary of potential forecasting solutions and the applicability for Westport.
 33

Figures
Figure 2-1: Buller River catchment and flow recorders. 10
Figure 2-2: Location of rain gauges and flow recorders in the Buller River catchment. 13
Figure 4-1: Rainfall totals for the 24-hour period ending 0000 hrs NZST on 27 March 2019
 from NIWA’s new downscaling ensemble forecast system, NZENS. 21
Figure 4-2: Example plots of early Probability of Exceedance products derived from NZENS
 forecast data. 21
 3
Figure 5-1: Lower Buller flow and rain during the July 2012 7980 m /s flood. 25
Figure 5-2: Lower Buller flow and rain during the flood of 8-9 July 2018. 26
Figure 5-3: Observed and modelled rain rate histogram for Sirdar Creek, West Coast. 27
Figure 5-4: Performance diagram comparing hourly accumulations of rainfall with
 observations from exactly the same time. 28
Figure 5-5: Rainfall forecast time series versus observed data in 2017. 29
Figure 5-6: Rainfall and runoff depth for the Buller at Te Kuha catchment during the
 January 18th and 19th 2017 flood event. 30

 Westport - flood forecasting roadmap for evacuation warnings
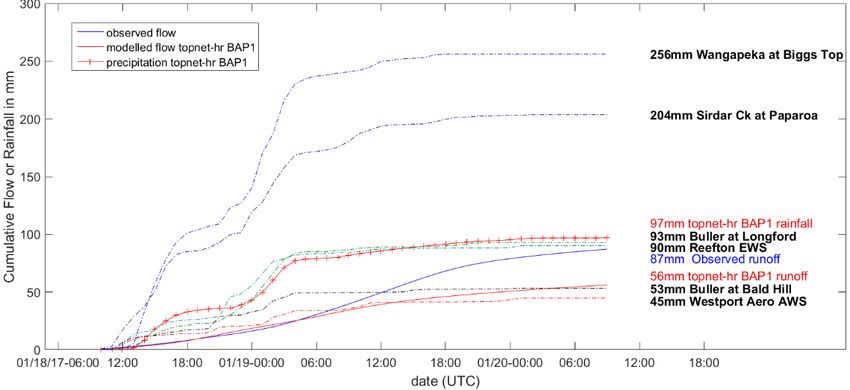
Figure 5-7: Rainfall and runoff depth for the Buller at Longford sub-catchment during the
 18-19 January 2017 flood event. 31

Figure A-1: Performance diagram comparing hourly accumulations of rainfall with
 observations anywhere within the 12-hour forecast verification window (see
 explanation of graph in Figure 5-4). 40
Figure A-2: Performance diagram comparing 3-hourly accumulations of rainfall with
 observations from exactly the same time (see explanation of graph in Figure
 5-4). 41
Figure A-3: Performance diagram comparing 3-hourly accumulations of rainfall with
 observations anywhere within the 12-hour forecast verification window (see
 explanation of graph in Figure 5-4). 41
Figure A-4: Performance diagram comparing 6-hourly accumulations of rainfall with
 observations from exactly the same time (see explanation of graph in Figure
 5-4). 42
Figure A-5: Performance diagram comparing 6-hourly accumulations of rainfall with
 observations anywhere within the 12-hour forecast verification window (see
 explanation of graph in Figure 5-4). 42
Figure A-6: Performance diagram comparing 12-hourly accumulations of rainfall with
 observations (see explanation of graph in Figure 5-4). 43
Figure B-1: Rainfall forecast time series versus observed data in 2014. 44
Figure B-2: Rainfall forecast time series versus observed data in 2015. 45
Figure B-3: Rainfall forecast time series versus observed data in 2016. 45

Westport - flood forecasting roadmap for evacuation warnings
Executive summary
A new integrated family health centre is to be built in Westport and, as Westport is vulnerable to
flooding, eight hours flood warning is required to enable patients to be moved safely if a flood large
enough to cause flooding of Westport is forecast. NIWA has received Envirolink funding to help West
Coast Regional Council explore this issue. This report explores the feasibility of implementing a flood-
forecasting system capable of provide accurate prediction of flooding with an 8-hour lead time. The
report investigates different options and provides details of a recommended solution, as well as costs
and a roadmap for implementation. The main conclusions are:

 ▪ A forecasting system could be created that will predict a flood at Westport eight hours
 in advance with enough accuracy to be used for triggering evacuations.

 ▪ The current hydrological network is adequate to inform a model, but a further
 telemetered rain gauge at Buckland Peaks would give more information on rainfall in
 the Paparoa range, an area of high importance for flood forecasting.

 ▪ The favoured modelling solution is a distributed, physically based hydrological model
 of the Buller River catchment driven by telemetered rain data from all rain gauges in
 and around the catchment as well as gridded rainfall forecasts to extend the forecast
 lead time. Telemetered flow records from throughout the catchment should be used
 for data assimilation to improve model accuracy.

 ▪ Flow thresholds for triggering flood warnings, especially for downstream areas of the
 city, should vary depending on forecast sea level (tide and storm surge). Accurate sea
 level forecasts are already produced by NIWA.

 ▪ The MetService rain radar at Hokitika could provide qualitative information on rainfall
 spatial variability, but due to its distance from the catchment the achievable accuracy
 of quantitative radar rain rate estimation is uncertain.

 ▪ It is recommended that the forecasting system should have a target accuracy of 70% or
 greater probability of detection (POD) and 30% or lower false alarm ratio (FAR).

 ▪ The estimated setup cost to implement the recommended forecasting roadmap is
 $55-90,000, with estimated annual costs of $10 - $35,000, not including WCRC staff
 time and maintenance of the gauge network (excluding GST).

 ▪ A backup to the base telemetry server, or other backups to the gauge network or
 telemetry system (if required) has not been costed.

 ▪ The flood warning system could be operational from 30 June 2020.

6 Westport - flood forecasting roadmap for evacuation warnings
1 Introduction
A new integrated family health centre is to be built in Westport and, as Westport is vulnerable to
flooding, eight hours flood warning is required to enable patients to be moved safely if a flood large
enough to cause flooding of Westport is forecast. This Envirolink funded report for the West Coast
Regional Council (WCRC) investigates whether a model can be created that will predict a flood eight
hours in advance and if not, what warning time could be expected. The report examines whether any
new hydrological sites are required to assist the modelling and advises on the most appropriate
modelling solution including what real time data can be used. The solution needs to be accurate and
robust to give confidence in its use, so the level of confidence in the model needs to be stated.

This report also provides the estimated cost to implement the solution, including any new
hydrological sites, if required, and recommends the type of model and the inputs necessary. WCRC
also require the costs of software, modelling and maintenance and advice on the time frame
between completing any hydrological sites and the implementation of the model. Thus, this report is
a roadmap of how to proceed with a flood warning system to give eight-hours’ notice rather than
providing a turn key solution. The report was funded by Envirolink medium advice grant C01X1831.

The report will be used by the WCRC to enable decision making around prioritising of work
programmes, and civil defence planning. Further, the report will be used by Westport 2100, a
community group, which will be convened in early 2019 to start the process of 100-year+ planning of
hazard mitigation in Westport.

1.1 Scope
The project addresses the following:

 ▪ Can a model be created that will predict a flood in the Buller River eight hours in
 advance? If not, what is the best-case warning timeframe that could be expected?

 ▪ What are the site build requirements including number of sites, location of sites, and
 composition of sensors?

 ▪ What is the most appropriate modelling solution (rainfall runoff, routing, forecast
 driven routing) not necessarily EcoConnect or NIWA tools but a review that proposes
 the best road map for WCRC? How could WCRC utilise gridded rainfall, radar, real time
 gauges, and a better calibrated catchment to predict flooding and display the
 predictions in a usable way linked to the telemetry network?

 ▪ What level of confidence is expected from the model or system – this will be used for
 evacuation purposes so needs to be accurate and robust;

 ▪ What is the potential cost to implement this solution (not a model but a road map for
 site numbers and locations, type of model and required inputs/costs/levels of
 reliability/accuracy) by 30 June 2020, including build costs, software, modelling and
 maintenance?

 ▪ Advice on timeframe between finishing sites and implementation of modelling.

1.2 Report structure
Following this introduction, Section 2 of the report reviews background information regarding the
level of flood hazard, sources of flooding, and existing monitoring and forecasting systems. Required

Westport - flood forecasting roadmap for evacuation warnings 7
forecast specifications are detailed in Section 3, and potential flood forecasting approaches are
identified in Section 4. Section 5 contains a detailed technical analysis of historic gauge data and
rainfall forecasts to better understand the achievable forecast lead time and accuracy. The purpose
of this analysis is to address the core question of whether it is feasible to provide the required lead
time and accuracy, as well as to investigate what the preferred approach should be.

Section 6 summarises the findings of sections 4 and 5 by tabulating the advantages and
disadvantages of different potential forecasting systems. Section 7 draws on this summary to provide
conclusions regarding the feasibility of forecasting, as well as recommendations for a forecasting
solution and a roadmap to implementation, including cost estimates.

8 Westport - flood forecasting roadmap for evacuation warnings
2 Background
2.1 Flood hazard for the integrated family health centre
Duncan and Bind (2014) used 2-dimensional hydrodynamic flood modelling to predict flood extents
and depths in Westport. They show that flooding would occur at the health centre site during a 1/50
annual exceedance probability (AEP) river flood, equating to 8920 m3/s peak flow (McKerchar 2004,
as revised in Duncan and Bind 2014) and 1.44 m peak sea level coinciding with the flood peak. 1.44 m
is the MHWS10 sea level (sea level exceeded by 10% of all tides). This combination of river flood and
tide produces flood hazards around the proposed health centre classified as “Low” (indicating
shallow flowing water or deep standing water indicating that able-bodied adults should proceed with
caution) or “Moderate” (indicating deep or fast flowing water dangerous for some, e.g., children).
However, at this combination of river flood and tide the roads around the health centre are classified
as having a “Significant” hazard that is dangerous for most people with deep, fast flowing water.

A more recent study by Gardiner (2017) who modelled several 1/50 AEP floods with differing bridge
blockage (State Highway 6 bridge over the Buller River) and climate change scenarios confirmed
Duncan and Bind’s (2014) findings. Gardiner (2017) concluded that the health centre site has a low
hazard rating with a large part of the property falling into the H1 category (i.e., is generally safe for
people, vehicles and buildings) for the 1/50 AEP event based on the current climate with the
surrounding streets in the H3 category (i.e., unsafe for vehicles, children and the elderly.)

For the design of a flood forecasting and warning system it is important to consider the ability to
safely evacuate people to lower risk locations, either to higher ground in Westport or away from
Westport via the Buller River Bridge to the west or the Orowaiti Estuary Bridge and causeway to the
east. Duncan and Bind (2014) show that the eastern approach to the Buller River Bridge is too deep
for safe vehicle passage for cars during floods greater than the 1/50 AEP flood and MHWS10 tide
although may be passable for heavy 4WD vehicles. The Orowaiti Estuary Bridge and causeway would
be passable for cars for the same flood and tide.

However, Duncan and Bind (2014) show that the roads between the health centre and the Orowaiti
Estuary Bridge have a significant hazard rating indicating deep fast flowing water for the 1/50 AEP
flood and MHWS10 tide level, whereas the 1/20 AEP flood (7800 m3/s, 20year ARI) and MHWS10 tide
level show only low and moderate hazard on those roads.

The health centre, along with the rest of Westport, will be flooded during extreme floods (1/50 AEP)
and the frequency and magnitude of floods will increase with climate change and sea-level rise.
There are however low flood risk areas to the east and west of the town which could provide a
suitable alternative location for the health centre, thus eliminating the flood risk to the centre and its
patients.

In summary, the critical issue for evacuation from the health centre is the flood hazard on the roads
between the health centre and the Orowaiti Estuary Bridge. Thus, a prudent flood trigger level would
be about 8400 m3/s (~1/35 AEP), with consideration of the flood peak timing (flood peak and high
tide coinciding) and level of the tide peak (including storm surge) to determine whether a flood
warning should be issued.

2.2 Buller River flood sources
The Buller has a large catchment (6500 km2), with much of the upper catchment in Tasman District
(Figure 2-1). A significant proportion of the flood peak is known to originate in the lower Buller
catchment, from catchments immediately to the east of the Paparoa and Mt William Ranges (Horrell

Westport - flood forecasting roadmap for evacuation warnings 9
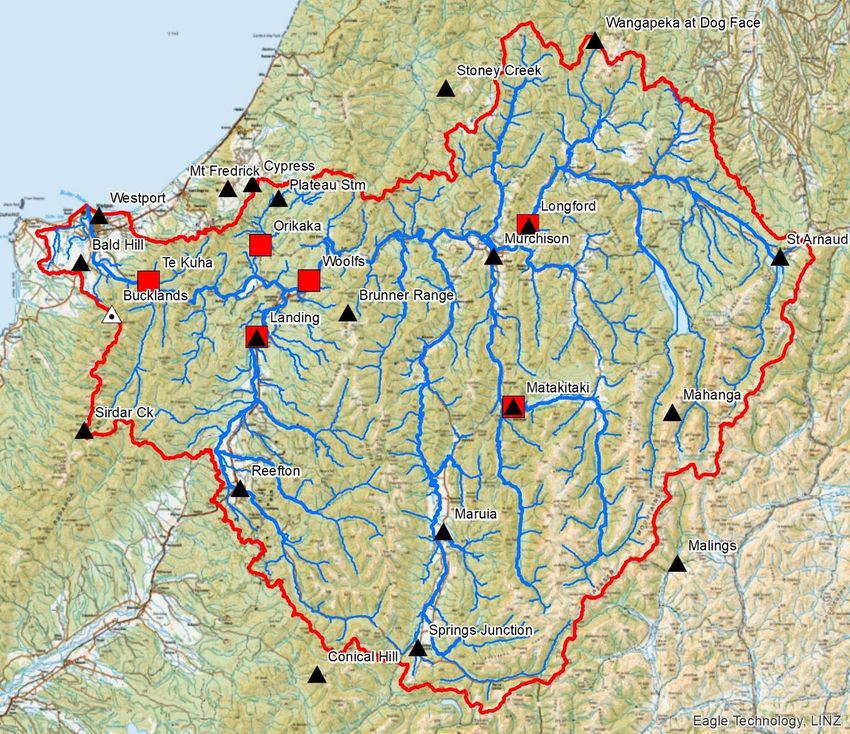
and Henderson 2012). These lower catchments only make up 15% of the total basin area but
experience high rainfalls and there is relatively little time between rain falling in these ranges and
flood peaks arriving at Westport, so forecasting flows derived from these catchments is particularly
challenging (Duncan and Bind 2014). The larger rivers draining into the Buller River from the Paparoa
and Mt William Ranges are the Ohikanui and Blackwater Rivers from the south and Mackley (Orikaka)
River and Cascade Creek from the north.

The flow contribution from the upper Buller catchment, from upstream of the Buller at Woolfs flow
recorder, has a greater travel time so should be easier to forecast. The Inangahua catchment is
quicker responding than the upper Buller catchment, but has greater travel time than the Paparoa
Range/Mt William range rivers.

Further analysis of the relative flow contribution and travel time from different parts of the
catchment is contained in Section 5.1: Analysis of gauge data.

 Buller

 Buller

Figure 2-1: Buller River catchment and flow recorders. Coloured regions show the sub-catchment upstream
of each flow recorder. Areas are given (in km 2) for each coloured region.

Modelling by Duncan and Bind (2014) shows that storm surge and tide timing do have an impact on
flood severity in Westport, although the primary driver of flooding for most areas is peak flow in the
Buller River. The effect of tides/surge on flooding should be considered by any forecasting system.

10 Westport - flood forecasting roadmap for evacuation warnings
2.3 Current flood warning for Westport
The current flood warning system for Westport is based on the water level on the Buller River at Te
Kuha about 13.5 km upstream of Westport and 1-1.5 hours flood wave travel time. A water level of
7.5 m (~3000 m3/s) triggers an alert, when a watch is kept on water levels and flows at the Buller
River at Te Kuha, Buller at Woolfs, and the Inangahua River at Landing water level recording sites.
Flood warnings are based on the water levels at those sites, rainfall at Sirdar Creek at Paparoa,
forecast rainfall, tide levels and the synoptic weather situation. The Sirdar Creek telemetered rain
gauge is near the headwaters of the Ohikanui River which is a major contributor to Buller River flood
peaks. Flood warnings are issued only if, in the judgement of WCRC and Buller District Council staff,
the above factors indicate a warning is required (Duncan and Bind 2014).

2.4 Existing NIWA flow and tide forecasting systems for Westport
NIWA operates an environmental forecasting system that includes weather, river flow, sea level and
sea state hazard forecasting called EcoConnect (Uddstrom 2011). Flow forecasting for the Buller
River at Longford and the Buller River at Te Kuha, as well as sea level forecasting for Westport
(combined astronomic tide and storm surge) are currently part of EcoConnect and available to WCRC
(Cattoën et al. 2016c, Duncan and Bind 2014).

Flow forecasts start 48 hours ahead which gives enough notice of extreme events to allow residents
to arrange an evacuation if necessary. Forecasts are updated every six hours and normally get more
accurate in timing and magnitude of the flood peak as the forecasts get closer in time to the forecast
peak (best range is 6-12 hours lead time). The flow forecasts assimilate the current instantaneous
flow rate at each update. That is, the model state (soil moisture levels, etc.) and flow forecast are
adjusted every six hours to reflect the current flow, making forecast initial conditions more accurate
(Cattoën et al. 2016c; McMillan et al. 2013).

The Buller River EcoConnect flow forecasts use a TopNet hydrological model based on Strahler order
3 river/catchment data from the River Environment Classification version 2 (REC2) dataset
(approximately 5-7 km river length of model resolution and about 10 km2 sub-basin resolution, see
NIWA 2019 for details of the REC2). The hydrological model simulates flow based on forecast rainfall
from NIWA’s NZCSM high resolution weather model. Verification showed that forecast flood peaks,
using the current operational model in EcoConnect for a 4300 m3/s flood at Te Kuha, were within
10% of the observed peak at a range of forecast lead times (Duncan and Bind 2014).

EcoConnect tide and storm surge forecasts for Westport are based on hydrodynamic modelling of
storm surge driven by forecast weather (wind and pressure) data. While no assessment of forecast
accuracy at Westport has been made directly (due to the influence of river flows on sea level),
forecast accuracy was found to be good for the Charleston sea level recorder, approximately 25 km
south of the Buller River mouth (RMSE = 0.04m, Lane et al. 2009), and is expected to be very similar
for Westport.

2.5 Hydrological monitoring
A map of the Buller River catchment showing the location of key hydrometric monitoring stations is
shown in Figure 2-2. As parts of the upper catchment lie in Tasman District and border Canterbury,
sites maintained by Tasman District Council and Environment Canterbury are included on this figure
as well as sites maintained by WCRC and NIWA. All the operational sites marked have telemetered
near-real time data available and could be valuable for inclusion in a flood forecasting system. We
have assumed that WCRC would be able to negotiate access to data from all the marked sites for the
purposes of flood forecasting (if it is not already available).

Westport - flood forecasting roadmap for evacuation warnings 11
The adequacy of monitoring in the lower Buller River is of particular importance for flood forecasting
because, as established in Section 2.2, this area contributes significantly to flood flows. There are
several well-established stations in the lower Buller catchment of relevance for flood forecasting:

 ▪ The NIWA Buller at Te Kuha flow recorder provides the best measure of flood flows
 arriving into Westport. Its usefulness for flood forecasting is limited due to the short
 travel time from the site to Westport, but it is incredibly valuable for calibrating and
 validating potential forecasting systems. The site opened in July 1963.

 ▪ The WCRC Buller River at Woolfs and Inangahua at Landing flow recorders provide
 valuable data on flow arriving from the upper catchment. These sites opened in 1983.

 ▪ The WCRC Sirdar Creek at Paparoa rain gauge is well positioned to monitor rainfall in
 the Paparoa range at the head of the Ohikanui catchment. The rainfall record started
 9 April 1986.

Horrell and Henderson (2012) and Duncan and Bind (2014) reviewed hydrometric monitoring and
suggested continued monitoring of existing sites and the following additional sites:

 ▪ A telemetered water level recorder on the Ohikanui River.

 ▪ Installation of telemetered rain gauges in the Cascade Creek and Orikaka River
 catchments.

Following recommendations, recent improvements by WCRC include:

 ▪ New telemetered rain gauges have been installed at Orikaka at Plateaux Stream
 (commenced 27 June 2018) and Orikaka at Gorge (28 June 2018) in the Orikaka
 (Mackley) River catchment, and on the Brunner Range (commenced 9 February 2017);

 ▪ A water level recorder has been installed on the Orikaka River at Gorge and records
 started 28 June 2018.

However, the Ohikanui River water level has not proceeded because of lack of a suitable site and
because backwater caused by the Buller River affects flow a long way upstream.

With the additional recently installed sites, coverage in the lower catchment is likely adequate for
flood forecasting, however the northern part of the Paparoa Range represents a bit of a gap in the
raingauge network. We have identified one potential additional raingauge site in the lower
catchment at Buckland Peaks. This site would provide information on rainfall in the Northern half of
the Paparoa Range, reducing forecast uncertainties due to rainfall variability between Sirdar Creek
and the northern part of the range.

12 Westport - flood forecasting roadmap for evacuation warnings
Figure 2-2: Location of rain gauges and flow recorders in the Buller River catchment. Operational rain
gauges are marked by black triangles, operational flow recorders by red squares and potential additional rain
gauge by open triangle. Note that the sites marked include WCRC, Tasman District Council, NIWA, and
Environment Canterbury maintained sites.

2.6 Backup systems
Given that flood forecasting models rely on data from the water-level and rainfall recorders, it would
be worthwhile considering duplicate systems to provide redundancy in flood situations:

 ▪ Is the distribution of rain gauges such that if one fails the forecast will not be
 compromised? Any model needs to be tested to determine the effect on model
 accuracy, if any of the rain gauges or water-level recorders fail. Depending on the
 results of the tests, duplicate systems may be required.

 ▪ If rain gauges are key, then should there be redundant rain gauges nearby? An
 additional rain gauge near the Sirdar Creek at Paparoa rain gauge should be considered
 given its likely importance to any flood forecasting system.

 ▪ There needs to be a system that keeps watch on the telemetry system to warn if data
 are no longer being received. An automatic backup is essential if the data are coupled
 to a rainfall-runoff model.

Westport - flood forecasting roadmap for evacuation warnings 13
▪ There is a need to look at the performance of each site to see how reliable it is during
 storms. Any unreliable site should be duplicated or have duplicate sensors and/ or
 telemetry systems depending on the nature of the failure.

2.7 Key components for the flood forecasting roadmap
 ▪ The critical issue for evacuation from the health centre is the flood hazard on the roads
 between the health centre and the Orowaiti Estuary Bridge. A prudent flood trigger
 level would be about 8400 m3/s (~35-year ARI).

 ▪ For most large floods a significant proportion of the peak flows originate from
 catchments immediately to the east of the Paparoa and Mt William Ranges.

 ▪ Current flood warning comes from the water level at Te Kuha (1-1.5 hours travel time
 to Westport) and the Sirdar Creek at Paparoa rain gauge.

 ▪ The current rainfall and water level recorder networks are adequate for informing
 flood models, but a new gauge at Buckland peaks would improve information on the
 spatial variability of rainfall across the Paparoa Range.

 ▪ An automatic backup for the telemetry server, analysis of data reliability during storms
 and duplicate systems for critical sensors/telemetry are recommended to increase
 reliability.

14 Westport - flood forecasting roadmap for evacuation warnings
3 Required forecast specifications
Flood forecasts need to be accurate, reliable and provide enough lead time for action.

3.1 Forecast accuracy
Flood forecast accuracy refers to how well the forecast flooding corresponds to the actual flooding.
There are many different metrics which can be used to assess the performance of a flood forecasting
system (Hawkes and Whitlow 2005). Some of the most useful metrics for specifying target forecast
requirements are False Alarm Ratio (FAR) and Probability of Detection (POD). Both metrics are
calculated based on statistics of how well the forecasting system predicts whether key flood warning
thresholds are crossed. FAR is defined as the proportion of flood warnings issued for which flooding
did not occur, whereas POD is the proportion of actual flood events for which flood warnings were
correctly issued. These metrics are calculated from the ‘contingency table’ (Table 3-1) using
equations (1) and (2).

Table 3-1: Contingency table for computation of forecast performance metrics.

 Threshold forecast Flooding observed

 Yes No

 Yes a (hit) b (false alarm)

 No c (miss) d (correct)

 = (1)
 +

 = (2)
 +

The subtleties of how POD and FAR are calculated from multiple forecasts issued at different times,
when considering different lead times, can significantly influence the calculated scores. Further
guidance on these details is provided in Robson et al. (2017).

Typical specifications for flood forecasting accuracy require, as an absolute minimum standard, that
POD is greater than 0.5, and FAR is less than 0.5 (Hawkes and Whitlow 2005). A useful guide to
interpreting forecast performance is given by Robson et al. (2017) and is reproduced in Table 3-2.

Table 3-2: Forecast accuracy grading based on POD and FAR scores. Reproduced from Table 6.1 Robson et
al. 2017. Note, the final grade is defined as the best that can be achieved by both the POD and FAR scores; that
is, the worse of the two individual grades.

 Grade Description POD FAR
 1 Exceeds target POD ≥ 0.8 FAR ≤ 0.2
 2 Meets target 0.8 > POD ≥ 0.7 0.2 < FAR ≤ 0.3
 3 Meets target with tolerance POD (with tolerance) ≥ 0.7 FAR (with tolerance) ≤ 0.3
 4 Does not meet target 0.7 > POD ≥ 0.5 0.3 < FAR ≤ 0.5
 5 Significantly below target 0.5 > POD ≥ 0.3 0.5 < FAR ≤ 0.7
 6 Poor POD < 0.3 FAR > 0.7

Westport - flood forecasting roadmap for evacuation warnings 15
The threshold flood flows for triggering evacuation of the health centre should only be exceeded
infrequently (35-year ARI flood event, see Section 2.1), and during development of a forecasting
system it is only possible to assess accuracy over the period for which data are available to generate
hindcasts. As any forecasting system will likely rely on data from recently installed rain gauges, some
installed as recently as June 2018 (see section 2.5) it will not be possible to generate meaningful
accuracy statistics for the actual warning threshold. Instead a lower forecast threshold will have to be
used for assessing model performance.

It is recommended that a flood forecast for Westport should be considered acceptable if it achieves a
POD greater than 0.7 and FAR less than 0.3 for floods exceeding a flow threshold set such that
approximately 10 measured floods exceed the threshold over the full period for which it is possible
to assess model performance.

3.2 Forecast reliability
Forecast reliability is independent from its accuracy and refers to the forecast’s ability to continue to
operate effectively, even during severe weather or flooding. Any flood forecasting system developed
for the Buller River needs to be robust to potential failures in the gauging, communication or power
networks.

One way of quantifying reliability retrospectively is to calculate the proportion of forecasts for which
the forecasting system was working effectively (Hawkes and Whitlow 2005).

 = 1 − (3)

where ‘Number of forecasting failures’ counts the number of occasions when a forecast could not be
made for whatever reason; and ‘Total number of forecasts’ is the total number of forecasts that
would have been made over the same period if no forecasting failure had occurred.

As modes of forecast failure are often linked to weather and flooding it is likely better to focus on
critical forecasts when considering the above statistic, for example by only including periods with two
days of a specific high flow threshold being exceeded.

A retrospective analysis of reliability of different parts of the forecasting system could be undertaken
to identify potential vulnerabilities. For example, if specific rain gauges were essential for the
forecast operation then an analysis of historic reliability of real time data from a set of similar gauges
could be undertaken to investigate the frequency and duration of failures. Typical targets for
monitoring station (flow and rain gauge) reliability are:

 “not more than 1.5 % (approx. 5 days) missing record in any twelve-month period
 and, for any station, not more than one calendar year in two shall have any
 missing record.” (Appendix A in Fenwick 2014)
The potential need for backup systems to be incorporated into the gauging network was discussed in
Section 2.6.

3.3 Forecast lead time
Lead time refers to the amount of time between a flood warning being issued and the onset of
flooding. Assessment of forecast lead time should assess the sum of all the different cumulative
delays present in the forecasting system. Depending on the system this may include:

 ▪ Reporting frequency/latency of telemetered rain and river level gauges.

16 Westport - flood forecasting roadmap for evacuation warnings
▪ Frequency of updates to weather forecast models, including the time taken for the
 models to process and results to become available.

 ▪ Time taken for hydrological/hydraulic forecasting models to run and the frequency
 with which model runs are carried out.

 ▪ Lead time provided by the forecasting model.

 ▪ Time taken for staff to interpret forecasts and decide whether to issue a warning.

 ▪ Time taken for flood warning to be communicated to recipients.

It is notable that the lead time provided by the forecasting model likely involves a compromise
between accuracy and timeliness, as forecast accuracy is often higher at short lead times.

The required forecast lead time for the Westport health centre specified by WCRC is 8 hours. To be
effective the forecast needs to achieve enough accuracy at this lead time. As forecast accuracy is best
measured at the Te Kuha flow recorder, approximately 1 to 1.5 hours travel time upstream of
Westport (see Section 2.3), 7 hours lead time is required for a flow forecast at Te Kuha.

3.4 Summary of forecast specifications
 ▪ Flood forecasts need to be reliable, accurate and provide enough lead time.

 ▪ Reliability can be calculated retrospectively from the proportion of forecasts for which
 the forecasting system was working effectively.

 ▪ Accuracy can be calculated from forecast performance metrics to provide a False
 Alarm Ratio (FAR) and Probability of Detection (POD). We recommend that a flood
 forecast for Westport should be considered acceptable if it achieves a POD greater
 than 0.7 and FAR less than 0.3 for floods exceeding a flow threshold.

 ▪ Lead time is the time between when a warning is issued and the onset of flooding, thus
 its assessment needs to include consideration of all sources of delay, such as latency of
 telemetry systems and time for forecaster decision making. WCRC have specified that
 eight hours lead time is required at Westport.

Westport - flood forecasting roadmap for evacuation warnings 17
4 Potential flood forecasting approaches
In general, river floods can be forecast for a specific location in several different ways. The following
sections give a brief overview of typical forecasting approaches and a discussion of their suitability
for application to Westport.

4.1 Observed upstream flow/level
The most simple and reliable approach for flood forecasting is to use observed data from upstream
flow/level recorders to trigger flood warnings. WCRC currently use this approach to generate flood
alerts based on observed flows from the Buller at Te Kuha flow recorder. The disadvantage of this
approach is that forecast lead time is limited to the travel time from the upstream recorder, in this
case approximately 1 to 1.5 hours, significantly less than the desired lead time of 8 hours. Other flow
recorders exist further upstream including Buller at Woolfs, and Inangahua River at Landing which
could be used to provide accurate forecasts of flow from these parts of the catchments. However, on
their own these gauges cannot be used to forecast flooding in Westport because, as described in
section 2.2, the lower Buller flow peaks (which cause flooding in Westport) generally originate from
catchments downstream of these recorders and often peak prior to these upstream recorders.

The travel time from Woolfs to Te Kuha is approximately 2.5 to 3 hours based on analysis of
hydrographs. The travel time from Inangahua at Landing to Te Kuha is longer and varies depending
on storm direction. Typically Landing peaks many hours before Woolfs and the flood peaks recorded
at Landing are on average 0.46 the size of those recorded at Woolfs.

4.2 Rainfall thresholds
Rainfall thresholds can be used to trigger flood warnings based on rainfall data, for example if rainfall
total exceeds 110 mm in 6 hours a flood warning could be issued. By using observed rainfall rather
than flow it is possible to extend lead time. If accurate forecast rainfall data is available (see sections
4.4, 4.5 and 5.2) lead time can be extended much further than when only using observed rainfall
data. Whilst this approach has been used effectively in many catchments it neglects factors such as
the influence of antecedent catchment wetness or spatial/temporal variability in rainfall on flood
peak flow. These limitations mean it generally works best in small flashy catchments which respond
to short duration high intensity rainfall. For larger catchments with longer time of concentration and
multiple sub-catchments or significant influence of antecedent wetness (i.e., the Buller), these
weaknesses can reduce forecast reliability.

It is possible to develop rainfall thresholds which vary depending on antecedent catchment wetness
(for example a second (lower) threshold is used if the catchment has received more than 50 mm in
the 48 hours prior to the current event). However, with a catchment as complex as the Buller it is
likely to be challenging to develop accurate variable thresholds due to spatial differences across the
catchment.

For Westport it is our opinion that, while simple rainfall thresholds such as that given above can
provide a “heads up” notice of potential extreme floods, they will not provide enough reliability for
an evacuation warning because of differences in rainfall response between events caused by
antecedent conditions and the spatial-temporal distribution of rainfall across the catchment.

18 Westport - flood forecasting roadmap for evacuation warnings
4.3 Rainfall radar
Rainfall radar resolves the spatial variability of rainfall processes and can therefore be an effective
alternative to rain gauge measurements. Rainfall radar is available for the lower Buller catchment
from the MetService radar 6-7 km SE of Hokitika situated at an altitude of 351 m.

The coverage over the Paparoa Range and up to the Mt William range is good, but there is
attenuation in the lowest radar beam by hills at the southern end of the Paparoa Range. The beam is
not completely blocked over the Paparoa Range, so precipitation is still able to be seen and there is
useful radar data over the Paparoa Range and beyond (Chris Noble, Manager Severe Weather
Services, NZ MetService, pers. comm.).

Rainfall estimation from radar (i.e., using a Quantitative Precipitation Estimate (QPE) scheme to
convert radar reflectivity to rainfall), is best within 120 km of the radar itself – at that range the
lowest beam is near 2 km high (plus the height of the radar itself), so will be starting to overshoot
lower level precipitation (especially at distances farther from the radar). The closest part of the
Paparoa Range is approximately 90 km from the radar, Westport is about the 120 km, and Mt
William about 130 km. (Chris Noble, Manager Severe Weather Services, NZ MetService, pers.
comm.).

There are some emerging methods with dual-polarised radars (such as the Westland radar) which
could be used to minimise the impact of beam blocking. However, the Westland radar is C-band. This
means there will be attenuation limitations in heavy, widespread rain and when there is localised
heavy rain directly over the radar site.

4.4 Nowcasting and radar forecasts
Post-processing methods can be used to extend the operational usefulness of radar observations to
provide more timely warnings with short response times. Consultancies such as Weather Radar New
Zealand Ltd1 have previously worked with regional council and MetService radar datasets to provide
Quantitative Precipitation Forecasts (QPF) for radar nowcasting and rainfall-runoff models targeted
at flood forecasting (Sutherland-Stacey et al. 2011; Sutherland-Stacey et al. 2016; Sutherland-Stacey
et al. 2019).

Radar nowcast QPF are generated using the Short-Term Ensemble Precipitation System (STEPS)
(Bowler et al. 2007) to provide ensemble estimates of possible rainfall distribution over the 2-6 hour
period following the most recent radar data. This would extend the lead time beyond what could be
achieved using observed rainfall only. The frequency of updates can be as short as radar updates
(e.g., every 10 minutes with only a few minutes of latency). These ensemble rainfall forecasts are
typically based initially on advected radar rainfall observations that are gradually blended with a
Numerical Weather Prediction (NWP) model to extend the rainfall predictions a few hours into the
future.

The Bureau of Meteorology of Australia have implemented the use of radar-based ensemble rainfall
forecasts to provide enhanced flood forecast and warnings in Australia (Velasco-Forero et al. 2019).
Overall STEPS ensemble rainfall skill (performance) is better than NWP rainfall forecasts for the first 2
to 3 hours and then comparable to the NWP skill for larger lead times. From an operational
perspective, STEPS has the key advantage to provide updated ensemble of rainfall forecasts to flood
forecasters every few minutes. However, when small time intervals are used it can lead the forecast
to have overlapping rainfall bands.

1 http://www.weatherradar.co.nz/home

Westport - flood forecasting roadmap for evacuation warnings 19
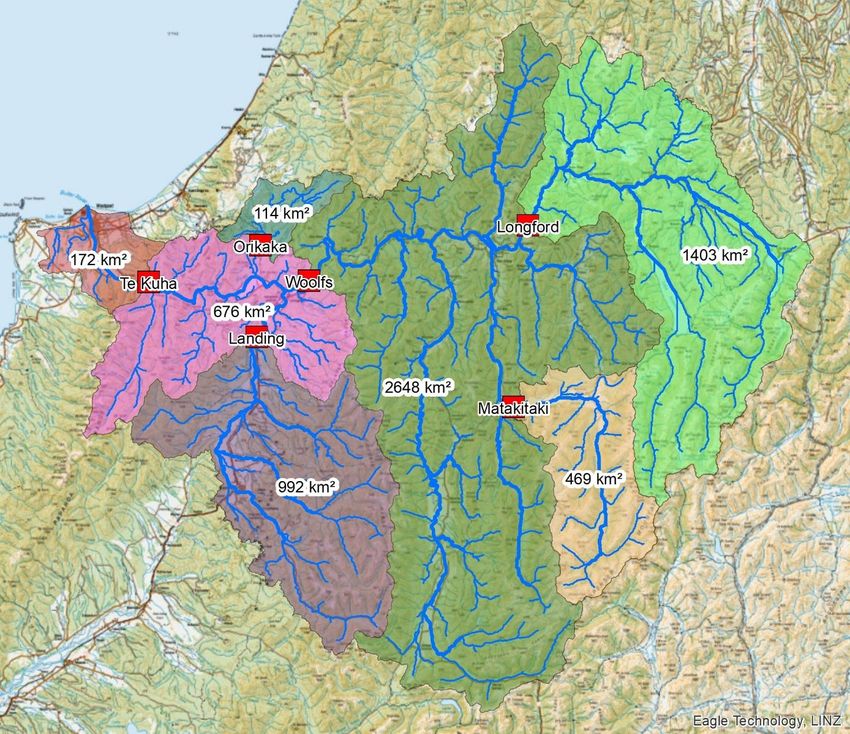
A first step for WCRC could involve contracting a suitable provider to assess the performance and
limitations of the existing MetService radar system for the Buller catchment by analysing the
complete radar archive to date (Sutherland-Stacey et al. 2017). A second step based on a suitable
contractor’s advice could be to consider further radar hardware such as mobile high-resolution
radars being developed and researched at Weather Radar NZ (Sutherland-Stacey et al. 2011;
Sutherland-Stacey et al. 2018).

4.5 Weather forecast rainfall
Rainfall forecasts from numerical weather models can be used to extend forecast lead times by
accounting for future rain that has not yet fallen.

Rain forecast patterns from a high-resolution weather model (1.5 km) provide more accurate
distributed information than large scale weather models (greater than 5 km resolution) (Cattoën et
al. 2016c). The convection-permitting nature of a high-resolution weather model and its better
orographic representation are key to representing localised storms more accurately over steep and
high ground (Cattoën et al. 2016c).

As part of its multi-hazard forecasting tool EcoConnect, NIWA operationally runs such a high-
resolution weather model called NZCSM (New Zealand Convective Scale Model). The weather
forecast provides updated gridded rainfall forecast every 6 hours out to 48-hour lead times. Rainfall
values can be provided half hourly, hourly and for specific station locations with model output
statistics corrections (Carey-Smith 2018).

However, although NZCSM is the highest resolution model running operationally in New Zealand, its
1.5 km resolution still causes substantial smoothing of the steep slopes common in New Zealand
mountains. Therefore, orographic rainfall is likely to be underestimated in some cases, including in
the Buller catchment. Weather forecast models are also well known to underestimate heavy rainfall
and overestimate light rainfall or drizzle (Blacutt et al. 2015; Cattoën et al. 2016a; Cattoën et al.
2016b; Cattoën et al. 2016c; Helmis and Nastos 2012; Shroder et al. 2007), even when annual totals
are approximately correct, and often require bias correction before use in a rainfall-runoff model
(Cattoën et al. 2016b; Cattoën et al. 2018). In June 2017, NIWA upgraded NZCSM by implementing a
new dynamical core for seamless atmospheric prediction called ENDgame. This addition improves
explicit gravity wave representation and aids in atmospheric forecasting of orographic rain in fast
moving extreme events.

NZCSM is a deterministic model i.e., it simulates a single best estimate forecast of future weather
with no consideration of uncertainty. Ensemble modelling involves simulation of multiple possible
future weather scenarios (ensemble members), capturing potential uncertainty and allowing better
forecasting of extreme events. NIWA is currently testing a new operational weather ensemble
implementation NZENS, which simulates 18 members out to 2.5 days at 4.5 km resolution over New
Zealand (Figure 4-1). An ensemble of weather models should significantly improve forecast accuracy
in terms of spatial and temporal rainfall distribution during extreme events. An example of the
development of “probability of exceedance” forecasts of hourly (or daily) rainfall totals exceeding
some defined threshold are defined in Figure 4-2. It is expected that the new ensemble forecast
capability will be available in EcoConnect within the next financial year (2020).

20 Westport - flood forecasting roadmap for evacuation warnings
Figure 4-1: Rainfall totals for the 24-hour period ending 0000 hrs NZST on 27 March 2019 from NIWA’s new
downscaling ensemble forecast system, NZENS. This rainfall event broke several national rainfall records,
notably on the Cropp River (near Hokitika) where 1086mm of rain fell in 48 hours.

Figure 4-2: Example plots of early Probability of Exceedance products derived from NZENS forecast data.
The top row shows probabilities of rainfall in the hour up to 0800 NZST on 6 April 2019, exceeding three
predefined thresholds. The bottom row shows exceedance probabilities for winds speeds. Probabilities are
calculated from all available NZENS members.

Westport - flood forecasting roadmap for evacuation warnings 21
4.6 Hydrological (rainfall runoff) models
Hydrological models generate predictions of river flow based on rainfall data. Hydrological models
are typically calibrated to observed flow data at a downstream flow recorder. They are much better
able to capture the effects of antecedent catchment wetness and spatial/temporal variability in
rainfall as it moves across a catchment compared to simple rainfall thresholds.

As with rainfall thresholds, the lead time provided by hydrological models depends on the source of
rainfall data. Using observed rain data, forecast lead time is limited to the travel time from the upper
catchment. The Sirdar Creek at Paparoa rain gauge is well sited to represent rain falling in the
Ohikanui River catchment which generates a large part of the flood peaks observed at Westport. The
gauge has been in place since 1986 so there is good data availability to calibrate a hydrological model
for this catchment.

Hydrological modelling based on rainfall observed at the Sirdar Creek at Paparoa rain gauge and
observed river flows could possibly provide 8-12 hours flood warning for Westport for floods from
this source. Utilising forecasts of future rainfall could allow much longer lead times but introduces an
additional source of uncertainty. This is discussed further in section 5.2.

There are many potential hydrological models which could be applied for forecasting in the Buller
catchment. Models can be grouped into empirical black box models, lumped conceptual models, or
distributed physically based models (Refsgaard and Knudsen 1996). Empirical models do not explicitly
incorporate physical processes but instead rely on being fitted to long periods of observational data.
As such they are not necessarily reliable outside the range of parameters for which they have been
calibrated. This means they are not appropriate for predicting larger, infrequent floods in the
complex Buller catchment where rainfall data are available for few floods of the severity which is
desired to be forecast (approximately 1/35 AEP, see section 2.1). The Buller catchment covers a large
area with high vertical relief, and spatially varying rainfall patterns and hydrological response. This
complexity means that distributed physically based modelling is likely required to accurately predict
flows. The resolution of such models needs to be high enough to adequately capture the spatial
variability in rainfall and topography within the catchment. Based on our experience of hydrological
modelling in West Coast catchments, it is our opinion that the model will require a sub-basin
resolution of between approximately 10 km2 (Strahler order 3 in the REC2 river network, NIWA 2019)
and 1 km2 (Strahler order 1 in the REC2 river network, NIWA 2019). Many different distributed
physically based models are available. Distributed hydrological models applied within New Zealand
include TopNet and MIKE SHE.

Cattoën et al. 2016c noted that long term water inflows and outflows did not balance in the Buller
catchment when calibrating a hydrological model to rainfall station data (for example Sirdar Creek
station). However, this may not be a major issue for a calibration only focused on large flood events,
provided different sources of rainfall data are consistent (i.e., no biases between rain gauge and
forecast rainfall if both are being used).

4.7 Sea level dependant flow/rainfall thresholds
Reliable sea level forecasts including the effects of tide and storm surge are already available for
Westport (see Section 2.4). As flooding from the Buller River is influenced by backwater effect from
the sea, the high tide level and tide timing with respect to flood peak arrival time are important to
include in any flood forecasting system. The simplest way to explicitly include sea level is to make the
flow threshold for triggering flood warnings dependant on the forecast sea level. Hydro-dynamic

22 Westport - flood forecasting roadmap for evacuation warnings
modelling using the existing flood mapping model (Gardner 2017) could be used to derive
appropriate thresholds for different sea levels.

A further potential development of this approach is to forecast flood levels in Westport, or flood
inundation, based on an interpolation of results from previously computed hydrodynamic
simulations for a range of peak flow / sea level scenarios (Chiaverini et al. 2016).

4.8 Hydrodynamic modelling of flood levels
Incorporating a hydrodynamic model into the forecasting system to simulate the interaction of flows
and tides would enable forecasting of flood levels on the Buller River in Westport. This would allow
the use of flood level thresholds (rather than flow thresholds) for the triggering of flood warnings.
The model would explicitly simulate the combined effect of forecast river flow and sea level
timeseries, allowing a more accurate prediction of the resulting flood severity.

A simple 1D hydrodynamic model (rather than the existing 2D flood mapping model) would be
required to ensure the model was fast and reliable enough to run as part of the operational
forecasting system. The model would likely need to extend from Te Kuha to the coast and include the
Orowaiti Estuary. Utilising a hydrodynamic model would only be possible with a flow forecast derived
from a hydrological model, as simple rainfall threshold approaches would not predict a timeseries of
river flow, required for input into a hydrodynamic model.

4.9 Summary of identified forecasting options
Potential forecasting options include:

 ▪ Comparing observed upstream flows against a threshold.

 ▪ Comparing observed rainfalls against an intensity/duration threshold based on the
 catchment time of concentration.

 ▪ Using rainfall radar over the catchment to estimate the spatial distribution of rainfall
 intensity over the lower part of the Buller catchment.

 ▪ Using nowcasting and radar forecasts to predict rainfall intensity across the catchment
 for the next 2-6 hours.

 ▪ Using forecast rainfall from numerical weather models to predict rainfall intensities at
 longer lead times.

 ▪ Using hydrological models to predict river flow from rainfall. Hydrological modelling
 could be combined with rain data from gauges, radar, or weather forecasts.

 ▪ Developing sea level dependant flow/rainfall thresholds to include the effect of sea
 level on river flooding.

 ▪ Using a 1D hydrodynamic model to predict flood levels on the Buller River in Westport
 from forecast flows and sea levels.

A more detailed analysis of some potential elements of the Westport forecasting system, and how
they influence forecast lead time and accuracy, is contained in Section 5. The advantages and
disadvantages of all the forecasting options are then summarised in Section 6, including conclusions
on their usefulness for Westport. Based on that summary, Section 7.2 details a recommended
forecasting methodology.

Westport - flood forecasting roadmap for evacuation warnings 23
5 Analysis of potential forecast lead time and accuracy
5.1 Analysis of gauge data
5.1.1 Calculated time of travel
The Sirdar Creek rain gauge is at the head of the Ohikanui River catchment. Duncan and Bind (2014)
calculated that the time of concentration (the time from rain falling at the head of the catchment to
river response at the bottom of the catchment) for the Ohikanui River was 2.5 hours. This calculation
was based on the Ramser – Kirpich method of estimating time of concentration from catchment
parameters. Including the travel time along the Buller River from the Ohikanui confluence past Te
Kuha to Westport gives a total travel time from the Sirdar Creek rain gauge to Westport of
approximately 3.5-4 hours.

5.1.2 Analysis of historic floods
Concurrent data from the Sirdar Creek at Paparoa rain gauge and the Te Kuha, Woolfs and Landing
flow sites are available from April 1986. The ten largest floods during this period were analysed to
investigate:

 ▪ The rainfall recorded at Sirdar Creek prior to each event.

 ▪ The relative contribution of the catchments upstream of Woolfs and Landing flow
 recorders, as well as the 790 km2 catchment between those recorders and Te Kuha.

 ▪ The time between flow peaking at Woolfs/Landing and the flow peaking at Te Kuha.

 ▪ The time between rain falling at Sirdar Creek and flood peak at Te Kuha.

Table 5-1: Summary of rainfall and flow during the largest floods recorded since 1986.For simplicity all
analysis is based on hourly mean flow and hourly total rainfall accumulation data.

 Peak flow (hourly average) Sirdar Creek peak rainfall accumulation
 Te Kuha Woolfs Landing Residual* 48 hour 24 hour 3 hour 1 hour
 Date (m3/s) (% of Te Kuha peak, hours lead time†) (mm, hours lead time‡)
15-Jul-2012 7907 52% (0) 21% (3) 31% 348 (0) 242 (4) 50 (8) 19 (10)
13-Jun-1993 7740 44% (3) 22% (3) 34% 214 (0) 156 (0) 36 (2) 20 (2)
20-May-1988 7765 65% (4) 32% (11) 16% 264 (10) 194 (2) 77 (17) 28 (18)
28-Dec-2010 6984 58% (1) 33% (8) 26% 271 (0) 247 (0) 63 (15) 24 (17)
22-Nov-1994 6472 55% (0) 20% (0) 26% 187 (0) 181 (1) 38 (15) 15 (15)
8-Nov-1994 6326 59% (2) 26% (22) 24% 183 (14) 132 (39) 37 (50) 14 (51)
27-Oct-1998 6014 64% (0) 31% (7) 22% 126 (8) 118 (5) 32 (11) 13 (12)
3-Jan-2013 6002 59% (0) 30% (4) 26% 207 (0) 160 (5) 38 (9) 17 (11)
11-Sep-2013 5929 53% (1) 35% (10) 25% 227 (0) 185 (2) 67 (15) 33 (16)
9-Jul-2018 5756 55% (0) 47% (6) 5% 199 (0) 131 (0) 42 (36) 20 (36)
* The difference between the peak flow recorded at Te Kuha and the peak of the combined Woolfs and Landing flows,
expressed as a percentage of the peak flow recorded at Te Kuha.
† The time from flow peaking at individual gauges (Woolfs/Landing) and peaking at Te Kuha. A value of zero indicates that
flow peaked at Woolf/Landing either before, or at the same time, as flow peaked at Te Kuha.
‡ The time from the end of the peak rainfall accumulation period at Sirdar Creek rain gauge until flow peaked at Te Kuha

24 Westport - flood forecasting roadmap for evacuation warnings
You can also read