The Transparency-Revenue Conundrum in Social Trading: Implications for Platforms and Investors
←
→
Page content transcription
If your browser does not render page correctly, please read the page content below
The Transparency-Revenue Conundrum in Social
Trading: Implications for Platforms and Investors

           Mingwen Yang, Eric Zheng, and Vijay Mookerjee

 Jindal School of Management, The University of Texas at Dallas

                                      Abstract

 Social trading – an emerging paradigm in the spirit of the sharing economy – enables
 a trader to share her trading wisdom with other investors. A special type of social
 trading is copy trading, where less experienced investors (followers) are allowed to
 copy the trades of experts (traders) in real-time after paying a fee. Such a copy
 trading mechanism often runs into a transparency-revenue conundrum. On the
 one hand, social trading platforms need to release traders’ trades as transparently
 as possible to allow followers to evaluate traders. On the other hand, complete
 transparency may undercut the platform’s revenue since followers could free ride.
 That is, followers could manually copy the delayed trades of a trader to circumvent
 paying following fees.
    This study addresses this simple, but fundamental problem by determining the
 optimal policy for releasing trade information. Of key interest here is the real time
 value of trade information. We measure this real time value using the concept of
 profit-gap, i.e., the would-be profit difference between the real time and a delayed
 execution of a trade. Our data shows that profit-gap increases with delay in a
 concave manner. To provide empirical evidence of the conundrum, we explore how
 the amount following is affected by delay and users’ evaluation activity on the
 trader (measured by the number of views received by the trader’s profile page).
 Surprisingly, when the number of views is high, a larger delay is associated with a
 lower amount following. A large delay handicaps the ability of potential followers to
 evaluate the trader, thus reducing the amount that would potentially have followed

                                          1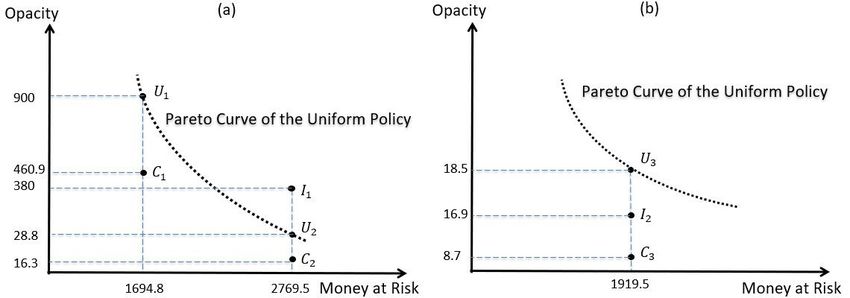
the trader. This potential loss is higher when the number of views is higher. On
      the other hand, a larger delay discourages existing followers to free ride and hence
      protects the existing amount following a trader.
            We propose the notion – money-at-risk – to quantify the possible loss of existing
      followers (amount following) as a result of releasing delayed trades. The tradeoff
      between transparency and money-at-risk is cast as an optimization problem that
      attempts to maximize information transparency while respecting a money-at-risk
      constraint. Three information release policies are compared: (1) Uniform Release
      Policy, (2) Customized Money-at-Risk Release Policy, and (3) Customized Indiffer-
      ence Policy. We demonstrate the performance of the above policies using data from
      a leading social trading platform operating in the Foreign Exchange market. We
      also study a Stochastic control formulation that directly optimizes platform revenue.
      The control is the delay that is calculated as a function of the current amount of
      money following a trader and the number of views received by the trader’s profile
      page. Besides, the calculated revenue can be incorporated into the ranking algo-
      rithm to provide a systematic way to infuse the platform’s goals into the ranking
      the traders.
      Keywords: Fintech; Social Trading; Information Value; Information Release Pol-
      icy

1    Introduction
    The emergence of new financial technologies (Fintech) has helped bridge the digital
divide of financial services, especially in terms of access to financial advising and wealth
management services. Among them is social trading, through which a retail investor
can manage her wealth (no matter how small it is) by directly following other traders’
financial advice (Eldridge 2017). These traders often share their opinions (aka financial
advice) on financial markets through specialized social media platforms (e. g., StockTwits
and Seeking Alpha), where traders can make friends, post their opinions, and directly
communicate with other investors (Doering et al. 2015). Investors can then use such
financial advice to make trading decisions.
    Recently there emerges a more disruptive type of social trading platforms, represented
by eToro, Zulutrade and Collective2. They go beyond merely providing a platform for
traders to share their trading opinions, they even allow investors to observe and follow the
actual trading (action) of peer traders on stocks, currencies, and cryptocurrencies (Pelster

                                                  2
and Hofmann 2017). And we focus on these newer types of social trading services.
       These social trading platforms have gained growing popularity as evidenced by re-
ceiving multiple rounds of venture capital funding (Reuters 2018) and the growing pool
of traders on these platforms with over 13.9 million online retail traders as of 2018 (Busi-
nessWire 2017), (BrokerNotes 2018). eToro alone has attracted over 9 million active
users in 2018, mostly small retail investors, who are allowed to open an account with as
little as 200 USD 1 . The demand for social trading services is projected to explode in the
future (Empire 2017), covering 37% of the population of investors by 2021 (eToro 2017).
Most of these social trading platforms are regulated. For example, the Financial Con-
duct Authority (FCA) in 2015 stipulated a rule that all traders in social trading need to
comply with the MiFID II ruling to qualify as investment managers 2 . A handful of these
platforms are allowed to operate in the U.S. market to serve U.S. residents, including
Collective2, Peertrade and Zulutrade’s Forex and FXCM markets 3 .
       Of central interest to us is the social trading feature called copy trading. This feature
enables investors to replicate – in real-time and in their own accounts – the actual trades of
other investors. An investor is allowed to follow other traders for a fee and have the plat-
form automatically execute the trades of other traders on her own account in a real time
manner. There are several key advantages of such a copy trading mechanism, compared
to other wealth management services: 1) More transparency since investors will observe
every single trade of a trader 4 ; 2 ) higher-level of control since the execution is done in
the investor’s own account5 ; 3) more reasonable fee (compared to funds), typically zero
management fee and 20 percent when there is a gain (https://www.zulutrade.com/trader-
   1
       https://bitcoinist.com/9-million-traders-flocked-etoros-social-trading-platform/
   2
       The key regulations on social trading include 1) No hedging of trades - a trader cannot have a trade
in the same instrument open in two opposite directions (Buy and Sell simultaneously); and 2) First In
First Out (FIFO) trades rule - when a trader has multiple trades open of the same pair in the same
direction, they must however be closed in the order they are opened, https://financefeeds.com/mifid-ii-
entering-age-completely-self-directed-traders-final-nail-goes-copy-trading-coffin/.
   3
     https://socialtradingguru.com/social-trading-for-us-residents
   4
     For example, although institutional money managers with $100 million or more in qualifying assets
are required to file quarterly an SEC Form 13F detailing their investment holdings, investors do not
know exactly when the fund manager bought and sold a commodity in the portfolio.
   5
     In institutional markets, investors have less flexibility over their portfolios; for example, less control
over timing the recognition of gains and no way to customize the specific set of commodities in the
portfolio.

                                                      3
guide)6 , and 4) preventing potential manipulation that may occur in the financial advis-
ing industry, where financial advisors may strategically distort their recommendations by
“speaking in two tongues”, for example, issuing overly positive recommendations but less
optimistic forecasts (Malmendier and Shanthikumar 2014). Under copy trading, it is hard
for traders to “speak in two tongues” since their real investment actions are observed and
copied. Top social trading networks (platforms) that enable copy trading include eToro,
ZuluTrade, Ayondo, Tradeo, etc. For example, eToro launched this feature in 2007 for
followers to replicate traders’ trades (Kortekaas 2013). According to eToro, among its
300 billion U.S. dollars worth of trades, two-thirds were executed through copy trading
(Brand 2017).
We seek to devise a proper information revelation mechanism to optimize information
transparency in social trading. Improving information transparency has been one of
the key drivers underlying the current wave of financial technology innovations (Lee
and Shin 2018). Compared with traditional fund management, social trading platforms
provide much higher information transparency by sharing not only aggregated metrics
but detailed trade-level information among traders. Many social trading platforms have
gone to the extreme of publicizing all the trades of each trader (Glaser and Risius 2018).
This complete information transparency policy is one of the main drivers behind the
explosive growth of the user base in social trading (Röder and Walter 2017).
Information transparency in trading involves two aspects: (1) what information should
be disclosed (e.g., detailed versus aggregate trading performance), and (2) when informa-
tion should be disclosed (e.g., immediate versus delayed). Timing the release of informa-
tion is particularly relevant in social trading since trading information quickly loses value
in a fast-paced financial market. A trend in the social trading industry is to release as
much information to investors as possible (e.g. eToro and Zulutade have started releasing
each trade transacted by each trader including the securities bought or sold, time and
6
It is reported that investors earned an average of 4.67% on mutual funds over the last 20 years,
which is even 3.52% less than the average SP 500 index return; mutual funds provided an average return
of 6.92% over the last 5 years, around 3% less than the SP 500 index over the same period (Kim 2017).
As Warren Buffett described about fund managers: “Professionals in other fields, like dentists, bring a
lot to the layman, but people get nothing for their money from professional money managers.” The fund
industry is overdue for change. The fee war is just part of the problem; price-conscious investors also
want more transparency around how they pay for advice (Kapadia 2018).
4price of the transaction etc. )7 , and as such there is typically no ambiguity with regard
to decision 1 in social trading. Our study thus focuses on decision 2, when to release
information.
Specifically, concerning the decision of when to release information, in copy trading,
timing the release of information is crucial. Potential investors have to rely on the infor-
mation the platforms provide to evaluate traders in order to choose a subset of traders
to follow. Information becomes less transparent if it is released with longer delay. On
the other hand, releasing trade information with very little or no delay can also cause
problems. Copy trading is not free for followers: the platform functions as an online
broker and, in addition to a brokerage fee, it also charges followers a fee to follow the
trades of traders in real-time. Traders receive a commission calculated as a fraction of
the follower fees generated from their trades. Followers will not pay to follow if detailed
trade information is already released for free in real-time. Thus, traders will lose paid
followers and consequently, will lose the incentive to participate in the platform. There-
fore, a fundamental decision for a copy trading platform is to choose the right level of
information transparency with regard to the timing of releasing trade information.
At one extreme, some social trading platforms have allowed complete information
transparency by releasing real-time trading information of traders to the public.8 How-
ever, complete information transparency invokes the opportunistic behavior of investors,
since they no longer have to pay to follow traders and can get the real-time information
for free. At the other extreme, social trading platforms may choose to delay information
release indefinitely. This, of course, renders such information unusable. Most social trad-
ing platforms, however, seek a balance between complete information transparency and
complete hiding by adding some time delay to release detailed, trade-level information.
We therefore focus on the decision of determining the optimal time to release detailed
7
Concerning the decision of what information to release, most platforms release full information. By
providing the detailed trade-level information, the platform protects itself by delegating the responsibility
of evaluating traders to followers, thereby reducing the probability of followers making biased decisions
acting on aggregated performance indicators (e.g. monthly returns). However, because releasing detailed
information could increase the information processing burden of investors, detailed information is usually
made available on-demand (e.g., by clicking on a link), while only summarized information is made visible
by default.
8
ZuluTrade initially experimented with this policy around 2013, but later, moved to the policy of
releasing trade information with some delay.
5trading information. While releasing such valuable trade information is important, dis-
playing this information with a large time delay may defeat its purpose. A large delay
makes it difficult for potential followers to evaluate traders thoroughly. Traders may trade
with different strategies on different securities and they often need to adjust their trading
strategies based upon the changing market conditions. Potential followers would only be
able to evaluate the on-going strategies if the trades are released without too much delay.
At the high level, we answer the simple but fundamental question: is copy trading
worthwhile for followers? In other words, how valuable is it for followers to know (in real-
time) the trades of traders, given that they must pay a fee to receive this information?
This is a fundamental question all copy trading platforms need to answer before designing
an optimal information revelation policy.
The answer to this question is vital for several reasons. First, the copy trading plat-
forms will collapse if followers do not see the real-time value in their service. Thus, the
answer will help followers decide when it is valuable to follow in real-time and when
it is not. Second, answering the above question is key for the platform to best mon-
etize the dissemination of its financial advice. Third, it helps platforms determine the
right magnitude of delay to add before releasing trade information to the public for free,
while preventing arbitrage opportunities and at the same time guaranteeing information
transparency. For example, ZuluTrade releases traders’ trades after 30 minutes to al-
low potential followers to evaluate different traders before following them. Lastly, the
answer offers cues for the platform to personalize the delay (and, possibly the following
fee) for each trader, based on the characteristics of the trader and the market conditions
associated with the investment product.
Thus, in this study, we specifically investigate the following three research questions.
• How does the level of information transparency (as measured by delay) affect the
profit of a trade?
• How is the amount following a trader affected by information transparency?
• How should the platform design an information revelation policy?
Empirically, we examine the copy trading phenomenon implemented by ZuluTrade,
a leading social trading platform that mainly operates in the Foreign Exchange market.
It mainly deals with day trading, and thus the time to open and close a trade within
6a market is important. ZuluTrade provides two types of accounts: trader and follower.
A follower can “follow” one or more traders. Trades from trader accounts will be copied
in real-time and automatically executed in a follower’s own accounts. The platform
functions as an online broker and charges followers a fee (per trade with some rate) to
follow the trades of a trader. While traders themselves also pay a commission to the
platform to execute their trades, they receive a kickback bonus (usually settled on a
monthly basis) that is calculated based upon the amount of money that follows their
trades. The platform operates as a two-sided market, where more followers will motivate
more traders to join and vice versa. Followers pay to copy real-time trades; however, these
trades are available for free after some time of delay (for example, 30 minutes during our
study period). Thus, investors can free ride if they are willing to accept the time delay
introduced by the platform.
The data we obtained consists of individual traders’ trades executed on ZuluTrade,
for the Foreign Exchange (Forex, or currency trading) market. Our interest is to quantify
the information value of knowing these trades in real-time. We define profit-gap, as the
difference between the real-time profit of a trade and the simulated profit (calculated using
historical Forex spot price data) of the trade, but executed with some open delay and/or
some close delay. We use the data to examine how delay affects the profit-gap, after
controlling for various factors related to the trader and other market conditions. Next,
from the data, we present empirical evidence to demonstrate the platform’s dilemma:
Lowering the delay increases transparency (that could potentially increase future revenue)
but risks losing the amount of money following (and hence hurts the platform’s current
revenue).
We then formulate and solve several optimization problems that address the platform’s
transparency-revenue conundrum. First, we examine the current approach adopted by
Zulutrade and study how it can be improved. Currently ZuluTrade seeks to maximize
transparency while holding the Money-at-Risk at or below an acceptable level, where
Money-at-Risk measures the vulnerability of the platform’s current revenue as a function
of the delay and the fees the platform charges followers to receive information on a
trader’s trades in real-time. We study an improved information release policy that is
trader specific and demonstrate that it can substantially increase transparency (reduce
delay) while maintaining the Money-at-Risk at a level equal to ZuluTrade’s current release
7policy.
We further study – using a Stochastic Optimal Control formulation of the problem –
how the information release policy can be chosen to optimize revenue. That is, rather
than indirectly addressing the problem by maximizing transparency subject to given
(exogenously chosen) Money-at-Risk, we set up a model to directly maximize platform
revenue. The Stochastic Control problem is solved to yield a feedback control (i.e.,
delay) that is based on the current amount following a trader and the current attention
being received by the trader from potential followers (measured by the trader’s profile
page views). The calculated revenue can be incorporated into the ranking algorithm to
provide a systematic way to infuse the platform’s goals into the ranking of the traders. In
so doing, this study also helps followers to determine whether it is worthwhile to follow
a specific trader in real-time.
The rest of this paper is organized as follows. We next provide a review of related
work. In Section 3, we introduce the data and the operations of the platform. In Section
4 we study the data to provide the empirical basis for the optimization models in Section
5 and Section 6. In Section 7, we provide a discussion and conclude the study.
2 Literature Review
In this section, we briefly summarize the literature on social trading. The first stream
of literature studies investment decisions made by individuals as a result of their social
interactions. Ammann and Schaub (2016) investigate the role of social interaction in
investment decisions by mining trader posts and other communications. They find that
traders with superior performance are more likely to discuss their investment strategies.
Heimer (2016) focuses on a phenomenon called the disposition effect. This anomaly,
discovered in behavioral finance, uncovers the tendency of investors selling too early in
the up market, while holding too long in a down market. Disposition effect is found to
be magnified when investors receive advice from their friends.
The second related stream of literature studies the phenomenon of copy trading. Do-
ering et al. (2015) describe how copy trading platforms are organized and discuss the
basic mechanics behind the relationship between signal provider (portfolio manager) and
signal followers (investors). They find that signal providers typically engage in active
trading rather than buy-and-hold strategies, which result in non-normal return distribu-
tion. Lee and Ma (2015) propose a system identifying traders with good and consistent
8performance to answer the question “whom to follow”. Oehler et al. (2016) show that, on
average, traders on wikifolios (a copy trading platform) do not outperform the market on
average but the best performing traders earn significant short-term excess returns.
Within this literature on social trading, several studies analyzed the trading behavior
and performance of traders in copy trading. Pan et al. (2012) study the role of so-
cial mechanisms in a financial system and find that social trades outperform individual
trades. Röder and Walter (2017) discover that traders who communicate actively with
investors attract significantly more attention, and visibility of their trading portfolios
boosts investments. Breitmayer et al. (2017) investigate the trading patterns of traders
who received social recognition for their investment advice. They show that confirmatory
social recognition leads to increased trading activity. Pelster and Hofmann (2017) study
the relationship between providing financial advice and the disposition effect. They find
that leading traders are more susceptible to the disposition effect than traders without
followers.
The third stream of relevant literature is on information transparency with regard to
what information and how much information to release in financial services. For example,
in crowdfunding, platforms need to decide what level of borrower information to release
to help these lenders evaluate a loan. Crowdfunding studies find that what information
(explicit or implicit) to release strongly influence the overall market efficiency and the
lenders’ decisions to participate (Herzenstein et al. 2011, Mäschle 2012). Zhou et al.
(2018) build a structural model to uncover how lenders’ behaviors are affected by an
exogenous information-disclosure policy change. They show that displaying extra infor-
mation leads to a higher browsing propensity and helps lenders to make sound investment
decisions.
The fourth stream of related literature is on the value of information for devising
trading strategies. Mutual funds are mandated to disclose their portfolio holdings to
investors periodically, e.g. quarterly. Some investors might mimic the trading strategy
from the released portfolio, called copycat funds in finance. Verbeek and Wang (2013)
indicate that free-riding on disclosed fund holdings is an attractive strategy and suggest
that mutual funds may suffer from such information disclosure regulations. The time-
liness of portfolio holdings disclosure has been of interest among regulators, academics
and practitioners since the Investment Company Act of 1940. The Securities Exchange
9Commission (SEC) has been trying to strike a balance (a uniform delay across all mutual
funds) between investors’ interest in timely disclosure and the potential costs associated
with revealing the strategies of investment managers (Hee Choi and Chhabria 2012). The
information required to be released in mutual funds is the portfolio holdings, not the ex-
act time when the mutual fund manager bought and sold the portfolio holdings. In this
study, our data comes from a social trading platform focusing on day trading and the
platform does releases the time traders execute a trade.
Different from the prior research that studies the social trading phenomenon mainly
from a social or behavioral perspective, our study is more normative. We address the
fundamental mechanism design problem in copy trading to determine the right level of
information to release to the public. Specifically, the main goal of this study is to measure
the economic value of paying for, and obtaining, real-time trade information on a copy
trading platform, and to address how to choose the optimal level of transparency for copy
trading platforms. None of the prior research has considered this perspective.
3 Data and Platform Operations
In this section, we first introduce the data and then describe the operations of the
social trading platform we consider.
3.1 Data
Our data comes from ZuluTrade, one of the largest copy trading platforms in the
world. The platform allows followers to auto-copy Forex trades made by financial experts
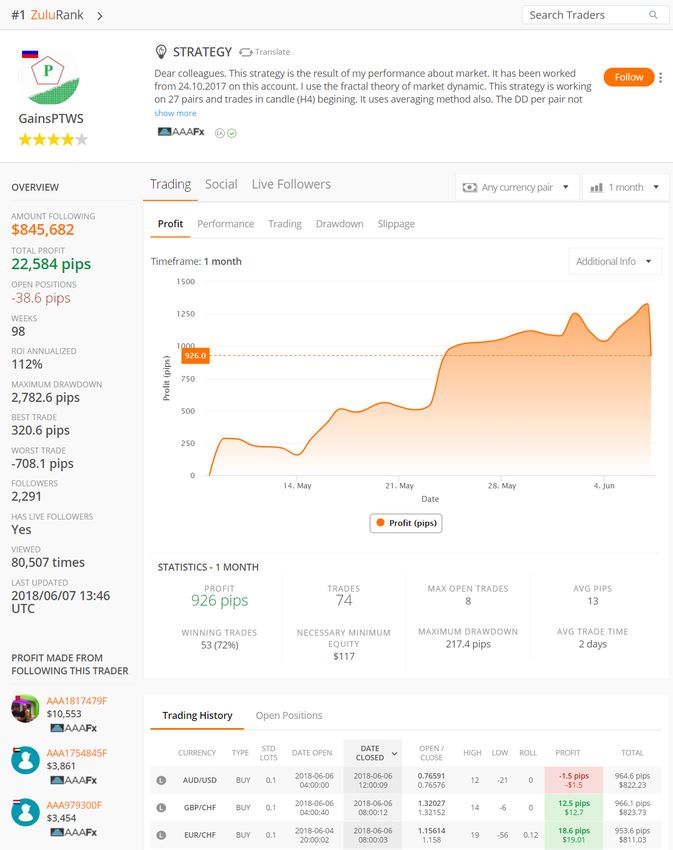
(traders). Each trader owns a public profile page, which reveals information on her
past trading performance tracing back to the first day the trader joined the platform.
ZuluTrade releases various performance metrics including the total profit of all the trades
a trader has executed via the platform, the best and the worst realized profit of the trade
among all her trades, the percentage of winning trades, the number of followers following
the trader, the total amount of money following the trader, the number of weeks the
trader has been trading on the platform, the number of views the trader’s profile has
received, etc. Importantly, ZuluTrade also releases on-going trades (trades have been
opened but not closed yet) for free after adding some time delay to the public. Figure 1
provides a screen shot of a trader’s profile page.
We obtained individual trading information of 15,352 traders during a 17 month
period from August 2016 to December 2017. The data is at the most granular trade
10Figure 1: Snapshot of a Trader’s Profile Page
level possible for each trader. The detailed trade information includes the currency (e.g.
EUR/USD), type (buy or sell), standard lot size, date open, date close, open price (the
spot price at the time when the trade was opened), close price (the spot price at the time
when the trade was closed), profit, the highest potential profit during the holding period
of the trade, the lowest potential profit (max drawdown) during the holding period of the
trade, etc. We focus on the intra-day trades since the Forex market is volatile and more
than half trades are open and closed within the same day. The Forex market provides
an ideal market (environment) to study the time value of trade information since the
profit of a trade is very sensitive to the magnitude of delay. In this study, we focus on
11the five largest currency markets – EUR/USD, GBP/USD, GBP/JPY, USD/JPY, and
USD/CAD – that together account for more than 60% of all the trades on this platform.
Table 1 presents the proportions of the five currencies among all the intra-day trades.
Table 1: Relative Proportions of Five Currencies
Currency Frequency Percent
EUR/USD 585,939 37.83%
GBP/JPY 226,230 14.61%
GBP/USD 385,702 24.90%
USD/CAD 126,421 8.16%
USD/JPY 224,461 14.49%
Total 1,548,753 100%
The second dataset we obtain is the historical spot prices for these five currency
markets from the Dukascopy Historical Data Feed. We use this data set to calculate the
hypothetical profit (loss) of a trade, which we will elaborate in the next section.
3.2 ZuluTrade Operations
On the ZuluTrade platform, once a follower clicks to “follow” a trader, the trades
of this trader are automatically copied and executed in this follower’s account. The
platform charges followers commission (following fee): 2 pips for a complete open-close
trade per standard lot size 9 This commission is already factored in the buy and sell price.
Followers can choose how to copy traders’ trades. For example, followers can choose a
fraction γ ∈ [0, 1] for each trader; only a γ fraction of the trader’s trade amount will
be executed in the copied trade. The copying trades will automatically be executed in
real-time in the follower’s account. Followers who do not follow a trader cannot receive
this trader’s trade information in real-time. However, the platform releases this trade
information with some delay on the trader’s profile page for the public to see, and for
free.
The platform shares revenue with traders: 0.5 pip for each standard lot executed in a
9
In the Forex market, the standard lot size is 100, 000. A pip is the smallest price move that a given
exchange allows. Major currency pairs are priced to four decimal places; the smallest change is that
of the last decimal point. For example, for the currency EUR/USD, 1 pip is equivalent to $0.0001.
Therefore, for a trade of size $100,000, the platform charges followers $20 as commission.
12follower account (that is $5 for a trade of $100,000). During our study period, the trader’s
compensation is calculated on a monthly calendar basis, but a trader is compensated only
if the profit earned in the trader’s account for that month is positive. Traders either get
fully compensated or zero for their trades in the month.
4 Empirical Investigations
In this section, we first describe how we measure the hypothetical profit (loss) of
executing a trade after some time delay is added to the original, real-time trade. We then
explore what factors influence the profit-gap, especially how magnitude of delay impacts
the profit-gap. Finally, we study what drives the amount of money following a trader
and empirically demonstrate the platform’s dilemma concerning delay.
4.1 Simulating Delayed Trades
Let us assume that a trader opens a particular trade at time t1 and closes this trade
at time t2 ; the difference (t2 − t1 ), is called holding time. Such trade level data is directly
observed in this study. Also observed is the profit or loss associated with the trade. Now,
consider a hypothetical trade that is the same as the above trade (the same currency,
type, and standard lot size) but the open time and close time are, respectively, t1 + δ1 ,
and t2 + δ2 . Here, δ1 and δ2 denote the open delay and close delay respectively. We
can recover the profit (loss) of this delayed trade using the historical spot prices in the
currency market traded at time t1 + δ1 , and t2 + δ2 . We vary the values for open and close
10
delay at different levels: 0, 5, 15, 30, 60, 90, and 120 minutes . When δ1 = δ2 = 0, it
represents a real-time trade. The open and close delay are chosen such that the simulated
close time is later than the simulated open time. Thus, we simulate a maximum of 48
distinct hypothetical trades corresponding to each original (or real-time) trade in the
data sample. Figure 2 depicts how we generate the hypothetical trade after considering
time delay.
For each simulated trade, we calculate the profit-gap as the real-time profit minus
the simulated profit. The profit-gap directly measures the economic value of acting upon
real-time information, relative to acting upon delayed information. The higher the profit-
gap value, the more worthwhile for followers to follow the real-time trade (with fees). We
would like to mention that the profit-gap value can be negative for some trades, meaning
the delayed trades may even earn higher profit than the real-time trades. However, we
10
A delayed trade of more than 2 hours is hardly worth considering in the volatile Forex market.
13believe that a good trader is able to time the market (when to enter and exit the market).
Delaying the trade would then lower the value of her original trade.
Figure 2: Illustration of Generating Hypothetical Trade
4.2 What drives profit-gap
We next investigate how different factors affect the value of following the trade in
real-time. To this end, we specifically explore how the magnitude of delay influences the
profit-gap.
We use i to index a trade, j to index a trader, m to index a currency market, and t
11
to index each 15-minute time period across the 17 months . The dependent variable is
P rof itGapi,j,t . The explanatory variables of interest are OpenDelayi,j,t , CloseDelayi,j,t ,
and F ollowersi,j,t . The variable OpenDelayi,j,t (CloseDelayi,j,t ) is the open (close) delay
added for trade i, executed by trader j at time period t. The variable F ollowersi,j,t
12
represents the total number of followers following trader j at time t . The econometric
model we consider is specified as follows:
P rof itGapi,j,t = β1 OpenDelayi,j,t + β2 (OpenDelayi,j,t )2 + β3 CloseDelayi,j,t +
β4 (CloseDelayi,j,t )2 + β5 F ollowersi,j,t + Xi,j,t + T raderj + Currencym + T imet + εi,j,t
(1)
In equation (1), T raderj is the trader-level fixed effects, Currencym is the currency
(market) specific fixed effects(13 , and T imet is the time-specific fixed effects capturing the
market status corresponding to a specific time period. The term Xi,j,t represents a vector
of control variables, including the standard lot size of trade i (StandardLotsi,j,t ), the
highest potential profit (measured in pips) during the holding time of trade i by trader
11
We use a relatively short time window of 15 minutes because of the high volatility of the Forex
market.
12
In the regression model, we take the logarithm of the followers to account for skewness in this
variable.
13
For notation simplification, we suppressed m from the subscription of all the other variables.
14j at time t (HighestP rof iti,j,t ), the lowest potential profit (worst drawdown) during the
holding time of trade i by trader j at time t (W orstDrawdowni,j,t ), the holding time
of trade i by trader j at time t (HoldingT imei,j,t ), the total profit (with unit dollars)
of trader j by time t (P rof iti,j,t ), the total profit (with unit pips) of trader j by time
t (P rof itpipsi,j,t ), the highest profit of a trade among all the trades of trader j until
time t (BestT radei,j,t ), the lowest profit of a trade among all the trades of trader j until
time t (W orstT radei,j,t ), the number of trades of trader j by time t (T radesi,j,t ), the
annual return of investment of trader j by time t (ROIi,j,t ), the percentage of trades
with positive profits among all the trades of trader j by time t (W inRatioi,j,t ), the
number of weeks trader j has been traded on the platform by time t (Agei,j,t ), the rank of
trader j at time t (Ranki,j,t ), the average profit of trader j by time t (AvgT radei,j,t ), the
maximum number of open trades trader j has been held by time t (M axOpenT radei,j,t ),
the minimum capital required to trade all the trades from trader j in a follower’s account
at time t (M inEquityi,j,t ), the profit of open (unrealized) positions of trader j at time
t (OpenP ositioni,j,t ), the number of views trader j’s profile page has received by time
t (V iewi,j,t ), and the indicator whether there are followers following trader j at time t
(DummyF olloweri,j,t ). Table 2 tabbulates the summary statistics of profit-gap, open
delay, close delay, etc.
To test potential existence of multicollinearity, we calculate the variance inflation
factors (VIF) and find that they are well below the acceptable threshold (10), indicating
the absence of multicollinearity. We use the White test to check for heteroscedasticity,
and the result (the chi-square value is 1,467,927 with p-value less than 0.001) shows
significant heteroscedasticity in the error term. We therefore control for it using robust
standard errors.
We simulate hypothetical trades with different magnitudes of delay. Please note that
the volume of our hypothetical trades are minuscule relative to the gigantic Forex market.
It is unlikely that any trade in our data would be subject to instant market impact (slip-
14
page) . Therefore, we assume exogeneity of the variable OpenDelay and CloseDelay.
Potential endogeneity might arise in variable F ollowersi,j,t . For example, it can be ar-
gued that higher profit-gap may likely be the cause why followers follow the trader, i.e.
14
For example, the daily trading volume of Forex market is on average 1.8 trillion in January 2018.
The maximum amount of money following a trader in our data is 3 million dollars.
15Table 2: Summary Statistics of Data
Variable Obs Mean Std. Dev. Median Min Max
P rof itGap 48,125,024 0.69 19.79 0.30 -1,002.20 1,031.90
OpenDelay 48,125,024 31.30 37.15 15 0 120
CloseDelay 48,125,024 42.22 42.89 30 0 120
F ollowers 48,125,024 9.22 59.14 0 0 2,589
StandardLots 48,125,024 3.75 86.63 0.06 0.01 1e5
HighestP rof it 48,125,024 18.79 24.35 11 0 881
W orstDrawdown 48,125,024 -19.66 22.56 -12 -1,351 0
HoldingT ime 48,125,024 190.74 250.64 95.35 1 1,440
P rof it 48,125,024 144.95 21,221.78 1.35 -1.77e6 1.28e7
P rof itpips 48,125,024 5.38 31.32 6.10 -655.60 772.40
AvgT rade 48,125,024 5.30 72.04 1.00 -10,611.30 4,898
M axOpenT rade 48,125,024 45.94 49.99 30 0 428
Rank 48,125,024 9,826.72 12,034.6 2,598 1 32,001
T rades 48,125,024 1,888.94 2,353.35 911 0 14,676
Age 48,125,024 39.45 49.71 23 0 478
Amount 48,125,024 10,308.21 63,718.35 0 0 3,267,296
BestT rade 48,125,024 508.49 1,360.10 200 -499.60 69,938.40
W orstT rade 48,125,024 -785.72 8,291.01 -371 -1,807,046 0
W inRatio 48,125,024 65.45 22.57 68 0 100
ROI 48,125,024 392.28 3,261.81 32 -11,963 84,266.6
M inEquity 48,125,024 1,866.37 2,050.23 1,064 0 9,955.44
OpenP osition 48,125,024 -1,529.13 11,028.39 0.00 -1,486,899 622,768.30
V iew 48,125,024 8,912.46 30,339.39 1,834 0 2,258,260
DummyF ollower 48,125,024 0.08 0.27 0 0 1
16simultaneity may occur.
To account for potential endogeneity, we use the two-stage least squares (2SLS) re-
gression with instrument variables (IV). We construct two IVs for variable F ollowersi,j,t .
The first IV (IV1) uses the amount following other traders of the same followers. Specifi-
cally, IV1 is the Hausman type of instrument, constructed as the total number of followers
(from the set of followers following the focal trader) following other traders (but exclud-
ing the focal trader) at time t. Variable IV1 is correlated with F ollowersi,j,t because
it is constructed from the same set of followers; but it should not directly influence the
focal trader’s performance (the dependent variable P rof itGap) because of the exclusion
of the focal trader from the construction of IV1. Another IV (IV2) is the average rank
of other traders who are followed by the same set of followers at time t. The rank of
a trader is displayed by ZuluTrade. Likewise, the average rank of other traders should
be correlated with the number of followers because this is a metric followers care about
when deciding whether to follow a trader; but rank does not directly influence the focal
trader’s performance because it is constructed from the other traders (Rossi 2014).
To validate our IVs, we perform a Hausman test, where under the null hypothesis the
specified endogenous regressors can actually be treated as exogenous. We have chi-square
value 1190.6 with p-value < 0.001, indicating the preference of IV based estimation. The
IVs should further satisfy two prerequisites: the relevance assumption and the exogeneity
assumption (Green 2007). The relevance assumption requires that the IVs should be cor-
related with the endogenous variables and that this correlation should not be weak. The
F-statistics for the endogenous variable (followers) is 46,145 (p-value = 0.000). The other
condition, exogeneity, requires that instruments excluded from the structural equation
must be uncorrelated with the structural errors, which is typically done using a test of
over-identifying restrictions via Hansen’s J statistic (Hansen 1982). The Hansen J statis-
tic is 2.642 with p-value = 0.1041, indicating that we do not reject the null hypothesis
that the instruments are exogenous and excludable.
Table 3 presents the estimation results corresponding to the econometric model in
equation (1). Larger magnitudes of open and close delay increase the profit-gap, indicat-
ing that it is more valuable for investors to follow in real-time if the platform releases a
trader’s trade with longer delay. From Table 3, we see that the coefficients of the squared
delay terms are significantly negative. Thus, the profit-gap increases with delay in a con-
17cave manner. Holding everything else equal, the marginal effect of delay on the profit-gap
decreases with larger delay magnitude. As the platform adds larger magnitude of delay,
the impact on profit-gap decreases. Besides, the profit-gap increases with larger number
of followers following a trader. The profit-gap is heterogeneous across different currency
markets, and it varies as the level of market volatility varies in different markets.
Table 3: The Impact of Delay on the Profit-Gap
Dependent Variable: P rof itGap
VARIABLES Coefficients
OpenDelay 0.016***(0.000)
(OpenDelay)2 -0.0009***(0.000)
CloseDelay 0.017***(0.000)
(CloseDelay)2 -0.0007***(0.000)
F ollowers 0.154***(0.001)
Control Variables Yes
Currency-level FE Yes
Trader-level FE Yes
Time-level FE Yes
Observations 48,125,024
R-squared 0.128
Note. The robust standard error is reported in parenthesis.
*** p < 0.01; ** p < 0.05; * p < 0.10.
4.3 Transparency-revenue Conundrum
To investigate what drives the amount following a trader, we estimate the regression
model as specified in equation (2). The dependent variable is the amount following trade
i from trader j at time t. The variables of interests are the number of (cumulative)
views of trader j received by time t (V iewi,j,t ), the profit-gap (with 30-minute open
delay and zero close delay as implemented by ZuluTrade) of trade i from trader j at
time t (P rof itGapi,j,t ), and the interaction term of view and profit-gap. The number of
views captures the potential number of interested users that the trader might be able to
convert into followers. From the results with respect to equation (1), we know that larger
magnitude of delay is associated with higher profit-gap. The profit-gap measures the
18information transparency level. Xi,j,t represents the set of control variables as specified
in equation (1). We take logarithms of amount and view. We also control for the trader-
level and time-level fixed effects.
Amounti,j,t = θ1 V iewi,j,t + θ2 P rof itGapi,j,t + θ3 V iewi,j,t ∗ P rof itGapi,j,t + Xi,j,t
(2)
+T raderj + T imet + εi,j,t
The variance inflation factors are all well below 10, indicating absence of multi-
collinearity. We control for heteroscedasticity using robust standard errors. Both vari-
ables V iew and P rof itGap might be subject to endogeneity. For example, it can be
argued that a trader’s profile attracts more views because the trader has higher amount
of money following her; followers choose to follow a trader because it is worthwhile to
follow her in real time (higher profit-gap), i.e. simultaneity may occur. Hence, we con-
struct instrument variables for both variables. The IV we construct for P rof itGapi,j,t is
the holding time of trade i. The profit-gap is sensitive to the holding time of the trade,
but a follower’s decision regarding whether to follow a trader or not does not directly rely
on the holding time of the trade.
We construct two IVs for variable V iewi,j,t . The first IV (IV1) uses sum of the number
of views of the other traders followed by the same set of followers following the focal trader
j. Specifically, IV1 is the Hausman type of instrument, constructed as the total number
of views (from the set of followers following the focal trader) following other traders
(but excluding the focal trader) at time t. Variable IV1 is expected to correlate with
V iewi,j,t because it is constructed from the same set of followers; but it should not be
systematically correlated with the focal trader’s performance (the dependent variable
Amounti,j,t ) because the focal trader is excluded from the construction of IV1. The other
IV (IV2) is the average rank of other traders who are followed by the same set of followers
at time t. The rank of a trader is displayed by ZuluTrade; traders with higher ranks are
listed at more prominent positions, attracting more views. Likewise, the average rank of
other traders should be correlated with the views because this is a metric followers care
about when deciding whether to follow a trader; but rank does not directly influence the
focal trader’s views because it is constructed on the other traders (Rossi 2014).
The Hausman test statistics is 864.6 with p-value < 0.001, indicating the preference of
IV based estimation. The F-statistics for the three variables (P rof itGap, V iew, and the
19interaction term) are 8,144.60 (p-value < 0.01), 2,246.30 (p-value < 0.01), and 17,621.87
(p-value < 0.01) respectively, pointing to strong IVs. The Hansen J statistic is χ2(1) =
1.647 with p-value = 0.199, satisfying exogeneity condition.
Table 4: The Driving Forces of the Amount Following a Trader
Dependent Variable: Amount
VARIABLES Coefficients
View 3.281*** ( 0.055 )
ProfitGap 0.289*** ( 0.095 )
View*ProfitGap -0.031*** ( 0.01 )
Rank -0.003*** ( 0.000 )
AgeLog -4.055*** ( 0.081 )
BestTrade 0.001** ( 0.000 )
WorstTrade -0.001*** ( 0.000 )
WinRatio 0.052*** ( 0.002 )
ROI 0.001*** ( 0.000 )
Trades -0.002*** ( 0.000 )
AvgTrade 0.001*** ( 0.000 )
MinEquity -0.001*** ( 0.000 )
StandardLots 0.002 ( 0.000 )
HighestProfit -0.005*** ( 0.001 )
WorstDrawdown -0.005*** ( 0.002 )
Profit 0.001 ( 0.001 )
MaxOpenTrade -0.008*** ( 0.001 )
Profitpips 0.003*** ( 0.001 )
OpenPosition 0.001*** ( 0.000 )
Trader-level FE Yes
Time-level FE Yes
Observations 730,812
R-squared 0.912
Note. The standard error is reported in parenthesis.
*** p < 0.01; ** p < 0.05; * p < 0.10.
20The results in Table 4 show that both coefficients of view and profit-gap are significant
and positive. Interestingly, the interaction term of the two is negative, implying that view
and profit-gap weaken each other. The marginal effect of profit-gap on the amount is
(0.289 − 0.031 × V iew). When the number of views of a trader attracted is low, higher
profit-gap is associated with higher amount following the trader. However, when the
number of views is large, higher profit-gap results in lower amount following the trader.
In other words, in the case when a large number of potential followers are interested
in a trader, low transparency would make it more difficult for potential followers to
evaluate the trader’s ability and thus reduces the chance of converting them into followers.
The marginal effect of view on the amount is (3.281 − 0.031 × P rof itGap) and can be
interpreted in a similar manner. Taken together, this negative interaction presents the
empirical evidence that the platform faces the trader-off between increasing transparency
(to facilitate performance evaluation for interested investors and help traders convert
those potential followers) and reducing transparency (to prevent free-riding). Having
demonstrated the tradeoff, we next devise various information release policies.
5 Optimizing Information Release
In this section, we develop and compare several information release policies that handle
the transparency-revenue tradeoff in different ways. Central to the manner in which the
tradeoff is handled, is the notion of Money-at-Risk, a concept we operationalize later
in this section. This concept was introduced to us during our interactions with the
ZuluTrade management team. It is important to mention that the policies we study
in this section (including the current release policy employed by ZuluTrade), do not
explicitly optimize the revenue of the platform. Rather, these policies can be expected to
indirectly impact the revenue in a desirable manner. Direct revenue optimization policies
are introduced in the next section.
Conceptually, the platform would like to maximize the transparency of each trade in
order for potential followers to evaluate traders, without endangering its revenue collected
from commissions and follower fees. Thus, the platform needs to strike a fine balance
between transparency and its revenue objectives. Transparency is maximized when a
trader’s trades are released to the public without any delay. However, such a (complete)
transparency policy runs the risk that followers might manually copy the trades of a
trader and execute them elsewhere without paying follower fees. This suggests the notion
21of Money-at-Risk, defined as the expected loss in the amount following a trader for a
given delay and follower fee. To put it simply, Money-at-Risk (MaR) measures the risk
of losing the amount following a trader. Mathematically, the Money-at-Risk for a trader
is the amount following the trader (ai ) multiplied by the probability that the profit-gap
of the trades associated with this trader is less than the follower fee (c) or,
ai Pi {xi (δ) ≤ c},
where xi (δ) is the random variable representing the profit-gap of the trades associated
with a trader. From the platform’s perspective, an important goal is to limit the total
Money-at-Risk across all the traders, namely, A 15
P
i=1 ai Pi {xi (δ) ≤ c}, where A is the
total number of traders.
We first introduce a theoretical model to capture how the profit-gap of a trade evolves
as a function of the delay. This model will be proven useful in the analysis of the
information release policies that are studied in this section.
5.1 Profit-Gap Model
Based on the empirical findings in Table 1, the mean profit-gap was observed to be
a concave increasing function of the delay. This finding suggests the following stochastic
process to model the profit-gap of a trade (xi (t)) after introducing a delay of t from the
point in time when the real-time trade was executed by trader i.
αi
dxi (t) = √ dt + σi dz(t),
2 t
where the parameters αi and σi are trader specific.
The above model (VABM) is a variant of an Arithmetic Brownian Motion (ABM),
where the drift term is inversely proportional to the square root of time (t). This model
√
can be solved to show that the value of xi (t) is Normally distributed with a mean of αi t
√
and a variance of σi2 t. The mean αi t, reflects the concave, increasing relationship with
delay.
We apply Maximum Likelihood Estimation (MLE) to estimate the parameters for the
profit-gap of a trader (α̂i and σ̂i for trader i). The VABM model fits the data better
15
More precisely, we should interpret A as the total number of trader accounts. For convenience,
however, we will use the term trader to mean trader account. These two terms differ in practice, but
inconsequential to our mdoel.
22than two alternative models: (1) a model with no drift term, or Brownian Motion (BM),
and (2) a model with a linear drift term, or Arithmetic Brownian Motion (ABM). The
average Bayesian Information Criterion (BIC) values for a sample of of 1,000 traders are:
VABM (85,200), ABM (86,600) and BM (87,600), showing that VABM has the best fit
among the three models. This finding shows that, generally speaking, the profit-gap of
a trade evolves with delay with a positive and concave drift, not just as white noise or
with linear drift. However, there are indeed some traders with negative drift and some
others with zero drift.
For any given trader and delay δ , we can use the above VABM process to find the
probability that the profit-gap associated with the trades of the trader is less than the
following fee c. This probability is calculated as the cumulative distribution function of
√
the normal distribution with mean α̂i δi and variance σ̂i2 δi , Fi (c|δi ), where c = 1, α̂i
and σ̂i are the VABM parameters for trader i. Figure 3 illustrates how the probability
changes with delay for a representative trader with id 102885. We see that the fitted
probability F̂i (c|δi ) decreases with δi in a convex manner. This convex property is seen
to hold for most traders.
Figure 3: The fitted probability with delay for trader 102885
5.2 Comparison of Different Release Policies
We first propose an indifference information release policy that maximizes trade trans-
parency while ensuring that the release of trade information is such that the expected
profit-gap for a trader is exactly equal to the following fee. This policy is based on the
23premise that, on average, there will be no loss of commission revenue because the release
of trade information is such that a risk neutral follower will be indifferent between fol-
lowing in real time (with a fee) and executing the same trade with delay (for free). Next,
we propose two policies that consider the profit-gap distribution to decide on the delay,
rather than basing this decision on the mean of this distribution. The first is a uniform
release policy where all trades are publicly posted for everyone to see with a delay of
δ. The second policy is a customized money-at-risk release policy where the information
release policy (i.e., delay, δi ) depends on the characteristics of trader i. The uniform
policy is, of course, a subset of the customized money-at-risk release policy.
5.2.1 Customized Indifference Policy
In this policy, a trader’s trades are released with a delay such that the expected profit-gap
equals the difference in commission fees between real-time and delayed trades.
Let Fi (x|δi ) (fi (x|δi )) denote the cumulative probability density (probability density
function) for the profit-gap (x) associated with trader i when the trades of this trader are
released with a delay of δi . Because the profit-gap could be negative, we allow the support
of the profit-gap distribution to be x ∈ [-∞, +∞]. Then, the customized indifference delay
would be given by the value of δi such that
Z +∞
xfi (x)dx = c,
−∞
where c is the fee paid to follow the trades of a trader.
5.2.2 Customized Money-at-Risk Policy
In this policy, each trader (or specifically, each trader’s account) can be customized with
a different release delay, δi . The optimization problem can be stated as below.
A
X
Minimize vi δi
δi ,i∈{1,2,...,A}
i=1
XA
subject to ai Fi (c|δi ) ≤ η
i=1
In the above specification, δi is the decision variable, A is the total number of traders,
ai is the amount of money following trader i, vi is the number of views received by trader
i in a period, Fi (c|δi ) is the probability the profit-gap less than the following fee c given
24delay δi , and η is maximum money-at-risk (the platform can tolerate). Intuitively, the
platform should release a trader’s trades with less delay if the trader receives more views,
to help the trader convert more potential followers.
In the above problem, the objective function is a measure of trade opacity; thus we
wish to minimize this measure. Our data tracks the number of potential followers view-
ing a trader. We denote the total number of page views per period as (vi ). These page
views are a direct measure of potential followers evaluating the trader. The constraint in
the above problem represents the Money-at-Risk (MaR). When the probability that the
profit-gap for a trader is below the follower fee (Fi (c|δi )), investors who follow the trader
could switch from following in real-time to free-riding with some delay (δi ). This prob-
ability is a measure of the vulnerability of losing the commissions the platform receives
from the followers of a particular trader. The Money-at-Risk captures this vulnerability,
and is calculated as the probability Fi (c|δi ) multiplied by the amount following.
The probability Fi (c|δi ) decreases with δi . At the extreme, if δi = 0, the real-time
profit and the delayed profit are the same; hence, the profit-gap is zero. Thus, the
probability that the profit-gap is less than c is 1. As the delay increases, the delayed
profit reduces (while the real time profit stays the same); hence the profit-gap increases.
0
Thus, Fi (c|δi ) < 0. Based on our regression results (see Table 3), we would expect the
profit-gap to exhibit diminishing returns with respect to delay, implying that the profit-
gap can be expected to be a concave function of the delay. Thus, we can expect that the
00
cumulative density F to be convex with respect to the delay, i.e., Fi (c|δi ) > 0, a property
that is also supported in data.
The function Fi (c|δi ) is trader specific and embeds in its knowledge of how proficient
the trader is at spotting short-lived opportunities in the market. For the same delay
(say δ1 ), if Fi (c|δ1 ) < Fj (c|δ1 ), it implies that trader i0 s trades carry more information
value, or equivalently, for the same delay, these trades are more worthwhile to follow in
real time. Thus, they can be released earlier to serve the goal of increasing transparency.
However, relative to trader i, trader j 0 s trades need more protection (from the perspective
of information value), and need to be released later.
To solve the above problem, it is sufficient to note that it is a convex optimization
problem. This is because the objective function is linear in the decision variables while
the constraint is jointly convex in the decision variables. In the constraint, it is easy to
25You can also read