Accessibility of the Urban Poor in Metropolitan Areas: Case Study of Beijing - January, 2013
←
→
Page content transcription
If your browser does not render page correctly, please read the page content below
Public Disclosure Authorized   Public Disclosure Authorized                             Public Disclosure Authorized   Public Disclosure Authorized

1
              January, 2013
                                                                          Areas: Case Study of Beijing
                                                                  Accessibility of the Urban Poor in Metropolitan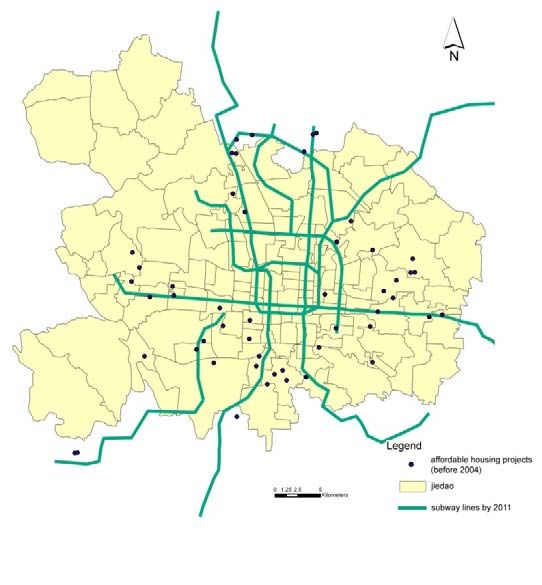
Table of contents
Preamble
1. Introduction ................................................................................................................................. 4
1.1 Project background ................................................................................................................... 4
1.2 Spatial mismatch ....................................................................................................................... 4
1.3 Spatial Equality .......................................................................................................................... 5
2. Case Study ................................................................................................................................... 6
2.1 Study Area and Background ...................................................................................................... 6
2.2 Data Sources .............................................................................................................................. 9
2.3 Data Preparation ..................................................................................................................... 12
3. Methodology of Measurement ................................................................................................. 16
3.1 Measuring Accessibility ........................................................................................................... 16
3.2 Method used in this project .................................................................................................... 17
4. Accessibility analysis .................................................................................................................. 19
4.1 Count Job Opportunity Approach ........................................................................................... 19
4.2 Average Commuting Time Approach ...................................................................................... 28
4.3 Comparison between the Two Method .................................................................................. 34
5. Scenario Analysis ....................................................................................................................... 37
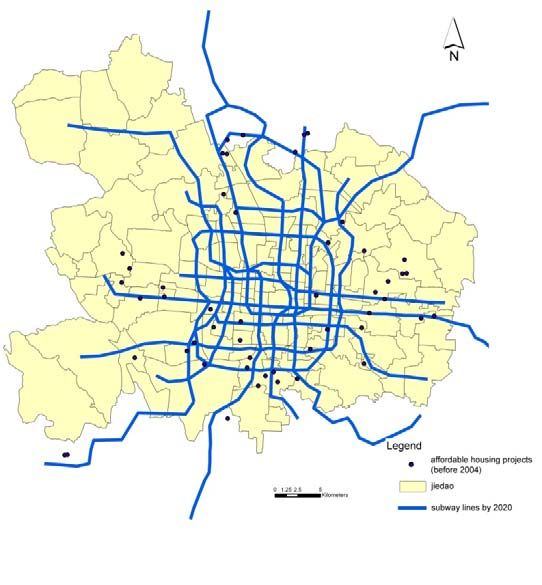
5.1 New Affordable Housing Built in Year 2005 and 2006 ............................................................ 37
5.2 New Transportation Network 2011......................................................................................... 40
5.3 Transit Oriented Development in 2020 ................................................................................... 42
5.4 Job Centers Relocate in the Suburban Area in 2020 ............................................................... 45
6. Conclusion and Policy Implications ........................................................................................... 47
2
Preamble
The project ‘Development scenarios for Wuhan: indicators for urban‐rural accessibility’ is funded
by The World Bank. The work in this project is carried out by a consortium of Chinese and
American partners led by Peking University‐Lincoln Institute Center for Urban Development and
Land Policy, Peking University in China.

With Beijing as our case study, we use the counting job approach and average commuting time
approach toevaluate the job accessibility of people living in affordable housing as urban poor. By
creatingscenarios, also analyze the accessibility change for affordable housing projects before
2004 and built in year 2005 and 2006; whether the accessibility is improved after the subway and
light rail developed in year 2011 and 2020; and whether the accessibility is improved if the job
centers relocate to suburban area in 2020. The results of these metrics illustrate that Chinese
cities is in contrast with the classical job‐housing relation in Western cities. In Beijing, affordable
housing residents have low accessibility tomajor job opportunities which are still concentrated in
the city center, while the affordable housing is increasingly located further in suburban area.
Ultimately, city planning projects designed using these metrics can help the urban poor in
accessing more employment opportunities, basic urban services and amenities, and skill training
activities in city centers, by placing an emphasis on a reasonable travel time by public transport,
and thus improving their economic prospects.

31 January 2013
Beijing, China

                                                   3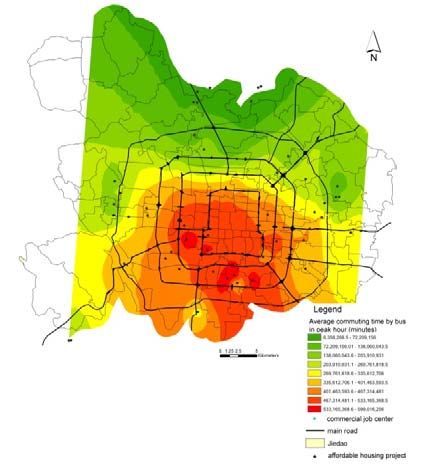
1.     Introduction
1.1 Project Background
As Chinese cities continue growing and land prices in central urban areas increase, many large‐size
low‐income housing projects and job opportunities are being moved to peripheral urban locations.
However, current public transport services concentrate on connections to downtown areas, and
public transport service between different peripheral locations is limited. This lack of public
transport service impairs the employment prospects of the urban poor who are dependent on
transit. Although anecdotal evidence exists that this is true, this project seeks to measure,
quantify, map, and develop sharable tools to evaluate this problem.

Through the development of these tools, it will be possible to design and evaluate projects based
on the impact they have on providing job accessibility to low income groups (in conjunction with
other evaluation metrics).

1.2 Spatial Mismatch
The concept of spatial mismatch is originally from North American cities, describing the imbalance
relation between residence and job opportunity. It is an important issue not only because it
induces a long distance commute, but implies that there is limited access to job opportunities,
urban facilities, and resource. This nexus creates an environment will deprive future growth and
development opportunity especially for already disadvantaged groups within the city (Blumenberg
and Ong, 1998; Holzer, 1991; Kain, 1992).

In the field of urban economy, there is a long standing debate about the spatial mismatch
hypothesis (SMH). In 1968, John Kain first described of firms moving out of the city center to the
suburban rings of American cities. However, disadvantaged groups like African‐American had
restricted mobility due to housing segregation and remained in the city center (Kain, 1968). As a
result, African‐Americans had limited access to “good” jobs that were relocated outside of the city,
depriving them of future development opportunities (Kain, 1992, p.394).

Other scholars, on the other hand, questioned whether space really mattered or not in the realm
of economy and society. Their focus was turned toward the role of race, as race was an important
factor to residential segregation in American cities (Ellwood 1986; Raphael, 1998). Moreover,
while the prevailing theory was limited to unemployment in inner city in the U.S., the amount of
empirical researches from these scholars provided a more detailed explanation to the mismatch in
the metropolitan context. Other than distance, the accessibility to jobs is weighted according to
race, ethnicity, age and even the mastery of the English language (Alramson and Fix 1993;
Mattingly 1999; Ley 1983, 95‐131).

Meanwhile, the dichotomy between inner city and suburban areas became more complex.
Accumulative analyses reveal that not only do inner city or suburbs matter, but deep historical
residential patterns also influence accessibility. After World War II, African Americans had limited
ability to afford homes and cars in the suburbs of the U.S. (Warner, 1978). However, later on they

                                                 4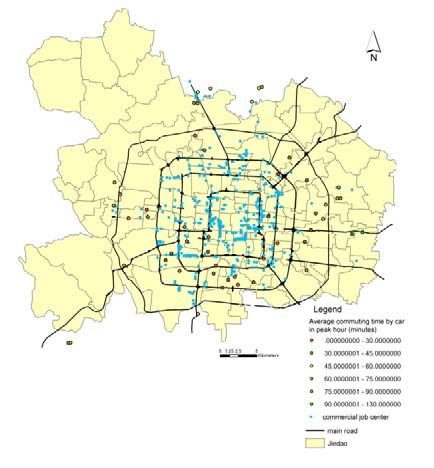
were able to afford homes in suburban White communities, but were discriminated against by the
local residents (Brooks, 2002). This discrimination toward African American residents made the
mismatch more severe in the 1950s to 1960s, but later with the 1968 fair housing legislation
African Americans were allowed the opportunity to move to suburban areas (Boustan and Margo,
2009). As such, the spatial mismatch has turned out to be much more complicated, when the
simple division between inner city and suburban area is not enough to depict the whole picture in
the metropolitan context (Grengs, 2010).

If the accessibility to jobs is a racial mismatch rather than a spatial mismatch, this will result in a
degradation of urban transportation policies advocating social‐mixed and gentrification of the
inner city. This is because even if these policies have the ability to move African American out of
an occupation declining area, it does not work on solving the unemployment problem. Moreover,
although the social and racial characters are attached as drivers in the job‐housing mismatch issue,
we cannot ignore that distance is still one of the key factors in shaping the job‐housing pattern. In
other words, the over emphasize on societal factors distort the concept of spatial mismatch.

In the ambiguous definition of spatial mismatch, some scholars shift the attention to the
transportation variable. They argue that despite the location of housing and jobs, transportation is
important because it is the link connecting the two factors together. Distance does matter, but it
should be measured and controlled in an urban transportation network context. In the case study
on Los Angeles, San Francisco and Boston, Scholars come to similar findings that the geographical
distance itself does not bring on a disadvantage but that the choice of transportation has a much
larger influence (Shen, 2000; Kawabata, 2003). More important car ownership as it provides the
flexibility to access jobs (Taylor and Ong, 1995). Even in the case study of Detroit, which had a long
history of public transit investment, people still depended more on travelling by cars especially for
who work in the suburban areas (Grengs,2010). Besides the travel mode, the urban land‐use
arrangement, zoning code and layout of facilities also relates to the mismatch issues of American
cities (Handy and Niemeier, 1997; Hansen, 1959; Wachs and Kumagai, 1973).

In conclusion, the spatial mismatch hypothesis is continuously challenged in the United States. Is
the growing distance making African Americans more disadvantaged in accessing job
opportunities? Although empirical studies find that social factors do matters, it cannot neglect the
role of distance and it is just one other way to define distance depending on road network, travel
mode and urban land‐use arrangement.

1.3 Spatial Equality
When approaching the spatial match phenomenon, researches have placed more importance on
whether distance or other social characters influence job accessibility, while to the importance of
spatial equality is neglected. In the perspective of spatial equality, urban services, facilities and
amenities should be equally distributed among the residents, especially among the disadvantage
groups such as the minority, the poor, and the elderly (Omer, 2006). In other words, social
inequality happens when the residents in a particular area have limited access to urban resources
such as education, health, recreational, and cultural activities. (Apparicio and Seguin, 2005).

                                                  5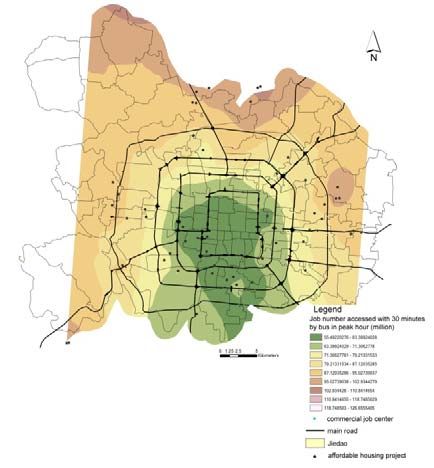
Researchers have long discussed social equality from different perspectives. Scale is very
important in the study of social equality as results may differ depending on the level of analysis,
be it a study on the region, city or neighborhood. As intensively discussed as a Geography topic,
modifiable areal unit problem (MAUP) is one of the key points to judge whether urban resources
are equally distributed (Cao and Lam, 1997; Fotheringham and Wong, 1991; Sheppard and
McMaster, 2004). Due to data availability, most of the case studies are conducted in a larger scale
or zonal data in a certain area (census tract, TAZs or zip code). However, these types of data may
be inadequate to analyze social equality for a much localized facility, such us daycare, playground
or convenience store (Hewko, Smoyer‐Tomic and Hodgson, 2002). Current research focuses more
on two scales, regional level and local level (Kuan, 2008). In the regional level research, scholars
are more focused on the change of spatial pattern of employment and housing, such as the job
sprawl from the central business district (CBD) to suburban area (Handy, 1993). In the local level,
with the rising of new urbanism movement, scholars are paying more attention on the relation
between the physical environment around neighborhoods and individual travel behavior (Bookout,
1992). For example, the new urbanists advocate mix‐used land use and grid road network, and
prefer walking distance to major service facilities to reduce the dependence on cars.

Besides scale, some researchers illustrate the difference in social equality and its implications
among a board range of urban resources. Many of them consider health to be crucial in urban life
especially for the disadvantaged groups, such as the residents’ access to clinics and other health
services (Luo and Wang, 2003) like the poor and the elderly’s access to fresh and organic food
(Apparicio et al., 2007). Others researchers have talked about the access to neighborhood facilities
such as parks, shops, green spaces and education services (Knox, 1987:327‐329; Coutts, 2008;
Witten et al., 2008). The access to local facilities can be used as a measurement of life quality.

In this sense, spatial inequality can be recognized as the outcome of spatial mismatch, which will
deprive future development opportunity for urban residents. Its policy implication lies in that jobs
may not only guarantee a good quality of life, but the access to healthy food, educational services,
hospitals and other urban resources are also important.

  2.     Case Study
2.1 Study Area and Background
Beijing is the large, sprawling, northern capital of China. The city’s population has been growing
steadily and has reached to over 17 million in 2011 (Beijing Statistical Yearbook 2011). Since the
economic reforms of 1979, China has rapidly urbanized changing the urban landscape of cities
such as Beijing. Beijing, today, not only needs to expand to accommodate the growing population,
but needs to develop a unique urban form to respond to new economic incentives coupled with
new administrative policies. The process has brought major changes to the city’s demographics
and has implications for urban development patterns that shape people’s lifestyles in the city.

                                                 6
2.1.1 Urbanization, Migration, Income Inequality, and Access to Services
China’s urban population is expected to grow from 572 million in 2005 to 926 million in 2025
(McKinsey Report, 2007). This rapid expansion is due to China’s rural‐urban migration. This is
because not only are rural residents attracted to cities due to increased economic opportunities,
but government restrictions on internal migration have greatly loosened since the end of the
1970s. Classifying and measuring migrants can be tricky, but Chinese government statistics cite
more than 252 million people are living at least semi‐permanently outside of their hometown
(National Statistics Bureau of China, 2011).

While China has made immense progress bringing down the number of people living in poverty,
the last 30 years has also seen a growth in income inequality. Income inequality between regions
increased, with a growing proportion of wealth residing in costal, urban areas (Sinclair, Yue et all,
2007). The gap between the rich and the poor is also wider in urban areas than in the countryside
(Benjamin et al, 2008).

In Beijing, the income gap has been accompanied by the development of urban poverty (Fang and
Zhang, 2002). Despite a long history of government policies favoring urban areas, economic
reforms also brought instability to urban life. The promise of permanent employment and
universal welfare was sacrificed as state‐run enterprises were dismantled, creating new risks for
urban residents (Fang and Zhang, 2002). This was exacerbated in the 1990s when the city
government redeveloped Beijing’s city center, driving many of the city’s urban poor to affordable
housing projects now located at the city’s periphery (Huang, 2005).

The low‐income resident can be defined as those whose average family monthly income is lower
than 740 Yuan (Beijing Municipal Government, 2011). However, low‐income residents are spread
all over the city and they are very hard to trace. This can be commonly illustrated by urban
migrants without Hukou, or resident permit, who make up a large proportion of the urban poor. It
is reported that the number of China’s floating population living in Beijing increased from 170,000
in 1976 to more than 4 million in 2007 (Zhu and Li, 2008). But unlike the city’s permanent
residents, urban migrants lack official statistics which state their housing information or living
location. Moreover, urban villages where the migrants tend to congregate disappear rapidly
making data collecting for this group notoriously difficult.

In order to obtain a reliable data source, this project selects affordable housing residents as the
source of where the city’s urban poor are living. This is because to live an affordable housing
complex, families undergo strict property investigations, 1 making this route to be, a solid source

1
  According to the qualification of applicant, the annual family income and family total property will be
lower than certain standard depends on family size in the study area of Beijing (central six administrative
districts). For example, for only one‐person family, the annual family income should be lower than 22.7
thousand Yuan and the total property (includes cars and other valuable capital asserts) should be lower than
240 thousand Yuan. For two‐person family, annual family income and total property limitation increase to
36.3 thousand and 270 thousand. For three‐person family, annual family income and total property
limitation increase to 45.3 thousand and 360 thousand. For four‐person family, annual family income and

                                                     7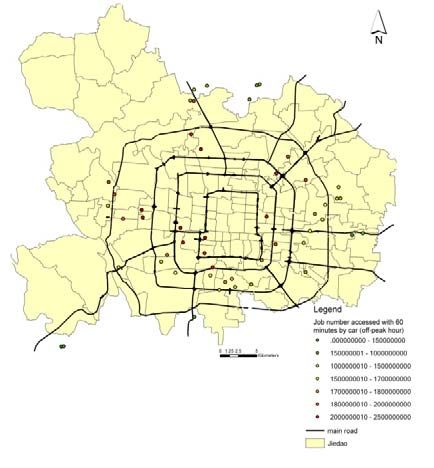
for transparent and accessible data of the urban poor (Ministry of Housing and Urban‐Rural
Development, 2012).

2.1.2 Land‐Use Development Patterns
Beijing has seen major changes in its urban development in the last 30 years, creating the urban
landscape that is at the root of the city’s accessibility conditions. Pre‐reform Beijing was defined
by the development of self‐contained work units, or danwei. Each unit included business
operations (offices or factories), housing, schools, shops, and recreation for danwei workers. As a
result the city’s urban space was divided into mostly autonomous, self‐segregated blocks. The
redevelopment of these spaces since reform and their opening is a large part of Beijing’s modern
landscape. Danwei units became less self‐contained as the government closed down state‐owned
companies and opened housing markets. This led to more diverse communities, but also
distanced people from work locations as industries moved out of the city center and homes were
no longer tied to jobs (Wang and Song, 2011).

The redevelopment of the danwei system also accompanied major changes in Beijing’s land‐use
patterns. As the city become more prosperous, commercial activity shifted from industry to
services. This meant that big factories gave way to office blocks in the city(Zhou, 2000). In addition,
privatization of the housing market in 1994 further broke the link between housing and jobs, and
led to the development of large apartment blocks on the city’s borders. Authors such as Huang
and Feng, have conducted studies on Beijing’s housing development has led to the city’s urban
sprawl and suburbanization.

2.1.3 Transportation Network Development
Transit systems both define and respond to urban growth. Beijing has seen major development in
both its road network and public transportation system over the last 30 years. This factor is a
fundamental element in the city’s accessibility problems.

Beijing is perhaps most famous for its road network, which now extends out to the sixth ring road.
Government investment in r infrastructure is reflected in a massive increase in car ownership
starting in the 90s. In 2005, of the six central districts2, 52.8 % of local residents travel by walk and
bike, 29.4% travel by public transit (bus, minibus, subway and taxi), and only 7.1% travel by car
(Shen, 2007). However, in 2008 Beijing had increased to 3.25 million registered private cars, and
the number is predicted to increase 15% annually (Zhao, 2009). As a measure of the city’s growing
dependence on motorized transportation, in the period from 2000‐2005, trips by car in Beijing
increased twice as fast as trips by public transit, while trips by bicycle shrunk (Zhao, 2009). While
the road network has expanded very quickly, and Beijing’s car‐centered growth has helped drive
sprawl and single‐use development, the road network is also highly congested, facing regular
traffic jams and slow travel speeds (Wang and Chai, 2008; Cervero, 2009).

total property limitation increase to 52.9 thousand and 450 thousand. And For five‐person and up family,
annual family income and total property limitation increase to 60 thousand and 480 thousand.
2
  It were eight central districts before the administrative adjustment in 2009, including Chongwen and
Xuanwu districts which later belong to Dongcheng and Xicheng districts.

                                                     8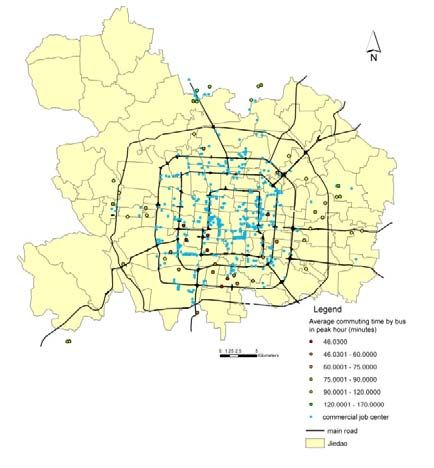
Growth in the road system has been paralleled by growth in public transportation. Beijing’s
subway system opened in 1969 with two lines, followed by 9 lines before the city’s Olympic events
in the summer of 2008. Today the city’s subway system has 14 lines, and a total track distance of
323 km. In addition, there are currently 7 lines under construction, with a plan of phasing in 21
lines over 10 years (Beijing Subway, 2012). Ridership has also been substantial, with 5,100
commuters everyday (Beijing Subway, 2012).

Despite the huge investment in subway expansion, because of its size and sprawl, Beijing also
relies on a massive bus network. The bus system includes nearly as many as 678 lines and 174.2
thousand km. The bus system is also inexpensive, costing as little as 0.4 Yuan a trip using the
public transit smart card. Beijing has also invested in Rapid Bus Transit, connecting several
Northeast suburbs to the city center via a limited access bus lane and 3 BRT lines currently (Beijing
Bus, 2012).

2.2 Data Sources
2.2.1 Study Area
Administratively, Beijing encompasses an area far larger than the city’s built‐up area and includes
several neighboring towns. In an attempt to focus on Beijing as a city, not as an administrative
entity and due to the lack of quality data in outlying areas, this study is confined to the six districts
which make‐up Beijing’s core: Dongcheng, Xicheng, Haidian, Chaoyang, Fengtai and Shijingshan
district. This area roughly encompasses the area within the 6th ring road. While this approach has
the advantage of excluding residents of outlying towns that are not truly members of Beijing’s
conceivable travel‐shed, it risks excluding some low‐income residents that have been forced to
lower rent housing in the extreme urban periphery (Figure 2‐2‐1).

                                                    9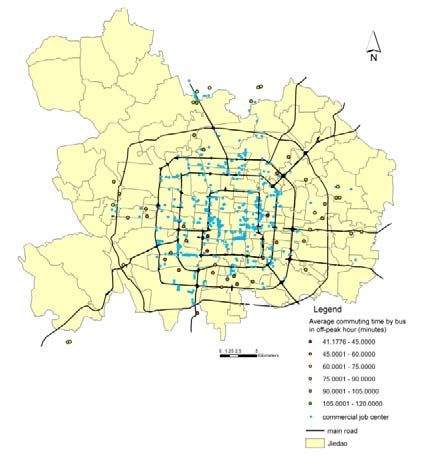
Figure 2‐2‐1 Map of Beijing District Boundaries and Ring Roads

2.2.2 Population Data
The Chinese government takes population data as part of their regular ten year census, and they
take household surveys every 10 years. The population data for this study come from the 2000
household survey, provided by the Population Serve in 2000. They supplied statistics at the level
of neighborhood districts, jiedao, of which there are 136 in the study area (Figure 2‐2‐2).

                                                10
Figure 2‐2‐2 Population Distribution by Jiedao in Beijing
2.2.3 Road Network
The road network used for the study was as it was in 2004(based on google map in 2004). By 2004,
the 5th ring road was completed and the 6th ring road was already under construction (Figure 2‐2‐
3). While data on individual road segment travel speeds are unavailable, this study uses estimates
taken from observation at locations throughout the city during peak and non‐peak hours. As a
result, the study uses an estimate of 25 km/h for peak times, and 40km/h at non‐peak times for
most locations with adjustments made for areas of high and low congestion (Table 2‐2‐3).
11Figure 2‐2‐3 Road Network and Main Roads in Beijing
2.2.4 Economic Data
Economic data for the study comes from Basic Economic Unit Survey in 2001, which reports on
businesses registered in Beijing. Business addresses and employment numbers from the survey
were used to create the GIS maps of employment for this study.
In addition, further information about employment can be obtained from the Beijing Land‐Use
Map. By identifying the location of commercial land plot, the data shows the distribution of
employment by job type.
2.3 Data Preparation
2.3.1 Identifying Low‐Income Residences
This study focuses on accessibility of Beijing’s low‐income residents. Because the population
survey does not include accurate income data, information on the location of affordable housing is
used as a means to identify the housing location of poor Beijing residents . By using a map of 72
government funded affordable housing development before 2004 (Beijing Housing and
Construction Bureau, 2012), we are given a picture of the conditions that low‐income residents
holding a Beijing hukou registration are likely to face. Many migrant workers are ineligible for
these apartments due to their lack of a hukou.
122.3.2 Identifying Job Centers
Using employment data from the 2001 Basic Economic Unit Survey, several methods were used to
create GIS maps of employment locations in Beijing. As accurate geo‐coding data for Beijing
addresses is unavailable, this study maps employment data by zip‐code. By checking the zip‐code
of registration address of company and adding up employees of companies under the same zip
code, the employment density within each zip‐code can be calculated (Fig 2‐3‐1).
Fig 2‐3‐1 Job Density by Zip‐code Zones
However, zip‐code density cannot be directly used as a basic unit for analysis for the following
reasons four reasons. First, the registration address is not necessary the actual address of the
company’s office. This can neglect the land use characters of the registration address. Second, the
zip code zone is too large in Beijing for the data to be used for accessibility analysis since the
variation within zip code zone and local factor should be emphasized in the accessibility
calculation. Third, due to data limitations, bios will happen when the affordable housing locates
near the zip code data boundary and cause under estimated accessibility. Fourth, the labor market
in Chinese cities is not as free as US cities. If residents in one AHP (affordable housing project) can
reach one major job center with a lot of jobs, it is not necessary to find suitable job there for low‐
13income people. It will cause over estimation on accessibility without considering access to other
job centers.
It is worth to note that the zip code zone boundaries are not exactly consistent with residential
district (jiedao) boundaries. Generally speaking, it will be larger than the area of residential
district (jiedao). In order to get a smaller unit of location for use in accessibility measurement, zip
code zone data is combined with the Beijing land‐use map to get employment numbers based on
industry sector and reveal major job centers in the city. By overlaying the areas on the land‐use
map designated as tertiary industry with economic data on the number of jobs, we are able to
show the number of jobs in each 1km square area for each land‐use area. The result is a map
showing the relative important commercial job centers with job densities higher than a certain
threshold (Figure 2‐3‐2). Considering that tertiary industries share in Beijing counts up to
overwhelming 65.5% in year 2004(Beijing Statistical Bureau, 2001), this approach picks up only on
commercial job centers rather than industrial job centers.
Figure 2‐3‐2 Commercial Job Centers Indentified using Economic Data and Land Use Data
2.3.3 Mapping the Bus Network
A GIS map of Beijing’s bus system was created from a database of bus stops, available from Beijing
Public Transportation website (Beijing Bus, 2012; Fan and Sun, 2011). Starting with only a list of
stops and their locations, the stops on each bus line were then combined to form bus routes and
finally the bus routes were put together to form a complete network usable for GIS network
analysis (Figure 2‐3‐3). As the assumption of road network speed, this study uses an estimate of
12 km/h for peak hours, and 20km/h at non‐peak hours for most locations for urban buses; and
1415 km/h for peak hours, and 25km/h at non‐peak hours for suburban buses. We use estimates of
35k/h in both peak and off‐peak hours for the subway and light rail system (Table 2‐2‐3).
Figure 2‐3‐3 Bus Network in Beijing
Table 2‐2‐3 Design Speed of Different Travel Mode
Travel Mode Average (km/h) Peak Hour (km/h) Off‐peak Hour (km/h)
Bus 15 12 20
Suburban Bus 20 15 25
Car 30 25 40
Subway 35 35 35
153. Methodology of Measurement
3.1 Measuring Accessibility
Accessibility can be defined as the ability from on one place to access urban facilities in
another place dependent on factors such as distance and travel cost (Handy and Niemeier 1997).
This concept was first brought into the urban planning field in 1959 to measure the potential of
interaction(Hansen 1959). In contrast with the initial concept in the transportation field, Hansen
emphasizes the relation between accessibility and urban land use pattern. This idea attracted
from both scholars and decision makers, and is regarded as an important index to measure the
balance between jobs and transportation
The cumulative opportunity measure is one of basic measures discussed in early literature of
this topic (Vickerman, 1974; Wachs and Kumagai, 1973). This method counts the number of
potential job opportunities within a pre‐determined time or distance.
J
Ai B j a j
j 1
Where
Ai Accessibility measured by the potential activity in zone j to node i;
a j Opportunities in zone j;
B j A binary value, which equals to 1 if zone j is within the predetermined threshold and 0
if not;
This method is easily applied, whenever nodes and evenly distributed‐opportunity data are at
hand. However, this method does not account for the attractiveness of each node and the
difficulty of reaching them. In this way, much variation is kept out and the results are a little far
from reality.
Another traditional measurement to accessibility is the gravity model, which is based on
distance decrease rules in geography. It argued that potential gravity among the urban land exists.
Driven by this potential gravity, one needs to overcome some friction to gain access from one
place to another (Cervero, 1989; Levinson and Kumar, 1995). Then accessibility can be measured
by aggregate relation to these places in terms of distance, time, or cost. The weight of each place
can be also calculated in this way. The longer distance, more time it takes, or the higher the cost,
the lower accessibility there will be. This indicates that people have less opportunity to work in
these places (Handy, 1993; Levinson, 1998).
Specifically, the simple expression of gravity model is:
Ai E j f (Cij ) (1)
j
Where :
16Ai is the accessibility score for people living in zone i;
E j is the number of employment opportunities in zone j;
f (Cij ) is the impedance function associated with the cost of travel
C for travel between zone i and zone j;
For a metropolitan region with Z zones, i,j=1,2,…,N.
The gravity model successfully explains the job choice among the job centers. However,
accessibility in real life highly depends on the operation of the city’s transportation network rather
than the spatial distance itself (Handy and Niemeier 1997). Thus, one of the improvements to
gravity model is to introduce the real transportation network.
The rules of network analysis partly come from graph theory, focusing on the connectivity
among each of the nodes. The simplest network can be depicted as a line between two nodes, A
and B and they generate two links: A ‐ B and B – A. If adding more nodes to the network, the links
among all the nodes should be calculated base on Law of the Network as
S = N (N ‐ 1) (2)
Where:
S = network size (number of links)
N = nodes number
Then, accessibility can be measured with the distance in real road network or bus network.
By introducing the network analysis, f (Cij ) in the equation (1) will be improved from considering
only geographic distance to real travel distance, time, and/or cost. This research will focus on the
time cost between the origins (affordable housing project) to destinations (job centers) based on
the bus/ road network.
3.2 Method Used in This Project
The specific methods used in this research include the following:
3.2.1 Accumulative approach to accessibility
Accessibility to job opportunities is measured by the job numbers one can reach from residential
location within 30 minutes or 60 minutes, based on affordable housing data, economy data by zip
code, and existing transportation network. First, it calculates job density within each zip code
zone. Second, it calculates service areas for each of the affordable housing project. Third, it
counts how many jobs each of the service areas cover, by adding up the irregular shape of
polygons intersected by service area and zip code zones (Figure 3‐2‐1).
17Bus or Road
Network
Affordable
housing
Service Area
within 30/60 Economic
Data
Jobs Reached
within 30/60 min Job Density
(by Zip code)
Accessibility
Value
Fig 3‐2‐1 The Accumulative Opportunity Approach to Job Accessibility
3.2.2 Average commuting time approach to accessibility
This study applies average commuting time along the transportation network as measure of
accessibility because travel time has been more and more widely used to analyze individuals'
accessibility to environment since Hagerstrand established the time‐geographic
framework(Hagerstrand 1970). This framework recognizes that activity participation has both
spatial and temporal dimensions (Miller 1999)and from it all space‐time (ST) measures are
developed. In particular, Mei‐Po Kwan's used network travel time as the relation between two
locations when realizing some limits of gravity‐type and cumulative‐opportunity measures (Kwan
1998). Since the 2000s, with the rapid development of transportation, information, and
computational technologies people's lifestyle has changed as well as tools available for doing this
type of analysis. In this way, previous ST measures are further developed by infilling new
perspectives and methods. However, travel time is still an important concern (Timmermans,
Arentze et al. 2002) as it could be identified in both theoretical study(Kwan and Weber 2003) and
empirical ones (Zhao, Lu et al. 2009; Yoon, Deutsch et al. 2010). In addition, given the scant data,
using average travel time is more feasible.
Accessibility to commercial jobs is calculated based on data preparation from affordable housing
data, land use data, and economic data. First, the origins for low‐income people residential
location can be identified as the seventy‐three government‐funded affordable housing
development before 2004. Second, the destinations can be identified as job centers using both
land use data and zip code economic data (Figure 3‐2‐2). Third, it makes the assumption that the
commuter should travel according to bus network or road network. Then by network analysis in
GIS, the OD matrix from all the affordable housing projects to job centers can be created. Based
on the OD matrix, it measures the accessibility value by the average commuting time from each
affordable housing project to all the potential job centers.
18Bus lines/ Land Use Economic
Streets Map Data
Bus Network/ Tertiary Job Density
Road network Industry Land (Zip code zone)
Affordable Job centers
housing
Network
Analysis
O‐D Time Cost
Matrix
Accessibility
Value
Fig 3‐2‐2 the OD Cost Approach in Network Analysis to Job Accessibility
4. Accessibility analysis
4.1 Count Job Opportunity Approach
4.1.1 Accessibility Value by Counting Jobs within Service Area
The first approach of counting data method is widely used in measuring accessibility. In this
approach, it generates service areas based on each affordable housing project and the
surrounding bus or road network as the starting point. Then it sums up all the job numbers
according to the broken down area and job density within zip code zones where each service area
covers. The value of accessibility will be measured according to the number of jobs reachable
within a certain time.
Here it supposes that a 30 minutes trip to work contains three parts, assuming that the walking
speed is 5 km/h and the bus speed is 20 km/h (off‐peak hour speed for bus (Figure 4‐1‐1). First,
walk from home to the nearest bus stop from A to B, taking 5 minutes. Second, take on a bus
travel from B to C, taking 20 minutes. Third, get off bus and walk to office, taking another 5
minutes. The total commuting time is to add three parts together, which is 5+20+5=30 minutes.
19So under this assumption, the accessible area within 30 minutes by bus only covers a service area
that can be reached by bus within 20 minutes.
Figure 4‐1‐1 An example of a 30 minutes Trip
Similarly, it supposes that a 60 minutes typical trip to work contains one more part, which is the 5
minutes transferring and waiting time (Figure 4‐1‐2). It assumes that the walking speed is 5 km/h
and the bus speed is 20 km/h (off‐peak hour speed for bus as above. The total commuting time is
to add four parts together, which is 5+45+5+5=60 minutes. So under this assumption, the
accessible area within 60 minutes by bus only covers a service area that can be reached by bus
within 45 minutes.
Figure 4‐1‐2 An example of a 60 minutes Trip
Take one of the affordable housing projects, Chaoyangxincheng, as example to get accessibility
value from the surrounding service area (Figure 4‐1‐3). When travelling by bus, the affordable
housing resident can reach an area of 82.54 km2 within 30 minutes (as the red boundary shows in
Figure 4‐1‐3, left). It covers 23 zip code zones, regardless of whether the resident crosses the
whole zone or just a small part of it. Then, it breaks down the service area into many small and
irregular shaped polygons according to the zip code boundaries cutting (as the highlight part color
pink in Figure 4‐1‐3, right). When we multiply the area with the job density in each of the small
polygon, the job number the resident can reach within each polygon will be obtained. By summing
20up all the reachable jobs of these small polygons, we will get the total reachable jobs within the
service area (as the color pink area shows in Figure 4‐1‐3, right).
Figure 4‐1‐3 Accessibility Value from the Service Area Surrounding Chaoyangxincheng
4.1.2 Accessibility Value by Public Transit
Using the counting job method above, we can repeat the process to calculate all the job numbers
of all the affordable housing project’s service areas. Through this counting job method approach,
the accessibility value will be measured by the job numbers reachable within a certain period of
time. In this part of analysis, we assume that transit time is 30 minutes and 60 minutes.
In order to approximate reality, we will use two speed scenarios: peak hour and off‐peak hour.
Travelling by bus, we approximate the speed to be 12 km/h in peak hours and 20 km/h in off‐peak
hours for city bus, while the speed 15 km/h in peak hours and 25 km/h in off‐peak hours for
suburban bus (with the bus number starts with number ‘9’).
In the 30 minutes scenario by bus, the average size of service areas of the affordable housing
projects are 33.2 km2 in peak hours, and 73.3 km2 in off‐peak hours. When overlapping the
service areas with the zip code boundaries, the accessibity value by counting job method will be
obtained. Generally speaking, it shows that with the increase in distance to the city center, the job
number accessible in both peak and off‐peak hour within 30 minutes will decrease (Figure 4‐1‐4).
the accessible job number in off‐peak hour (green line) can more than double of that in peak hour
(red line).
Besides the distance to the city center, it also shows that the local public transit still plays an
important role in accessible job numbers . For example, Baihuanjiayuan which is located outside
the east 3rd ring is not actually far from city center. However, residents from this housing project
can only reach about half of the total job numbers of similar‐distanced affordable housing in both
peak and off‐peak hours. It might be because only few bus lines pass by this affordable housing
project, while other housing projects have direct lines of transportation to job centers. In this
analysis, it is worth to note that affordable housing projects far on the urban fringe, will usually
21have service areas that cover some vacant areaswith no data outside of the zip code zones. In this
way, the accessibiliy value will only sum up the jobs inside the zip code zones.
180 30
160
Job Number (Million)
25
140
Distance (Km)
120 20
100
15
80
60 10
40
5
20
0 0
百子湾小区,
大红门西路小区
乐城家园
世纪风景
诚苑小区
建欣苑
三环新城
太平新区
四方景园
长安新城
宣祥家园
丰益花园
望京新城
电子城小区
荷清苑
玉海园小区
智学苑
朝阳新城
天通北苑
佰嘉小区
双惠小区
西山枫林园
北潞冠家园
龙回苑
Distance (km) peak hour off‐peak hour
Figure 4‐1‐4 Job Numbers Accessible by Bus within 30 Minutes during Peak and Off‐Peak Hour
Comparing the layout of accessible job number between peak and off‐peak hours within 30
minutes by public transit, our studyfinds that four revealing results. First, there is not much
differece between peak and off‐peak hours of the accessible job number level, revealing a
consistentpattern for public transit users. Second, affordable housing projects located in the
southwest and south have the best accessibility, partly because they are mostly within the fourth
ring road and near the job reach zones. Third, affordable housing projects located in the east,
west, and northeast have a middle level of accessibility, which might be because they are mostly
laid along the fifth ring road where the public transit density is not as high. Fourth, affordable
housing projects located in the north have the worst accessibility, especially for the cases of
Tiantongyuan and Huilongguan (Figure 4‐1‐5).
22Figure 4‐1‐5 Accessible Job Numbers by Bus for Affordable Housing in Peak (left) and Off‐peak
(right) Hours within 30 minutes
In the 60 minutes scenario by bus, the average size of service areas of affordable housing projects
are 277.38km2 in peak hours, and 572.69km2 in off‐peak hours. This ismuch larger than the
service area size for a 30 minute transit time. Using the same method outlined above, accessible
job numbers for each affordable housing project can be obtained. Generally speaking, the 60
minute transit time also shows a lower job number with the increase of distance to the city center
in both peak and off‐peak hour (Figure 4‐1‐6). For some affordable housing projects, especially
those located with 10 km from the city center, accessible job numbers is vastly different from
peak and off peak hour . For affordable housing projects located even further from the city center,
accessible job numbers between peak and off‐peak hour is not large, probably because both the
peak and off‐peak hour service areas cover large areas outside of the zip code zone which can not
be calculated.
Similarly, it shows the importance of the local public transit system despite the importance of
distance. Like the case mentioned above, Baihuanjiayuan, which is pretty closed to the 3rd ring,
has become an accessible job valley when compared with other affordable housing projects that
are located equal distance to the city center as seen in the30 minutes analysis. However, it is
worth nothing that the gap in accessible job numbers between peak and off‐peak hour is big for
some affordable housing such as Junanjiayuan, Kaiyangxiaoqu, Wangjingxincheng and Heqingyuan.
For these cases, it might be because they are located near exits of high ways or Beijing’s ring roads
where traffice jams are more common during peak hour, reducing accessible job numbers. This
reveals an inconsistent rank of accessible job numbers during peak and off peak hours for longer
commutes like the 60 minutes transit time.
231600 30
1400
25
Job Number (Million)
1200
20
1000
Distance (Km)
800 15
600
10
400
5
200
0 0
百子湾小区,
乐城家园
大红门西路小区
诚苑小区
建欣苑
三环新城
太平新区
四方景园
长安新城
宣祥家园
丰益花园
望京新城
电子城小区
荷清苑
玉海园小区
智学苑
朝阳新城
天通北苑
佰嘉小区
双惠小区
西山枫林园
北潞冠家园
世纪风景
龙回苑
Distance (km) peak hour off‐peak hour
Figure 4‐1‐6 Job Numbers Accessible by Bus within 60 Minutes during Peak and Off‐Peak Hour
Comparing the layout of accessible job numbers between peak and off‐peak hours within 60
minutes by public transit, we find three revealing factors. First, the difference between peak and
off‐peak hours pattern is more obvious than the 30 minutes scenario. Second, in the 60 minutes
scenario during peak hours, the accessibility level is clearly divided between the north part and
the south part of city. The affordable housing projects locates to the south of Changan Street have
good accessibility value, while those located to the north a relatively lower accessibility value.
Third, n the 60 minutes scenario during off peak hours, distance to the city center matters much
more. Affordable housing projects which are located within or along the third ring road usually
have better accessibility. Generally speaking, the accessibility between peak and off peak hour
makes a bigger difference in the 60 minutes scenario, probably beccause commuters spend more
time on road during the whole trip(Figure 4‐1‐7).
24Figure 4‐1‐7 Accessible Job Numbers by Bus for Affordable Housing in Peak(left) and Off‐peak(right)
Hours within 60 minutes
4.1.3 Accessibility Value by Car
In this section, this study also utilizes peak hour and off‐peak hour scenarios. Travelling by car, we
approximate that the speed is 25km/h in peak hours and 40 km/h in off‐peak hours (as shows in
table 2‐2‐3 above).
In the 30 minutes scenario by car, the the average size of service areas of the affordable housing
projects extend about five times larger than travelling by bus, are are 156.16 km2 in peak hours,
and 368.0 km2 in off‐peak hours. Using the same method as the previous section, accessibity
value will be calculated by counting job numbers within each intersection of zip code boundaries
and service areas. Our study shows that compared with travelling by bus, accessible job numbers
decreases slowly with the increase of distance to the city center in both peak and off‐peak hour
(Figure 4‐1‐8). Similar to the bus mode, the job numbers in off‐peak hour (green line) can be more
than double of that in peak hour (red line) for most of the affordable housing projects.
In the car scenario, our study reveals that the local road network environment matters more than
the distance to city center in affecting the accessible job numbers, which is similar to the bus
mode where local public transit is more important. This might be because car drivers can easily
access larger areas with certain time limits. For example, Junanjiayuan is located much nearer to
the city center than Fengyihuayuan, but the complex’s accessibility is actually worse in both peak
and off‐peak hour. This might because Fengyihuayuan is located nearer to the fouth ring road,
which has better connections to the highway. Similarly, it also worth to note that some of
affordable housing projects have rather low level of accessibility if they are located near the city’s
boundary, for service areas for these affordable housing projects will cover some vacant data area
(Figure 4‐1‐8).
25600 30
Job Number (Million)
500 25
Distance (Km)
400 20
300 15
200 10
100 5
0 0
百子湾小区,
电子城小区
玉海园小区
西山枫林园
北潞冠家园
乐城家园
大红门西路小区
诚苑小区
建欣苑
三环新城
太平新区
四方景园
长安新城
宣祥家园
丰益花园
望京新城
荷清苑
龙回苑
智学苑
朝阳新城
天通北苑
佰嘉小区
双惠小区
世纪风景
distance(km) peak hour off‐peak hour
Figure 4‐1‐8 Job Numbers Accessible by Car within 30 Minutes during Peak and Off‐Peak Hour
Comparing the layout of accessible job numbers between peak and off‐peak hours within 30
minutes by car (Figure 4‐1‐9), we find four interesting facets. First, generally speaking, travelling
during off‐peak hours has better accessibility than peak hours. Second, in peak hours, the
accessibility level clearly varies according to the location of affordable housing. Specifically,
affordable housing projects located along the third ring has the best level of accessibility, while
those located outside of the fifth ring road has the worst level of accessibility. Third, in off‐peak
hours, most of the affordable housing projects have rather good accessibility, except those located
far on the urban periphery in the north (Tiantongyuan and Huilongguan), east (projects in
Tongzhou Districts) and southwest (Projects in Fangshan District). This studyreveals that if it were
not for traffic jams during peak hour, residents travelling by car usually have good accessibility
level, which shows the advantage of the type of travelling. Fourth, the extreme cases which have
the worst accessibility level by car, such us Tiantongyuan and Huilongguan, usually are also the
same cases that have the worst accessibility level by bus. This illustrates that accessibility of
extremely disadvantaged affordable housing projects can not be improved by changing the mode
of transportation. As such, these areas are problematic as they may not be far from the public
transit lines, but they are still far from the nearest stop; or they may be close to the highway, but
are located near any entrances or exits.
26Figure 4‐1‐9 Accessible Job Numbers by Car for Affordable Housing in Peak (left) and Off‐
peak(right) Hours within 30 Minutes
In the 60 minutes scenario by car, the the average size of service area of affordable housing
projects are even larger, 547.0 km2 in peak hours and 1019.8 km2 in off‐peak hours respectively.
Byutilizing a similar approachabove, this studyshows that the accessibility value decreases more
slowly than the 30 minutes transit time scenario (Figure 4‐1‐10). This reveals the advantage of
travelling by car other than bus. To some degree, this could mean that a disadvantage in a far
location could be offset by changing the transportation mode from bus to car. At the same time,
the gap inaccessible job numberbetween peak hour and off‐peak hour becomes larger. For most
of the cases, the job numbers in off‐peak hour (green line) can triple of that in peak hour (red line).
3000 30
Job Number (Million)
2500 25
Distance (Km)
2000 20
1500 15
1000 10
500 5
0 0
百子湾小区,
电子城小区
玉海园小区
西山枫林园
北潞冠家园
乐城家园
大红门西路小区
诚苑小区
建欣苑
三环新城
太平新区
四方景园
长安新城
宣祥家园
丰益花园
望京新城
荷清苑
龙回苑
智学苑
朝阳新城
天通北苑
佰嘉小区
双惠小区
世纪风景
distance(km) peak hour off‐peak hour
Figure 4‐1‐10 Job Numbers Accessible by Car within 60 Minutes during Peak and Off‐Peak Hour
27When comparing the amount of accessible jobs between peak and off‐peak hours within 60
minutes by car (Figure 4‐1‐11), our study finds three important facts. First, in contrast with the 30
min scenario by car, the accessibility level does not change much between peak hour than off‐
peak hours . Second, in peak hours, affordable housing projects located in the north, east and
west between the third and fifth ring road have better accessibility level than whose locate in the
south, which is contrary to travelling by bus. This is especially the case for the Wangjing area in the
northeast, and for areas located along Chang’an Street in both the east and the west. This result
tells a different story than travelling by bus. While the accessibility is better for south part of the
city for bus taker, it is better for drivers driving to the northern parts of the city. Third, n off‐peak
hours, there is a similar gap of accessibility between the south and north part of the city, where
car drivers in the north seems to have better accessibility levels. It is also worth to note that
extreme cases which have the lowest level of accessibility is almost coinsistent to the 30 minutes
scenario by car.
Figure 4‐1‐11 Accessible Job Numbers by Car for Affordable Housing in Peak (left) and Off‐peak
(right) Hours within 60 Minutes
4.2 Average Commuting Time Approach
The second approach measures accessibility of jobs by the average commuting time. In this
approach, we create a matrix of commuting time (by bus or car) from each of the affordable
housing project to each of the job centers by point‐to‐point network analysis in GIS. Then our
study calculates the average commuting time from one particular affordable housing project to all
of the available job centers as the accessibility value. Because the unit of measure is in minutes, it
is an easier and more direct way for people to understand.
Similarly to the first approach, we divide the traveling mode into two separate parts – by bus and
by car. For a bus trip, we approximate that the whole trip contains four parts (Figure 4‐2‐1). We
28approximate that it will take five minutes from home (point A) to the nearest bus stop (Point B),
and it will take another five minutes from the bus stop (point C) to work place takes (point D). We
also estimate that it will take another five minutes to wait and transfer between the bus stops
getting on (point B) and taking off (point C). Finally, the total commuting time is the time cost on
the bus network plus the three waiting times at five minutes each, which equal to an additional 15
minutes to each commute.
Figure 4‐2‐1 A Single Bus Trip
Similarly, we also estimate that a car trip will comprise of time spent on road and another 5
minutes to find parking (from point B to point C) (Figure 4‐2‐2). As such, the total commuting time
is the time on road network plus five minutes for parking.
Figure 4‐2‐1 A Single Car Trip
To best approximate reality, we will use the travel speed assumption Table 2‐2‐3 above. For the
bus network, we assume that the speed for buses numbered from 1 to 899 is 12 km/h in peak
hour and 20 km/h in off‐peak hour, while the the speed for suburban bus numbered from 901 to
998 is is 15 km/h in peak hour and 25km/h in off‐peak hour. For the road network, it assumes that
the speed for car is 25 km/h in peak hour and 40 km/h in off‐peak hour (Table 4‐2‐1).
Table 4‐2‐1 Travel Speed Assumption by Bus and Car
Travel Mode Peak Hour Off‐peak Hour
Bus 12 km/h 20 km/h
29Suburban Bus 15 km/h 25 km/h
Car 25 km/h 40km/h
4.2.1 Accessibility by Public Transit
In the senario of travelling by public transit to tertiary industry jobs, wemeasure the accessibility
by taking the average commuting time from a particular affordable housing project to all the job
centers. Specifically in the network analysis in GIS, we have already identified 73 affordable
housing projects which were built before 2004. These housing projects are defined as the origin.
We have also identified 418 commercial job centers as destinations. . By network calcualation, an
OD Matrix will be created revealling the commute time between each origin and destination. In
this way, the average commuting time will represent the accessibility score for each affordable
housing project.
According to the calculation, the accessibility score to tertiary industry jobs centers is 80.8 minutes
on average in peak hours and 63.8 minutes on average in off peak hours, with a high level of
variation among the 73 projects. For example, the project with the best accessibility is
Lechengjiayuan in Xuanwu District, with an average communte time to tertiary industry job
centers of 54.8 minutes in peak hour and 41.2 minutes in off‐peak hour. On the other end of the
spectrum, there are several projects with very poor job accessibility, such as Songyuan Xiaoqu and
Ningxinyuan in Changping Districts with average commute times of 127.1 minutes in peak hour
and 104.8 minutes in off‐peak hour.
In the figure below, the points with a red hue illustrate good accessibility scores of affordable
housing projects, with darker colors reflecting bad accessibility (Figgure 4‐2‐3). In the same map,
the blue points represent job locations based on land use and employment data, and the colored
dots from green (better accessibility) to red (worse accessibility) represents affordable housing
projects. This analysis reveals a job‐housing pattern among low‐income residents by bus. While
most of tertiary industry job opportunities still remain in the city center, affordable housing is built
mainly in suburban areas outside of the Fourth Ring Road. And because low‐income residents rely
heavily on public trasit many affordable housing projects have low levels of accessibility. In
addition, the least accessibile affordable housing projects are those farthest away from the city
center, with the worst connections to the bus network. When comparedwith the counting job
approch above, this approachshows a similar accessibility pattern. This is because residents living
in the north need more time than those living in the west and the east to reach job locations. This,
to some extent, could indicate a relatively insufficient or inefficient provision of public
transportation in Beijing’s northern suburbs.
30You can also read