Yorkshire Dales National Park Authority Local Plan 2023-2040 Consultation No. 3 Exploring our options: Building new homes
←
→
Page content transcription
If your browser does not render page correctly, please read the page content below

Yorkshire Dales
      National Park
          Authority

Local Plan 2023-2040

 Consultation No. 3
       Exploring our
            options:
Building new homes

             1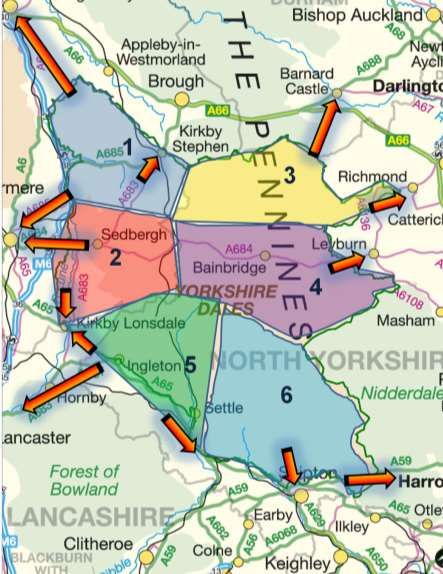
Contents
  About this consultation……………………………………………………………………………………………3

  Introduction………………………………………………………………………………………………………….4

  Part 1: Spatial and housing strategy……………………………………………………………………………6

              1. Relationship with neighbouring areas…………………………………………………………………6
              2. Settlement hierarchy…………………………………………………………………………………….9
              3. Small settlements and rural hamlets…………………………………………………………………14
              4. Housing target………………………………………………………………………………………….15
              5. Apportionment………………………………………………………………………………………….19
              6. Growing Sedbergh, Hawes and Grassington……………………………………………………….24
              7. Housing mix…………………………………………………………………………………………….25
              8. Local projects…………………………………………………………………………………………..28

    Part 2: Housing development capacity………………………………………………………………………29
              9. Spatial strategy………………………………………………………………………………………...29
            10. Sites already allocated for development………….…………………………………………………30
            11. Newly identified housing development sites….....………………………………………………….33
            12. Infilling and development boundaries…………….….………………………………………………34
            13. Protected open space…………………………..……………………………………………………..37

List of tables and figures

Table 1: Planned growth............................................................................................................................... 7

Figure 1: Local Plan sub areas and their relationships with towns……………………………………………….8

Table 2: Local Plan sub areas and their relationships with towns ................................................................. 8

Figure 1: Small towns and large villages…………………………………………………………………………..13

Table 3: Proposed Local Plan service settlements ...................................................................................... 13

Table 4: Housing completion scenarios ...................................................................................................... 18

Table 5: Distribution of property by Royal Mail database (Address base plus) ............................................ 21

Table 6: Possible new housing targets by sub area, based on existing housing distribution ....................... 24

Table 7: List of settlements likely to be suitable for new build housing ........................................................ 29

Table 8: Undeveloped sites without detailed planning permission .............................................................. 30

Table 9: Allocated business sites and proposed uses................................................................................. 32

Table 10: Definitions used by different Local Plans covering the National Park .......................................... 35
                                                                           2
About this consultation

This consultation is about where development, particularly housing development, should go. We would like
to hear your views about where building should take place. Waiting until the planning application stage to
make your views known is often too late to influence the principle of developing land, so please get
involved now.

The local plan process will involve making some difficult decisions. We fully understand that development
can be contentious, but the Local Plan needs to do all it can to meet the needs of the area. We want to
make sure that we are planning for the right amount of development in the right places, while at the same
time protecting what is most important. This consultation is the start of a process that will ensure the
decisions we take are as consistent and transparent as possible.

How to respond to this consultation

There are 30 questions embedded Parts 1 and 2 of this consultation document and you can submit your
answers and comments using the response form. Part 2 is accompanied by maps to help you identify
development capacity in your town or village, as well as a ‘Call for Sites’ form where you can nominate
sites for development. All of these documents and maps are available on our website.

We invite you to send your response to us by e-mail to localplan@yorkshiredales.org.uk or by post to
FREEPOST Yorkshire Dales.

Alternatively you can also leave us a voicemail by calling 01969 652334 and a member of the Planning
Policy team will get back to you.

The deadline for responses is Friday 26 th February 2021.

What happens next?

We will consider the response to the spatial options to help us choose a preferred development strategy.
We will assess the suitability of all the sites proposed for development. Then, the Draft Local Plan will set
out the Authority’s proposed approach to both issues.

                                                     3
Introduction
i. The National Park Authority is preparing a new Local Plan that will guide future decisions on
development after 2023. We have already heard about the issues people feel will be key over the
next 20 years and how ambitious people feel the plan should be with regard to a new housing
target, the approach to low carbon and the future of farm development.
ii. This consultation is taking a more focused look at the options around housing growth, one of the
central parts of planning policy. It is divided into two parts: spatial and housing strategy and housing
development capacity.
Part 1: Spatial and housing strategy
iii. The part of the Local Plan that determines the future pattern of development is referred to as the
‘spatial strategy’. The purpose of the spatial strategy is to determine the amount of development
required over the plan period and then to direct it to the places that will bring the best shared
benefits for the community, the economy and the environment. It is important because new
development such as housing and employment are long lasting and intensive uses of land so need
to be directed to the most appropriate locations.
iv. The Local Plan will contain spatial strategies, policies and maps that will:
indicate the relationship of the National Park to surrounding towns;
identify a list of towns and villages in the National Park where development, particularly new
housing, will be focused;
contain an indicative annual target for housing completions;
decide how to apportion the target across the National Park;
set out a target mix for new house types, sizes and tenures;
decide whether there are other development projects beyond housing allocations that could
usefully be promoted in each part of the Local Plan area.
Part 2: Housing development capacity
v. The Local Plan is required to provide as much certainty as possible - for developers, communities
and businesses - about where development will be permitted. The Local Plan therefore needs to
contain policies and maps that also:
identify larger sites that are allocated for new house building;
give clear guidance on where smaller ‘infill’ and ‘rounding off’ developments may take place;
and,
protect important open spaces against development.
vi. This will ensure that the Local Plan creates a clear presumption either in favour, or against,
development taking place.
4vii. A Strategic Housing Market Assessment for the National Park has been carried out and has
recommended that at least 50 additional dwellings are provided every year. The Local Plan will set a
target for new housing provision taking into account this evidence and past housing provision. We
also recently consulted on the level of ambition people want to see in new housebuilding and will be
using these responses to inform a new target.
viii. Whatever target is set, the Authority needs to try and identify enough developable land to try and
meet it. The National Park Authority needs to carry out an assessment of land availability to
consider where the future supply of housing land will come from. This consultation will help to inform
our assessment of land availability.
ix. Although some housing will continue to come from the conversion of existing buildings, newly built
housing has a more important role to play. The Local Plan needs to provide certainty about the
places where these new build houses will be developed and so we need to develop a clear idea
about the land that is suitable, available, and achievable.
5Part 1: Spatial and housing strategy
Part 1 covers the following topics:
1. Relationship with neighbouring areas: the connections between the National Park and the
larger surrounding towns and the identification of functional sub areas to break the local plan
up into smaller parts.
2. Settlement hierarchy: categorisation of the Park’s towns and villages in terms of their size,
purpose, accessibility and capacity for future development.
3. Small settlements and rural hamlets: the options for new housing in small villages, hamlets
and farmsteads.
4. Housing target: deciding how much land the Plan should release. This question was initially
asked as part of Consultation No.2 but is being followed up here alongside more detailed
evidence around demand and household projections.
5. Apportionment: the potential options for distributing the housing target between areas and
settlements.
6. Growing Sedbergh, Hawes and Grassington: the option to focus development in these
more sustainable service settlements.
7. Housing mix: the types, tenures and size of housing needed over the next 20 years.
8. Local Projects: listing potential new development projects in each local plan sub area.
1. Relationship with neighbouring areas
1.1. The National Park is an extensive area of beautiful landscape but is not itself a housing market, a
travel to work area or a self contained social network. Communities living inside the National Park
look outwards for most of their services. Consequently the future development needs of the area
are strongly linked to the wellbeing of larger towns and other accessible places, outside its
boundaries.
1.2. The nearest centres with the best range of services are Skipton, Richmond/Catterick, Lancaster,
Harrogate, Kendal, Darlington, Northallerton and Penrith. Over the next 20 years their housing,
employment, retail, health, leisure and transport connections are all planned for expansion or
improvement.
1.3. Within the North Yorkshire part of the local plan area a non statutory framework has been produced
in cooperation with the local planning authorities. This sets out the priorities for growth in that area
up until 20501. The Spatial Framework identifies the pre 2016 National Park as lying within part of
the ‘Moors and Dales’ sub area. It defines its role as a regional ‘place maker’ and as a centre for
natural capital, health, recreation and flood management. Its objective is the long term sustainability
of communities and the conservation of the Park’s special environmental qualities. The nearest
major growth area to the National Park is the Airedale Corridor linking Skipton, Colne and Bradford.
There is currently no equivalent spatial strategy for Cumbria or Lancashire.
1
York, North Yorkshire, East Riding and Hull, Spatial Framework: A Vision for Growth, Directors of Development, 2019
61.4. Smaller towns on the edge of the Park such as Kirkby Stephen, Kirkby Lonsdale, Bentham, Settle
and Leyburn have also been identified for growth in neighbouring local plans (Table 1), but at a
more modest rate. Together with the larger towns these are the places that attract National Park
residents for daily work, shopping and leisure. Their District and County Councils agree that their
expansion over the next 20 years and their continued success will be fundamental to the future
social and economic wellbeing of the National Park.
Table 1: Planned growth
Currently planned housing
Larger centres
growth2
Catterick/Richmond 2,133 by 2028
Darlington 2,350 by 2026
Harrogate 2,005 by 2035
Kendal 1,773 by 2025
Lancaster 3,455 by 2034
Northallerton 840 by 2035
Penrith 2,178 by 2032
Skipton 1,402 by 2032
Currently planned housing
Smaller centres
growth2
Appleby 392 by 2032
Barnard Castle Not yet determined
Bentham 501 by 2032
Gargrave 118 by 2032
Ingleton 105 by 2032
Kirkby Lonsdale 75 by 2023
Kirkby Stephen 305 by 2032
Leyburn 189 by 2032
Settle 361 by 2032
1.5. It is also true to say that these towns benefit from their access to the National Park and its range of
special qualities which contribute towards local quality of life and a visitor economy. In particular the
Park has a superb network of rights of way and extensive open access areas which are key assets
for local health and wellbeing. The neighbouring towns can market their proximity to these
nationally recognised assets as a way to attract people, business and services to locate there.
1.6. The growth of neighbouring towns has however come with some costs. For example some of their
schools are now at capacity and may not be able to expand on their current sites. This could offer
opportunities for schools and other services inside the Park which may have falling rolls and spare
capacity, to benefit from some of this additional demand.The National Park can be divided into six
sub areas for the purpose of spatial strategy (Map 1 and Table 2). Each area is defined by a road
network, a river catchment and its connection to larger population centres outside the Park
boundary. Four of the areas benefit from stations along the Settle-Carlisle railway which also gives
them an additional connection to Leeds and Carlisle.
1.7. Identifying functional sub areas is a way to apportion development across the whole local Plan area
and resist the inevitable demand to concentrate development in just a handful of popular locations.
2
Currently adopted neighbouring Local Plans and Core Strategies
7Figure 2: Local Plan functional sub areas and links to surrounding towns
Table 2: Local Plan sub areas and their relationships with towns
Local Plan sub-area District Larger towns Smaller towns
1. Mallerstang upper Lunesdale and Eden Penrith Kirkby Stephen
Westmorland Dales Kendal Appleby
Shap
2. Dentdale, Garsdale, Rawthey South Lakeland/ Kendal Sedbergh
Valley & and Lunesdale Lancaster Lancaster Kirkby Lonsdale
3. Swaledale & Arkengarthdale Richmondshire Darlington Leyburn
Northallerton Barnard Castle
Richmond/Catteric Kirkby Stephen
k Garrison
84. Wensleydale, Bishopdale & Richmondshire Darlington Hawes/Gayle
Coverdale Northallerton Leyburn
Richmond/Catteric Kirkby Stephen
k Garrison
5. Ribblesdale & Chapel le Dale Craven Skipton Bentham
Lancaster Settle/Giggleswick
Ingleton
Kirkby Lonsdale
6. Wharfedale, Littondale, Craven Skipton Grassington/Thres
Langstrothdale & Malhamdale Harrogate hfield
Gargrave
Pateley Bridge
Q1. Does the table and map above accurately represent the National Park’s functional sub areas
and their relationship with settlements?
2. Settlement Hierarchy
2.1. During the ‘setting the agenda’ consultation the point was raised that new homes should be located
near to existing services and public transport routes, to minimise future vehicle movements and
mitigate climate changing emissions. Indeed it has long been national policy to focus new
development into the more sustainable places such as brownfield land and sites within walking
distance of jobs, public transport, schools, shops and existing households 3. This is because more
sporadic development in isolated places generates more movements of vehicles, services and
people. In addition they place demands on existing services or require the development of entirely
new services in non optimal locations. Locating intensive and permanent new land uses such as
housing within existing larger settlements is considered a more efficient use of future public and
private resources and a strategy to patronise and hold on to existing services.
2.2. Part of the role of the Local Plan is to categorise settlements in terms of their size, purpose,
accessibility and capacity for further development. This is referred to as a ‘settlement hierarchy’.
Respondents to the ‘setting the agenda’ consultation supported a hub-based approach in which
new development is located in the places with the best provision of services. An opposing view
however was that prioritising sustainable locations would be an urban centric approach and would
penalise rural communities which do not already have access to services such as public transport.
2.3. It is important that the Local Plan avoids a simple reactive strategy such as ‘every application on its
merits’ because development plans are required to set consistent and fair criteria and there is an
expectancy from Government and from local stakeholders that the Plan will intervene where
necessary, to avoid harm. One way to achieve this is by setting a positive spatial strategy based on
a logical settlement hierarchy that will maximise existing resources and minimise future burdens on
public and private services.
3
Para 78 NPPF
9Current settlement hierarchy
2.4. The current settlement hierarchies are set out in the various local plans and core strategies which
overlap the National Park. They categorise:
Large towns
Smaller towns
Large villages
Small villages and hamlets
2.5. The large towns are Lancaster (a city), Kendal, Penrith, Harrogate, Northallerton, Darlington
Skipton and Richmond/Catterick Garrison , all of which are outside the Local Plan area (Table 2).
These provide the fullest range of services such as hospitals, larger-scale retail and industrial
employment to very extensive rural catchments.
2.6. The smaller towns inside and on the edge of the Park function as local service centres. In reality
some are service-rich villages, rather than towns, but ‘town’ is used here for ease of reference.
They provide a range of key services such as secondary schools, food shopping, visitor facilities
and general practice health care. In an area of very low population density such as the Dales,
smaller towns and larger villages still command big catchments and act as hubs for tourism, jobs
and business activity. They usually have some form of public transport connecting them to the
larger towns.
2.7. Hawes, Grassington and Sedbergh are currently designated service centres in the 2015 Local
Plan4. The nearby settlements of Threshfield and Gayle were also included in the designation
because they were considered to share a close physical and functional relationship to Grassington
and Hawes respectively. On the edge of the National Park Ingleton and Settle are recognised as
having a cross boundary function, providing important services to National Park communities.
2.8. The range of facilities and the links to the larger towns from these settlements make them the most
sustainable places for planned housing and employment growth, and to accommodate new
community services. They do not, however, have capacity for new estates of hundreds of homes or
large scale business developments that would likely conflict with their wildlife and heritage assets,
as well as their sensitive landscape settings.
2.9. Below the level of smaller towns are a range of large villages which have a reduced service
function normally centred around primary schools, shops, pubs or village halls. In the National Park
these tend to be compact groupings predominantly made up of housing, dispersed along the sides
of the larger dales or more open settings in the case of the Eden villages. Many large villages still
have capacity for new housing either on infill plots, through conversion of existing buildings or
possibly through the development of small sites on their periphery.
2.10. Below the level of large villages are the numerous small villages, hamlets and scattered
farmsteads which are part of the distinctive character of the National Park. These are generally not
regarded as sustainable places for planned housing growth but could have capacity for some very
small scale managed ‘windfall’ development (See para 5.1).
4
Settlement Services 2020
10A new settlement hierarchy
2.11. The Authority would like to consult on the option of a simple two tier settlement hierarchy.
This would be defined by settlement size (the number of residential and commercial addresses)
and the provision of services that are hubs of community activity ie. schools, shops, pubs and
health services.
2.12. The first category would be ‘towns’. It is suggested that the following criteria could be used
to differentiate towns from villages in the context of the National Park:
seven or more of the nine key community services (secondary school, primary school, shop
selling everyday essential items, public house, health centre, town/village hall, bank,
permanent cashpoint, repair/fuel garage);
a definable core of at least 500 Royal Mail addresses5.
2.13. If these criteria were used then three towns wholly within the National Park - Sedbergh,
Hawes/Gayle and Grassington/Threshfield - would fall into this classification. This would mean that
three out of the six Local Plan sub areas would not have a designated town wholly within them
(Table 3). The Westmorland Dales, Ribblesdale look to towns just outside or split by the Park
boundary, notably Kirkby Stephen and Settle/Ingleton while, in the case of Swaledale the nearest
service towns are Hawes in the Park and Richmond/Catterick a short distance outside.
2.14. The second category would be ‘large villages’. Most of these still have opportunities for
further conversion, rounding off, infill or development of gap sites without harm to their character or
the quality of the surrounding landscape. New small scale housing or business development will
usually bring benefits in terms of improved support for community services. The following criteria
could be used to differentiate large villages from smaller villages and hamlets:
an identifiable core of 40 Royal Mail addresses AND
EITHER at least one key service (a school, village hall/institute, shop
selling everyday items or pub) OR close proximity (1.5km) to a town
2.15. It is considered that using these criteria, which will result in over 50 large villages being
designated, will provide a good geographic distribution of opportunity right across the National
Park, offering scope for new small scale development, in conformity with national policy for rural
areas.
2.16. There is no exact science to determining these criteria but we have attempted to keep them
flexible and not too restrictive for the future. The general contraction in fixed services across deeply
rural areas means that even some of the larger villages in the National Park now have few key
services surviving. We have therefore proposed a low threshold of just one key service – either a
school, village hall/institute, village shop or pub. These key services are generally regarded as focal
points that bring a wide range of people together in the community.
5
Address Base Plus data – we have used this data because it is not possible to accurately monitor populations at the level of
individual settlements and it provides a consistent methodology across the whole National Park
112.17. These key services are typically found within the core of larger villages but where they are
located outside, or between settlements, they will still be considered as contributing to the nearest
settlement’s service function. To introduce further flexibility into the settlement hierarchy we will
regard proximity of 1.5km (reasonable walking distance 6) to a town as representing a workable
services cluster and thereby categorise both settlements accordingly.
2.18. In terms of settlement size we are proposing 40 properties, alongside the low service
threshold, as the size threshold for a larger village. This figure is taken from the current National
Park Local Plan. It is indicative of there being an established year-round residential community
large enough to withstand the ebb and flow of properties in and out of holiday and second home
occupancy. This critical mass in a nucleation provides better guarantees of service and
infrastructure availability and the likelihood of a wider range of opportunities for bringing sites
forward for development. It also gives a scale of settlement that is suited to providing for general
housing needs rather than very specific local needs.
2.19. If the criteria above are used this would yield three towns that are wholly inside the National
Park, two that are split by the Park boundary and 52 large villages. This would embrace two thirds
of National Park addresses and provide a good spread of opportunity to locate the majority of new
build housing (Figure 2 and Table 3).
Figure 3: Small towns and large villages
6
Approximately a 10 minute walk
12Table 3: Proposed Local Plan service settlements
Local Plan sub-area Towns (wholly inside or split by Large Villages
the National Park boundary)
1. Mallerstang upper Lunedale N/A Crosby Garrett,
and Westmorland Dales Crosby Ravensworth,
Great Asby,
Maulds Meaburn,
Nateby,
Newbiggin on Lune,
Orton,
Ravenstonedale/Coldbeck
2. Dentdale, Garsdale, Rawthey Sedbergh Barbon,
Valley & and Lunesdale Casterton,
Dent,
Millthrop
3. Swaledale & Arkengarthdale N/A Grinton,
Gunnerside,
Hudswell,
Langthwaite,
Low Row/Feetham,
Muker,
Reeth
4. Wensleydale, Bishopdale & Hawes/Gayle Askrigg,
Coverdale Aysgarth,
Bainbridge,
Burtersett,
Carlton,
Carperby,
East Witton,
Newbiggin (Bishopdale),
Thoralby,
Thornton Rust,
West Burton,
West Witton
5. Ribblesdale & Chapel le Dale Ingleton Austwick,
Clapham,
Settle/Giggleswick Horton-in-Ribblesdale,
Langcliffe,
Long Preston,
Stainforth
6. Wharfedale, Littondale, Grassington/Threshfield Airton/Scosthrop,
Langstothdale & Malhamdale Appletreewick,
Arncliffe,
Bolton Abbey/Bolton Bridge,
Buckden,
Burnsall,
Cracoe,
Embsay,
Hebden,
Hetton,
Kettlewell,
Kirkby Malham,
Linton,
Malham,
Starbotton
13Q2. Are there better criteria to categorise Towns and Large Villages in the Dales?
Q3. Are there any additional small settlements that should qualify as a service village because
they function as part of a cluster of settlements offering joint services?
3. Small settlements and rural hamlets
3.1. Below the level of towns and large villages are numerous small villages, hamlets and farmsteads.
These settlements are too small to have retained services of their own and are therefore dependent
on other places. Under current policies operating across most of the National Park, housing is
occasionally permitted in these locations, but is limited to conversions of traditional farm buildings
or to meet the specific needs of land-based rural workers.
3.2. There is a case for allowing a carefully managed amount of new housing, in some of these smaller
settlements. During the ‘setting the agenda’ consultation and in previous Local Plan discussions,
there has been local support for a strategy that would permit some new rural homes outside of
larger villages. As an example, the Eden District Local Plan, which covers part of the National
Park, provides scope for some new build housing in villages and hamlets as small as 10 properties.
The Upper Eden Neighbourhood Plan, which was adopted in 2012, went further in allowing new
housing in even more isolated locations.
3.3. A strategy that targeted a small number of new houses within the countryside below the level of
large villages might assist grass roots sustainability in the National Park. There could be social
benefits in terms of supporting family business succession, rural employment, staff
accommodation, home working, multi generational living and flexible accommodation for rent. A
carefully managed policy could extend housing opportunity beyond the list of towns and large
villages in Table 3, thereby making a contribution to community sustainability and supporting rural
social networks over the longer term.
3.4. If judged desirable such a strategy could see smaller settlements being treated as a third tier of the
hierarchy and fulfilling a specified (albeit small) proportion of the local plan housing target, through
a planned supply of very small scale housing sites to meet local housing need and some wider
market demand. Alternatively it could operate as an exception to general policy, providing a windfall
element of housing supply that targets specific housing needs such as local employment, first time
buyers, younger households and home working.
3.5. There will undoubtedly be some concern at the prospect of allowing new build housing outside of
larger settlements and potentially away from services. This might include the impact on the special
landscape and perhaps the tranquillity of some quieter areas. Isolated homes tend to be more
expensive to build and live in and place additional strains on service providers, whether that be
social care or refuse collection. There will also be scrutiny of a policy that knowingly increases
carbon intensive journeys although probable emissions are likely to be small in proportion to overall
actual emissions from the Park.
143.6. If this policy option were to be pursued, the scale of new permissions in these more isolated
locations, would need to be very carefully managed to avoid undermining the settlement hierarchy’s
overall approach of concentrating new development in the better connected and serviced towns
and villages. This could be achieved by setting a limit on the total amount of housing that would be
permitted outside of towns and larger villages, by controlling the number of dwellings that might be
permitted cumulatively in individual settlements and by limiting the size of individual sites to one or
two dwellings only. If development in these locations were focussed on meeting locally derived
housing needs (see 4.4 above), this would help to regulate market demand for new build outside of
the larger settlements and ensure that the additional locational flexibility does not merely increase
the existing over-supply of second homes or dormant permissions.
3.7. Policy safeguards would be needed to avoid harmful impacts to the special qualities of the National
Park such as its sensitive landscapes and dark skies. The housing growth consultation, which runs
alongside this one, considers various tools for regulating the release of land for housing, such as
the allocation of sites, choosing between development boundaries or criteria-based policies and
designating important green spaces to protect against development in the wrong locations.
Q4. Should there be flexibility to permit new homes outside of the two tiers of towns and larger
villages in Table 3?
Q5. Should this be as an exception to policy for the purpose of addressing specific local
housing needs, or should it be a deliberate part of the Local Plan strategy to deliver part of the
annual housing target?
Q6. Should the more isolated siting of these homes away from services and utility routes be
dependent on off grid solutions for their heating and power?
4. Housing target
4.1. Consultation No 2 ‘Exploring our options - Ambitions’ provided the first opportunity to comment on a
housing target for the National Park. This paper is providing a further opportunity to engage in that
issue but this time supported by more evidence in depth and rejecting the option of zero new
homes, for reasons given below.
4.2. The Local Plan is required to release land so that builders can construct a range of new homes.
For a long time now it has been a national objective to significantly increase the delivery of new
housing across England7. The Government provides a ‘standard methodology’ for calculating local
plan housing targets. This does not, however, apply in National Parks because of their small
populations and the complexities of matching their landscape boundaries to travel to work and
7
‘Delivery’ means finished and occupied houses. Planning authorities can however only deliver ‘planning permissions’ (land with
development consent for new housing). It is therefore normal to have a supply of extant permissions which remain unfinished. The
rate at which permissions are completed varies across the country and is dependent on the state of the local economy, access to
finance and other factors that are outside the scope of the planning system.
15housing market areas8. The advice from Government is that in areas where the standard
methodology does not apply, planning authorities should instead calculate their own local plan
housing requirements9, focusing on the local needs of the area but also having regard to
government approved household projections10.
4.3. The Yorkshire Dales National Park Authority, in co operation with neighbouring authorities has
therefore commissioned a strategic housing market assessment (SHMA) for the local plan area11.
The SHMA analyses local demographic data and applies the Government’s preferred household
projection to estimate the amount of additional housing needed between now and 2040. The
Authority is mindful however that some of these assumptions may change and that would affect the
findings. The Authority will therefore keep this matter under review and revise it if necessary. The
purpose here is to report the findings of the SHMA and set out options around the quantity of
housing the Local Plan could aim for. As well as meeting demand new housing is also needed to
raise the overall quality of the stock and help deliver more efficient heating and modern amenities.
Dwellings needed 2023-2040
4.4. In terms of existing stock there are an estimated 12,688 dwellings in the Yorkshire Dales National
Park, for 10,806 resident households12. This reveals an unusually high proportion (21%) of second
homes, holiday lets and other properties that are not being permanently occupied. Since the
occupancy of the existing stock cannot currently be influenced by local planning policy any
additional need will have to be met through the construction of new dwellings. If recent trends
continue however, the population of the National Park (est. 23,488 in 2017) is forecast to decline.
This is because the number of deaths each year is exceeding the low birth rate and because more
people are now leaving the National Park than are moving into it, creating negative net migration.
4.5. Using the Government’s preferred household projection, the SHMA forecasts that the population of
the National Park could decline 9% by 2040. If that happens the supply of homes will exceed
demand and more of the existing stock would probably become second homes and holiday lets.
4.6. Some of the respondents to the ‘Setting the Agenda’ consultation in January 2020 and again in
response to the ‘exploring the options’ consultation in October 2020, consider that the Local Plan
should not attempt to plan for any more housing because of the lack of demand and because they
feel the landscape and the local infrastructure is already at capacity. Other respondents believe
that more housing is needed and they point to a lack of affordable homes and a lack of modern
smaller units designed for the elderly or first time households.
4.7. The objective assessment in the SHMA takes its evidence from the Government’s preferred 2014
based, national household forecast which is itself based on historic trend data. It indicates that the
local plan area does not require any new housing over the next 20 years because its population is
projected to decline quite sharply, resulting in a surplus of existing dwellings. A falling population
would however be bad for community vitality, local business, and key services such as village
8
National Park boundaries have been drawn according to the area’s natural beauty, wildlife and cultural heritage. They reflect
landscapes of particular distinction, rather than areas of shared social or economic characteristics.
9
Para 78 English National Parks and the Broads. UK Government Vision and Circular, March 2010
10
Paragraph: 014 Reference ID: 2a-014-20190220, Planning policy guidance
11
Yorkshire Dales National Park, Strategic Housing Market Assessment, Arc4, November 2019
12
Estimated by Edge Analytics for 2019
16schools. Setting the local plan housing target in line with the forecast contraction in households
would effectively be planning for decline and would be in conflict with the ambition of the
Management Plan to maintain the National Park as a place that is ‘Home to strong, self-reliant and
balanced communities with good access to the services they need’. One of its specific objectives is
to ‘Undertake a 5-year programme of measures to promote the National Park as a place to live for
younger, working age households (18-44 years) to help halt the decline in their numbers’13.
4.8. A more sustainable strategy is therefore considered necessary to avoid depopulation. The
proposal is to plan for new housing that goes beyond just supporting existing households to stay
but would also attract new households to move into the National Park, perhaps on the back of
increased demand for home working and possible job creation in the environmental and land
management sectors. The SHMA made the following observation:
4.9. ‘Population and household projections for the YDNP show an overall reduction in people and
households over the period 2023 to 2040. However, through positive planning which supports
dwelling growth, overall household numbers are predicted to increase. This in turn results in the
improved sustainability of communities and helps to redress the rapidly ageing population profile of
the YDNP’. 14.
4.10. The proposal then is to plan for ‘dwelling led’ growth and net inward migration, rather than
simply follow the current forecast towards decline. The SHMA modelled three dwelling led
scenarios (please note that these options do not correlate directly with the options represented in
Consultation No.2 – Exploring the options: Ambitions):
Option 1 70 dwellings per annum
Option 2 50 dwellings per annum
Option 3 30 dwellings per annum
4.11. Compared with most district-wide local plans housing growth at this level would be very
modest. This is because, despite its large area, the population of the National Park is very small
and consequently household growth is small and demand for new housing is low. Fifteen additional
families moving into one of the main dales each year might be regarded as a success.
4.12. There are those that will request a higher target on the basis that a greater level of policy
intervention might yield more homes and thereby have a bigger affect on stemming decline. The
Local Plan is however required to be realistic in terms of its likely level of delivery and it must
recognise the constraints operating within the local plan area and a National Park landscape.
Ultimately the Local Plan will be tested by an independent Planning Inspector so its housing target
will have to be based on evidence of need and likelihood of delivery in terms of completed homes.
4.13. A target in the range 30 to 70 dwellings per annum (dpa), as modelled by the SHMA, would
conform to the National Planning Policy Framework because it would facilitate growth in excess of
Government projection. The middle to low target of 30-50dpa dwellings per annum would also be
13
Objective F2, National Park Management Plan 2019 -2024
14
Page 8 ‘Overall Housing Need’ Yorkshire Dales National Park, Strategic Housing Market Assessment, Arc4, November 2019,
17realistic in terms of actual delivery because it would lie within the range of past rates of completion
monitored over the last 11 years, provided enough deliverable sites can be found to fulfil this level
of completion going forward. An unrealistically higher target would face scrutiny, particularly in the
context of government policy which seeks to protect the qualities of National Parks and specifically
advises against large scale development within designated landscapes 15. Good, developable sites
remain hard to find in the National Park and so there may well be difficulties in finding enough
deliverable sites to fulfil a high target.
4.14. Table 4 indicates the theoretical impact each of these scenarios would have on population
change, household change and net migration between 2017 and 2040. It takes into account the
Park’s very high vacancy rate which means that more than one dwelling is required to generate
each additional household.
Table 4: Housing completion scenarios
Dwellings per Change 2017 - 2040
annum16
Population Population Household Household Net Dwellings
change change % change change % migration
1 70 dpa 1,246 5.3% 1282 11.9% 5,152 1610
2 50 dpa 323 1.4% 916 8.5% 4,278 1150
3 30dpa -601 -2.6% 550 5.1% 3,427 690
10 dpa -1525 -6.5% 183 1.7% 2,576 230
(reference
only)
4.15. The elderly age-profile within the National Park means that population growth will be more
constrained than in younger populations elsewhere in the country. Even with the highest housing
led scenario of 70 dpa population growth would only be a modest 5.3% over 23 years.
Option 1: 70 dwellings per annum
4.16. 70 dpa would be double the average number of houses completed each year between 2009
and 2019 in the pre extension National Park area. Prior to the economic downturn in 2009 70 dpa
was achieved in a number of years, but only because of the completion of several unusually large
sites. If it could be achieved every year in future it would mean building 1,190 new homes between
2023 and 2040. This would be very ambitious and could not rely on windfall development alone to
deliver the range of homes required to fit the type of households identified in the SHMA. New sites
would need to be allocated that are larger and more numerous than those allocated in previous
local plans.
15
Para 172 NPPF
16
These are indicative targets for completed homes per annum (rather than approval of planning permissions)
184.17. A problem is that the bigger house builders are not active in the National Park, choosing
instead to focus on larger sites in the more accessible towns around the periphery (Table 1). Given
the historical evidence of low build rates and the inertia in turning permissions into completions,
there would seem little prospect of doubling output to reach and then maintain 70dpa. The
likelihood is that releasing land against an unrealistically high target will simply increase the back-
log of unbuilt sites. The natural beauty of the landscape, the extent of wildlife designation and the
density of its historical heritage, coupled with the physical constraints of topography and
infrastructure, mean that the National Park has a shortage of unconstrained land for house building,
even for sites smaller than 20 units. There is a risk that pressure to release a high number of sites
quickly, could lead to longer term harm to landscape, heritage or other special qualities, as trade
offs are inevitably made in pursuit of the target.
Option 2: 50 dwellings per annum
4.18. A target of 50 dpa would equate to 850 new homes over the Plan period. It is estimated that
this level of completion should be sufficient to halt population decline. Fifty completions a year
should accommodate sufficient additional households to offset the current trend of net outward
migration. Stabilising the population would improve community sustainability and at least slow the
otherwise rapidly ageing profile. A target of 50 dpa would still be ambitious compared to the
average of 35 completions a year in the old National Park area. Delivery since 2009 has been slow
despite a good supply of permissions. Fifty dpa is the recommended target in the SHMA.
Option 3: 30 dwellings per annum
4.19. A third scenario would be to set the target at 30 dpa (510 new homes over the Plan period).
This would be equivalent to the average rate of completion since 2009 so should be achievable
based on recent levels of delivery. However, according to the SHMA, 30dpa would not be a
sufficient level of completion to reverse the forecast population decline. It would therefore not
achieve the objectives in the National Park Management Plan and would do less than the other
options to halt the shrinking labour force.
Q7. Which of the three options is the most appropriate housing target for the Local Plan
between 2023 and 2040?
Q8. Is there any other good evidence to support an alternative realistic target?
5. Apportionment
5.1. The planning strategies of the current local plans which cover the National Park mainly rely on
‘windfall’ sites for new housing. Windfall means ‘unplanned’ sites that conform to local policy
criteria, rather than sites that are deliberately identified and allocated for development. Common
examples of windfall include infill plots, gap sites, subdivision of existing dwellings and change of
use permissions such as barn conversions.
195.2. With the extended National Park now covering parts of five districts and urgency in national policy
to build more homes, a more planned approach to the distribution and delivery of housing is
warranted. The new Local Plan is likely to include objectives about stemming depopulation and
supporting existing services to safeguard rural communities. Relying only on a demand-led
strategy would mean unequal distribution of growth and inefficient use of infrastructure. The Local
Plan needs to make sure that all its sub areas have the opportunity to grow sustainably and so part
of its purpose is to lead development into the locations that will benefit from it.
5.3. Cross boundary discussions and agreements with neighbouring authorities are likely to support
apportionment of new housing by sub area, even if the numbers are small. Understanding the
contribution that the Local Plan will make to each District will help with planning for the wider
housing market area outside the Park boundary. Apportionment of new housing in each area is a
way of supporting the role of the Park’s towns and villages for their residents, for local business and
for the visitor economy. Infrastructure providers such as the County Councils, water, electricity and
communications companies will also want to know where development is being planned, to help
them organise their own future services inside the Park.
5.4. Apportionment will also inform other stages of the Local Plan, notably the options around the
supply of land. Having some idea of the amount of development envisaged, even if it’s only
modest, will help communities to understand the impact new house building will have in the places
they live.
How should housing be distributed throughout the Park?
5.5. Assuming that radical options such as building all new homes in settlements outside or on just a
few large sites inside the National Park, are ruled out, then planned development might be
apportioned by a more conventional strategy, such as following the current distribution of
households. Table 5 indicates the distribution of existing properties, represented here by the Royal
Mail address database.17
17
This includes business addresses as well as residential addresses but excludes some second homes and holiday letting
properties which do not receive mail
20Table 5: Distribution of property by Royal Mail database (Address base plus) 18
Proposed Towns Proposed Large Villages Small villages,
Local Plan sub-areas hamlets and isolated
properties
1. Mallerstang upper Lunedale N/A – no proposed town in Crosby Garrett Maulds Orton 719 577 addresses
and Westmorland Dales this sub area Crosby Meaburn Ravenstonedal addresses = 44% of sub area
1296 addresses Ravensworth Nateby e/ 56% of sub
10% of National Park Great Asby Newbiggin on Coldbeck area
Lune
2. Dentdale, Garsdale, Rawthey Sedbergh 1042 Barbon Dent 410 1114 addresses
Valley & and Lunesdale addresses Casterton Millthrop addresses 43% of sub area
2566 addresses 41% of sub 16% of sub
20% of National Park area area
3. Swaledale & Arkengarthdale N/A – no proposed town in Grinton Langthwaite Muker 699 510 addresses
1209 addresses this sub area Gunnerside Low Row/ Reeth addresses 42% of sub area
9% of National Park Hudswell Feetham 58% of sub
area
4. Wensleydale, Bishopdale & Hawes/Gayle 558 Askrigg Carlton Thornton Rust 1322 822 addresses
Coverdale addresses Aysgarth Carperby West Burton addresses 30% of sub area
2702 addresses 21% of sub Bainbridge East Witton West Witton 49% of sub
21% of National Park area Burtersett Newbiggin area
Thoralby
5. Ribblesdale & Chapel le Dale Ingleton 173 Austwick Horton Long Preston 917 440 addresses
1555 addresses Settle/ addresses Clapham Langcliffe Stainforth addresses 28%
12% of National Park Giggleswick 13% of sub 59%of sub
area area
18
For settlements split by the National Park boundary only addresses within the National Park have been counted, however the total size of the settlement has been used to determine
whether it meets the threshold of 40 properties in Section 3 above.
216. Wharfedale, Littondale, Grassington/ 1036 Airton/Scosthrop Burnsall Kirkby Malham 1526 1107 addresses
Langstothdale & Malhamdale Threshfield addresses Appletreewick Cracoe Linton addresses 30%
3669 addresses 28% of sub Arncliffe Embsay19 Malham 42% of sub
28% of National Park area Bolton Abbey/ Hebden Starbotton area
Bolton Br. Hetton
Buckden Kettlewell
19
This is the proportion within the Local Plan area
225.6. Table 6 applies the current distribution of address points (table 5) into the three housing target
options of 30 dwellings per annum, 50 dpa and 70dpa (para 5.9). The figures are shown over the
full Local Plan period up to 2040. They are also shown annually, but often as a range, rather than
an exact figure, because of the degree of error introduced by rounding such small numbers.
5.7. The figures are also broken down to show the split between towns and the remainder of each sub
area. The figure for the remainder area is likely to be concentrated in the larger villages but subject
to the outcome of this consultation, some of the housing growth might be distributed further down to
the level of hamlets and below (see Section 3). For this reason the figures have not been broken
down to the level of individual villages. In reality good sites for house building are not going to be
available in every settlement in proportion to their size. Instead it will be for the whole network of
settlements to provide for the level of housing growth that is eventually chosen. The housing
development capacity consultation that is running alongside this one seeks opinions on where the
best sites for development are located. Once more is known about the capacity of towns and
villages to accommodate future development, including their constraints and their land availability,
options about how much housing will go into each settlement can be investigated. This will happen
later in the Plan process.
5.8. Consultees are asked to consider Table 6 carefully and factor it into their response to the questions
under Section 4 (housing target). It is important to understand the reality of the housing target. For
example, if you live in Wharfedale, and your preference is to significantly increase house building to
boost community sustainability, then you may well opt for 70 dpa. That equates to around 22
houses a year in the sub area, which may sound manageable, but over the 17 year Plan-period, it
would require 146 houses in Grassington/Threshfield and a further 218 in the other villages in the
sub area. Or, if you live in Sedbergh, is 8 or 9 houses a year (147 over the Local Plan period)
ambitious enough? Does the town have capacity for more than that?
23Table 6: Possible new housing targets by sub area, based on existing housing distribution
Delivered in
Local Plan Sub-area housing
Delivered in main town remainder of the sub
Local Plan sub-areas annual requirement
area
housing
Total Annual Town Total Annual Total Annual
target options
2023-40 2023-40 2023-40
1. Mallerstang upper Lunedale 30dpa 43 2-3 N/A 43 2-3
and Westmorland Dales 50dpa 72 4-5 72 4-5
70dpa 101 5-6 101 5-6
2. Dentdale, Garsdale, Rawthey 30dpa 88 5-6 63 3-4 25 1-2
Valley & and Lunesdale 50dpa 146 8-9 Sedbergh 105 6-7 41 2-3
70dpa 204 12 147 8-9 57 3-4
30dpa 42 3 N/A 42 2-3
3. Swaledale & Arkengarthdale
50dpa 70 4-5 70 4-5
70dpa 98 5-6 98 5-6
4. Wensleydale, Bishopdale & 30dpa 114 6-7 34 2 80 4-5
Coverdale 50dpa 189 11-12 Hawes/Gayle 56 3-4 133 7-8
70dpa 265 15-16 79 4-5 186 10-11
30dpa 67 3-4 Ingleton & 12 0-1 55 3-4
5. Ribblesdale & Chapel le Dale 50dpa 112 6-7 20 1-2 92 5-6
70dpa 9-10 Settle/ 28 1-2 7-8
157 Giggleswick 129
6. Wharfedale, Littondale, 30dpa 156 9-10 63 3-4 93 5-6
Langstothdale & Malhamdale 50dpa 260 15-16 Grassington/ 104 6-7 156 9-10
70dpa 364 21-22 Threshfield 146 8-9 218 12-13
30dpa 510 ALL TOWNS 172 10-11 338 19-20
TOTALS
50dpa 950 285 16-17 664 39-40
70dpa 1190 400 23-24 789 46-47
245.9. The questions which follow are designed to gauge opinion about how to distribute the weight of
new housing between towns, large villages and other smaller and remoter places.
Q9. Should the housing target be equally apportioned in relation to settlement size and
services within each sub area, or should it be unequally apportioned so that growth is more
concentrated in particular settlements?
Q10. Should a fixed proportion of new housing be distributed to sites below the level of towns
and large villages listed in Table 5 (i.e. to smaller villages, hamlets and other remoter locations) ?
Q11. Is there a better way to apportion housing across the Local Plan area ?
6. Growing Sedbergh, Hawes/Gayle and Grassington/Threshfield
6.1. During the ‘setting the agenda’ consultation the point was made that Sedbergh with the best
concentration of services and employment in the Park, should be identified as a priority for new
housing and business growth. The suggestion is that it would benefit from a disproportionately
larger share of future development. The town has not grown significantly over the last 10 years,
with only 41 new homes being completed. Recently the bank closed and the high street has
struggled to retain footfall. The Sedbergh Economic Partnership, which was established to support
regeneration, is supportive of a growth strategy because it would further its ambitions for the town
and the surrounding area.
6.2. The figures in Table 6 assume a distribution of housing growth based on the existing proportion of
properties in each area. An alternative option would be to plan for an unequal distribution, so that
some settlements grow by more than their ‘fair share’ and others by less. So, for example, an equal
distribution in the South Lakeland sub area would, under a 70 dwellings per annum target, see 147
dwellings built in Sedbergh up to 2040, and 57 spread between villages including Dent, Barbon,
Casterton and Millthrop. if it is considered that Sedbergh has capacity to grow by more than 147
dwellings and/or that these villages do not have capacity for 57 dwellings, then perhaps more
growth could be concentrated in Sedbergh?
6.3. Similar arguments may also apply to Hawes/Gayle and Grassington/Threshfield. A planned
increase of households, in excess of their current development rates and their proportional
populations, might better support their high streets and their future vibrancy as service centres for
the extensive rural areas that surround them.
6.4. Housing growth aimed at households with children would support more pupil numbers at their
schools and widen the range of new homes with modern amenities. A stable population with more
working age people might provide more scope for local business and a wider social and volunteer
network within the community. If the towns are more vibrant they will also function better as tourism
centres generating additional spending. The three towns are well distributed across the local plan
area so their appropriate growth would spread the benefit across the National Park.
25You can also read