Draft Housing Strategy 2021 -2026
←
→
Page content transcription
If your browser does not render page correctly, please read the page content below
Draft Housing Strategy 2021 -2026

                                    1
Contents
1. Executive Summary
2. Introduction
3. The National Context
4. The Bedford Borough Context
4.1. Strategies and Plans
4.2. Demographic Context – Understanding Our Population
5. Theme 1 – Understanding Housing Our Needs
5.1. Key Objective
5.2. Data Sources
5.3. Issues for Bedford Borough
5.4. Key Actions
6. Theme 2 – Delivering the Homes Required
6.1. Key Objective
6.2. Data Sources
6.3. Issues for Bedford Borough
6.4. Key Actions
7. Theme 3 - Making Best Use of Existing Housing
7.1. Key Objectives
7.2. Data Sources
7.3. Issues for Bedford Borough
27.4. Key Actions
8. Theme 4 - Meeting the Housing Needs of Vulnerable People
8.1. Key Objective
8.2. Data Sources
8.3. Issues for Bedford Borough
8.4. Key Actions
9. Action Plan
31. Executive Summary
1.1. All Local Housing Authorities have a responsibility to produce a Housing Strategy which details how they will undertake
their strategic housing role. This Strategy sets out Bedford Borough’s housing objectives for the period 2021 – 2026 and
how it will deliver them.
1.2. Bedford Borough’s housing objectives must be delivered in the context of the national and local operating environment.
There have been significant changes to both since the adoption of the Borough’s Housing Strategy Review 2016 – 2020.
1.3. Significant legislation implemented since the adoption of Housing Strategy 2012 – on which the 2016 – 20 Review was
based - includes: The Localism Act 2011, Care Act 2014, The Self-build and Custom Housebuilding Act 2015, Housing
and Planning Act 2016 and the Homelessness Reduction Act 2017.
1.4. The publication of The Rough Sleeping Strategy in 2018, the issuing of a revised National Planning Policy Framework in
2019 and Governments vision for the ‘Oxford-Cambridge Arc’ - to which Bedford Borough is central - have impacted on
the national strategic and policy operating environment.
1.5. The provision of sufficient high quality, affordable homes contributes to the delivery of the goals and objectives of other
adopted Borough strategies including the Sustainable Community Strategy 2009-2021, Bedford Borough Corporate Plan
2017-2021, Bedford Borough Joint Health and Wellbeing Strategy 2018-2023 and Bedford Borough Growth Plan 2018-
2022.
1.6. Demographic considerations include significant forecast population growth, an aging population and affordability
challenges. Bedford Borough also has a significantly higher Black and Minority Ethnic population than the East of
England. 2011 Census data will be updated in 2021 and the new information obtained may impact on objectives during
the lifetime of this housing strategy.
1.7. This Housing Strategy identifies four key themes and their associated objectives. These are:
Understanding Housing Needs:
4To ensure up to date information on the need for various forms of housing is available and understood such
that it can be used to inform decision making in relation to housing provision within the Borough and in
determining priorities.
Delivering the Homes Required:
To ensure that the objectively assessed need for both market and affordable housing is delivered and to
contribute actively to the growth anticipated for our region.
Making Best Use of Existing Housing:
Make better use of our existing homes in the Borough including bringing empty properties back into use and
addressing climate change and fuel poverty issues.
Ensure that as much as possible of the affordable housing stock is fully occupied and where adaptations have
been carried out they are available to those that need them.
Develop a robust approach to allocations and tenancies of affordable housing that meets the needs and
priorities of the Borough and maximise the use of available resources.
and
Meeting the Housing Needs of Vulnerable People:
To maximise the supply of specialist housing available to meet the identified needs of vulnerable groups
including homeless households, those with a learning disability, mental health issue or physical disability,
vulnerable older persons or those with specialist support needs such as those fleeing domestic violence.
1.8. Sections 5 to 8 of this Strategy take each theme in turn and examine the relevant data sources, identify the issues faced
and what the Council commits to doing in order to achieve the key objectives.
1.9. These commitments are gathered together in an Action Plan which identifies timescales, priorities and the parties
responsible for delivering them. Progress made against this Action Plan will be monitored and reported upon annually.
52. Introduction
2.1. As a statutory housing authority Bedford Borough Council (the Council) is responsible for producing a Housing Strategy
that details its vision for housing and which sets out objectives, targets and policies on how it intends to manage and
deliver its strategic housing role. The Housing Strategy also provides an overarching framework against which the
Council considers and formulates other policies on more specific housing issues.
2.2. This Strategy fulfils this for the period 2021 – 2026 by:
Establishing the national legislative and policy contexts in which the Council’s housing function must be delivered and
summarising what the Council has done to date to address them.
Identifying the local strategies and plans to which housing objectives must align and how they do so
Illustrating the relationship between the Housing Strategy, its key inputs and the outcomes needed to address
housing issues.
Identifying the four overarching housing themes for Bedford Borough which are:
Understanding Housing Needs
Delivering the Homes Required
Making Best Use of Existing Housing and
Meeting the Housing Needs of Vulnerable People
In relation to these themes:
Detailing and analysing key data sources
Establishing the issues for Bedford Borough during the lifetime of this strategy
Identifying the actions necessary to address these issues and
Committing to deliver them within available resources.
6 Providing an Action Plan which sets targets and timescales for the delivery of these actions and which will be
monitored and reported against.
2.3. There are major potential changes in both the national and local operating environments which may impact significantly
on housing and the local housing market during the period covered by this Strategy. Most notably these are:
Central government’s commitment to delivering its vision for the Oxford – Cambridge Arc (the Arc) – to which Bedford
Borough is central - including the ambition to deliver up to one million high-quality new homes across the Arc by
2050.
The delivery of East West Rail which could potentially release sites for housing growth. In January 2020 it was
announced that East West Rail will come through Bedford Midland station which could add to the desirability of
Bedford Borough as a place to live and increase the demand for housing.
Having adopted Local Plan 2030 in January 2020, the requirement to produce a new Local Plan which takes into
account the revised National Planning Policy Framework (NPPF) issued in February 2019.
The potential for ongoing changes in the planning system including how the amount of housing which must be
delivered through local plans is calculated, how sites are allocated for housing and the introduction of new affordable
home ownership products.
Housing demand uncertainty in the post Brexit era
The aftermath of the Covid-19 Pandemic.
2.4. Significant achievements during the period covered by the previous Housing Strategy Review 2016 – 2020 are shown
below. The challenge is for the Council and its partners to build upon these successes, working proactively together in a
changing environment to meet the housing needs of the Borough’s citizens identified in this new five year strategy.
7Successes Since the Housing Strategy Review 2016 – 2020
Strategic Housing Market Assessment 2016 and its 2018 Update undertaken and published.
Gypsy and Traveller Accommodation Assessment 2017 commissioned and published.
Local Plan 2030 – prepared and adopted - with full input on housing policies from Housing Strategy Team
Prepared, adopted and published:
Learning Disabilities Accommodation Strategy 2017 – 2022
Mental Health Accommodation Strategy 2018 – 2023
Older Persons Accommodation Strategy 2018 – 2023
Homelessness Strategy 2016 – 2021
Empty Homes Strategy 2019 – 2024
Tenancy Strategy 2019 – 2024
Requirements of the Homelessness Reduction Act 2017 implemented
Administration of the Housing Register returned to Council from bpha
Secured more than £2.5m under a number of external funding initiatives to help tackle rough sleeping
15 bedspace ‘somewhere safe to sleep hub’ opened and occupied
Reduced the estimated number of people sleeping rough from 59 in November 2016 to 30 in November 2019.
Numbers peaked at 76 in 2017
29 dwelling scheme for those with complex needs facilitated and delivered
Self and Custom Housebuilding Register established and maintained
8 3964 total homes completed in the three years April 2016 to March 2019 - against a target of 2910
890 affordable homes delivered in the three years April 2016 to March 2019 against a target of 768
17 affordable homes completed on two rural exception schemes – the first such schemes in the Borough for 10
years
Additional Houses in Multiple Occupation licencing scheme introduced
443 adaptations funded by Disabled Facilities Grant completed between 2016 and 2019
Housing Assistance Policy developed, adopted and published
Building Research Establishment report on private sector housing commissioned, completed and published
306 empty properties brought back into occupation between 2016-2019 with the Council’s active intervention
Reduced the number of homes empty for more than 5 years between August 2016 and August 2019 by 19%
Two affordable housing schemes - Derwent Place Bedford and Mill Road, Sharnbrook - shortlisted for National
Housing Awards
Planning permission granted - including negotiation of Affordable Housing Schemes – for major strategic sites
including: Land North of Bromham Road, Biddenham, Land South of Fields Road, Wootton and further
significant phases of RAF Cardington and Wixams.
Establishing a Housing Committee as a sub- committee of the Council’s Executive to consider specific housing
related matters
93. The National Context
3.1. During the period covered by the previous Housing Strategy and its Review, there have been a number of national
legislative and policy changes that have impacted upon housing generally and the way in which the Council meets the
housing needs of its citizens in particular. The following is an overview of the main changes, their significant implications
for housing and the actions the Council has taken to date in response to them.
Localism Act 2011
3.2. The Localism Act 2011:
Permitted Councils to discharge their duty to house homeless households by identifying for them suitable
accommodation in the private rented sector
Allowed Councils more flexibility in setting Lettings Policies for their own affordable housing to meet local needs and
circumstances
Allowed Councils to introduce additional eligibility criteria in their Allocation Schemes for affordable housing
Enabled public sector landlords to offer "flexible" or fixed term tenancies of a recommended minimum of 5 years
Put in place mechanisms for local communities to develop Neighbourhood Plans for their area
3.3. The Council has used the new powers as part of a portfolio of tools to help statutory homeless households by identifying
suitable private rented accommodation for them. Between April 2016 and March 2019 there were 71 offers of
accommodation in the private sector made to homeless households of which 52 were accepted.
3.4. The Council does not own affordable housing having transferred its stock to bpha (formerly Bedfordshire Pilgrims
Housing Association) in 1990. It does not, therefore, let its own properties to which fixed term tenancies might apply.
3.5. However, to meet the requirements of the Localism Act 2011 the Council developed and adopted its Tenancy Strategy
2019 – 2024 which provides guidance to Registered Providers on how the Council believes they should apply fixed term
10tenancies. It also completed a Fixed Term Tenancy Review at the end of 2019 to identify the impact of the introduction
of fixed term tenancies by its Registered Provider partners. Both documents are available here:
https://www.bedford.gov.uk/housing/housing-strategies-and-policies/housing-development-and-policy/
3.6. The Council reviewed its Allocation Scheme in 2013 specifically to respond to the Localism Act. The review introduced a
local connection eligibility criteria, increased the degree of housing need required to access the register and redefined
the banding criteria to ensure those in the highest need were given highest priority.
3.7. The Council has worked with local communities to support the development of Neighbourhood Plans. At February 2020
there were 21 designated neighbourhood areas nine of which have reached pre- submission consultation stage. Three
had progressed to examination of which two had been approved at referendum.
Welfare Reform Act 2012
3.8. The Welfare Reform Act 2012:
Introduced Universal Credit which replaced a range of means tested benefits and tax credits for people of working
age.
Restricted Housing Benefit entitlement for social housing tenants whose accommodation is larger than they need.
3.9. Under Universal Credit claimants must wait for one week to receive benefits and are paid monthly in arrears thereafter.
This poses financial challenges for recipients and could impact on the ability of some of the most vulnerable households
to sustain their tenancies, particularly those who live in private rented accommodation where the implementation of
terms of tenancies are likely to be less flexible.
3.10. To help vulnerable households affected by these changes the Council introduced a Local Welfare Provision Policy in
April 2013. This provides assistance to the most vulnerable residents in the form of crisis grants and community support
grants for essential household items, subject to funds being available.
The Council’s Local Welfare Provision Policy is available here:
11https://www.bedford.gov.uk/benefits-and-support/benefits-council-tax-support/local-welfare-provision/
Care Act 2014
3.11. Whilst The Care Act 2014 primarily focuses on how Councils determine who is eligible for care support and how that
support is funded it also introduced a general duty on local authorities to promote an individual’s ‘wellbeing’. This can,
amongst other things, include the suitability of living accommodation which may impact upon a person’s physical, mental
and emotional health.
3.12. The Council has developed and adopted specific accommodation strategies for vulnerable groups: those with learning
disabilities, mental health issues and for older persons. An accommodation strategy for those with physical disabilities is
in development. These strategies are available here:
https://www.bedford.gov.uk/housing/housing-strategies-and-policies/housing-development-and-policy/
Self-build and Custom Housebuilding Act 2015
3.13. The Self-build and Custom Housebuilding Act 2015, and the associated Self-build and Custom Housebuilding
Regulations 2016 require Councils to:
Maintain a register of people who are interested in acquiring a serviced plot of land in their area in order to build a
house for them to live in as their home (the Self Build Register)
Have regard for the demand for self-build and custom build housing - as evidenced by the Self Build Register -
when developing housing and planning policies and when they dispose of land in their ownership
Grant planning permission for sufficient self-build/custom housebuilding plots to meet the demand on the Self Build
Register over a rolling three-year period
3.14. The Council established a Self-Build and Custom Housebuilding Register in 2016. All those on the Register were asked
to confirm their ongoing interest in August 2019.
123.15. Draft Policy 62 of Local Plan 2030 required sites of 100 dwellings or more to provide a minimum of 10% of dwelling
numbers to be made available as serviced plots for custom or self- builders. This policy was not supported by the Local
Plan Inspectors and it was removed as part of the modifications process. Whilst acknowledging that general support
for self-build was in line with national guidance the inspectors considered that there was insufficient evidence at the time
of the inquiry to support a 10% self build plot requirement in the Draft Plan. This was in part due to the need to ask
those on the Self Build Register to confirm that they wanted to remain on it. This review has since been undertaken.
General support for self-build is however maintained through adopted Policy 59S.
3.16. The Council has agreed a protocol that makes available information on the disposal of single plots in its ownership to
those on the Self Build Register in advance of general marketing.
3.17. As at October 2019, permissions sufficient to meet the need established by the Self Build Register have been granted by
the Council.
Housing and Planning Act 2016
3.18. The Housing and Planning Act 2016:
Required Councils to consider the sale of vacant council housing
Introduced Starter Homes as an affordable home ownership housing category on new build developments
Introduced a national data base of rogue landlords and property agents with powers to ban repeat offenders
3.19. The Council does not own affordable housing stock and thus the requirement to consider sale of vacant stock does not
apply in Bedford Borough.
3.20. Policy 58S of the Council’s Local Plan 2030, adopted in January 2020, allows for the provision of ‘Intermediate Tenure’
housing on new developments. The definition of Intermediate Tenure in the NPPF 2019 includes Starter Homes.
133.21. The Council keeps the activities of landlords and property agents under review. There have not been any activities in
the Borough that have fulfilled the criteria for entry onto the national database of rogue landlords and agents since its
introduction.
Homelessness Reduction Act 2017
3.22. The Homelessness Reduction Act 2017:
Placed duties on Councils to intervene at earlier stages to prevent homelessness
Required Councils to provide homelessness services to all those affected not just those who have a ‘priority need’.
3.23. The Council has introduced systems and processes to implement these requirements including restructuring the Housing
Services team to ensure appropriate resources are in place to meet the new requirements.
The Rough Sleeping Strategy August 2018
3.24. The Ministry of Housing, Communities and Local Government (MHCLG) published its Rough Sleeping Strategy in
August 2018. Its stated aim is to halve rough sleeping by 2022 and end it permanently by 2027.
3.25. It required Councils to update their Homelessness Strategies to include rough sleeping by winter 2019.
3.26. The Council combined its Rough Sleeping and Homelessness Strategy Action Plans in November 2019.
3.27. The Council secured almost £700,000 in additional funding for 2018 / 19 and 2019 / 20 from the Rough Sleeper Initiative
to support actions to reduce rough sleeping.
3.28. It has implemented a number of additional measures including the opening of a 29 dwelling complex needs scheme, the
opening of a 15 bedspace ‘somewhere safe to stay hub’ and the appointment of a Rough Sleeper Co-ordinator and six
additional third sector support workers.
3.29. These initiatives helped achieve a 60% reduction in the number of people sleeping rough during the period November
2017 – 2019, reversing the upward trend seen in previous years.
14The Oxford-Cambridge Arc
3.30. In March 2019 MHCLG published the paper ‘The Oxford-Cambridge Arc: Government ambition and joint declaration
between Government and local partners’. This identified the area between the two cities – including Bedford Borough -
as an area of significant economic potential and provided an update on the emerging approach of central government
and local partners to support growth and prosperity in the area.
3.31. Delivery of this vision is a key economic priority for central government, and includes an ambition to deliver up to one
million high-quality new homes across the Arc by 2050 and the completion of East West Rail and the eastern section of
the proposed Expressway (from the M1 to Cambridge).
3.32. The Council is engaged in discussions with local authorities across the Arc and other key strategic partners to explore
opportunities for growth in the Arc.
3.33. In February 2020 it was announced that the route of East West Rail would come through Bedford Midland Station.
National Planning Policy Framework 2019
3.34. The National Planning Policy Framework (NPPF) sets out the Government’s planning policies for England and how
these should be applied. The NPPF 2012 was replaced by a revised and updated framework in February 2019.
3.35. The 2019 NPPF contains a number of changes that impact significantly on the delivery of housing. These include:
A revised methodology for calculation of local housing need
Introduction of a minimum size of site to which an affordable housing policy requirement can be applied
New policy on what can be counted towards five year land supply
Amendment of the definition of Affordable Housing to include new forms of affordable home ownership products.
153.36. The Council’s Local Plan 2030, adopted in January 2020, was developed in accordance with the requirements of the
2012 NPPF. A new Local Plan must be developed to accord with the 2019 NPPF during the lifetime of this Housing
Strategy.
4. The Bedford Borough Context
4.1. Strategies and Plans
4.1.1. The Council and its partners have adopted a number of Strategies and Plans which form the local context in
which this Housing Strategy must be delivered. Many of them intentionally contain similar themes, goals and
priorities.
4.1.2. These strategies and plans are identified below along with the aims or objectives to which the provision of
housing can make a significant contribution.
Sustainable Community Strategy 2009-2021
4.1.3. The Sustainable Community Strategy was produced in 2009 by the Bedford Borough Partnership. It’s
preparation was overseen by the Partnership Board which brought together representatives from Bedford
Borough Council, the Police, NHS Bedfordshire, parish and town councils, schools, voluntary organisations,
business and community groups. Those representatives no longer meet under the umbrella of the Partnership
Board but continue to work jointly on a range of strategic and local issues.
4.1.4. Whilst the Deregulation Act 2015 removed the duty for local authorities to prepare a Sustainable Community
Strategy, the existing Strategy still sets the overall strategic direction and vision for promoting and improving
the economic, social and environmental well-being of the Borough.
4.1.5. The Strategy has seven goals: A Thriving, Greener, Aspiring, Healthy, Safer, Inclusive and Growing Borough
each of which has a series of aims which detail how the goals will be achieved.
16Bedford Borough the Place to Grow: Bedford Borough Corporate Plan 2017-2021
4.1.6. The Corporate Plan is part of the Council’s adopted Policy Framework and contains its contribution to the
delivery of the Sustainable Community Strategy.
4.1.7. It identifies four main goals:
Support people
Enhance places
Create wealth
Empower communities
The Sustainable Communities Strategy 2009 – 2021 and Bedford Borough the Place to Grow: Bedford
Borough Corporate Plan 2017-2021are available here:
https://www.bedford.gov.uk/council-and-democracy/about-the-council/key-plans-and-strategies/
Bedford Borough Joint Health and Wellbeing Strategy 2018-2023
4.1.8. The Joint Health and Wellbeing Strategy was developed by the Borough Council in partnership with those who
commission services across the NHS, public health, adult social care and children’s services and local
Healthwatch representatives.
4.1.9. It identifies three priorities: give children and young people the best start in life; enable adults and older people
to live well and remain independent and empower residents to create strong, safe and healthy communities.
The Joint Health and Wellbeing Strategy 2018 – 2023 is available here:
https://www.bedford.gov.uk/social-care-health-and-community/health-and-wellbeing-board/
174.1.10. It is underpinned by the Joint Strategic Needs Assessment (JSNA) a local assessment of current and future
health and social care needs. The latest summary of the JSNA – which acknowledges the role played by warm,
secure and safe housing on health and wellbeing (page 13) and considers homelessness and health (page 26)
- is available here:
https://bbcdevwebfiles.blob.core.windows.net/webfiles/Social%20Care%20Health%20and%20Community/Bedf
ord%20JSNA/JSNA-Annual-Summary-2019.pdf
Bedford Borough Growth Plan 2018-2022
4.1.11. The Bedford Borough Growth Plan supports business growth and aims to attract new investment into the
Borough.
4.1.12. It’s three broad themes of: grow business, enhance place and develop people have five priorities: to support
the growth of start-up and existing businesses; attract new business to Bedford Borough; bring forward
employment sites faster; promote the vitality of Bedford’s Town Centre and support local people into local jobs.
It also states that the Plan will support the development and delivery of strategic housing sites.
The Bedford Borough Growth Plan 2018 – 2022 is available here:
https://www.bedford.gov.uk/business/invest-in-bedford/bedford-borough-growth-plan-2018-0-22/
South East Midlands Local Enterprise Partnership Strategic Economic Plan 2017
4.1.13. The South East Midlands Local Enterprise Partnership (SEMLEP) was established in 2011. Its aim is to unlock
the growth potential of the South East Midlands by bringing together partners from the public, private,
education and not-for-profit sectors to secure infrastructure investment, develop a skilled workforce that meets
employer’s needs and provide business growth advice and access to finance to support key sectors.
4.1.14. The SEMLEP Economic Plan has seven priorities spread over the four themes of growing business; growing
people; growing places and cross-cutting.
184.1.15. The Partnership administers the Government’s Local Growth Fund to help unlock the delivery of housing sites.
How Housing Relates to the Common Objectives of These Strategies
4.1.16. The delivery of suitable, high quality housing contributes to the common aims and objectives of these
Strategies and Plans by providing stable homes which can:
Support the physical and mental health of residents. This is particularly the case where specialist housing
is provided for those who are vulnerable
Enable people to feel part of a settled community, relationships and support networks to be established and
communities to develop and thrive
Deliver enhanced social infrastructure such as open space, meeting places, medical facilities etc on
strategic sites
Enhance physical places by improving visual amenity. This is particularly the case where schemes involve
the redevelopment of brownfield sites or are regeneration initiatives
Contribute to the creation of wealth by providing the workforce with access to affordable housing and
creating jobs within the housing development, construction and associated industries
Help deliver the housing aspirations set out in growth strategies.
4.1.17. Figure 1 shows the Housing Strategy’s relationship to the national legislation, evidence and strategies that
inform it and the outputs that in turn are informed by the Housing Strategy. The outputs are identified by its
four themes.
19Figure 1: Housing Strategy Relationship Chart – Information Inputs and Outcomes
Figure 2 shows the hierarchical relationship between the Housing Strategy and other strategies and plans of
the Council.
20Figure 2: Housing Strategy Relationship Chart – Bedford Borough Council Strategy Hierarchy
4.2. Demographic Context – Understanding Our Population
The following information assists in understanding the demographic breakdown of the citizens of Bedford Borough. It is
primarily based on data from the 2011 Census which will be updated during the lifetime of this Housing Strategy. The
age of the data is a limitation on the degree to which it might be relied upon, nonetheless a broad understanding the age,
economic and ethnic profile of the Borough and how Bedford Borough compares to other areas assists in understanding
potential housing issues.
21It will be necessary to update the demographic knowledge base following the 2021 census and incorporate updated
information into new housing sub strategies as they are revised and updated.
4.2.1. Population Growth
Table 1 and Figure 3 show population forecasts for Bedford Borough, England and East of England up to 2040.
The population of Bedford Borough is forecast to rise from 176,776 in 2020 to 205,257 in 2040, a rise of 16.1%.
Over the same period the population of the East of England is forecast to rise by 11.4% and that of England by
6.8%. The forecast rise in Bedford Borough reflects the growth aspirations of central government. The largest
estimated population increases for Bedford Borough are between 2020 and 2026 – the period covered by this
Housing Strategy. The importance of continuing to meet targets for the delivery of the new homes needed to
accommodate forecast population growth is acknowledged in Theme 2 – Delivering the Homes Required.
Table 1: Forecast Population Growth – Bedford Borough, England and East of England to 2040
East of
Bedford Bedford England East of England
Borough Borough Estimated England % England %
Year Estimated % Increase (millions) Increase Estimated Increase
2019 174,812 66.8 6,269,300
2020 176,776 1.12 67.2 0.60 6,316,300 0.75
2021 178,675 1.07 67.5 0.45 6,362,300 0.73
2022 180,504 1.02 67.8 0.44 6,407,000 0.70
2023 182,274 0.98 68.1 0.44 6,450,000 0.67
2024 184,002 0.95 68.4 0.44 6,492,200 0.65
2025 185,675 0.91 68.7 0.44 6,533,300 0.63
2026 187,313 0.88 68.9 0.29 6,573,400 0.61
2027 188,874 0.83 69.2 0.44 6,612,000 0.59
2028 190,374 0.79 69.4 0.29 6,649,500 0.57
2029 191,820 0.76 69.6 0.29 6,685,900 0.55
2030 193,222 0.73 69.8 0.29 6,721,000 0.52
222031 194,558 0.69 70.1 0.43 6,755,100 0.51
2032 195,844 0.66 70.3 0.29 6,788,500 0.49
2033 197,092 0.64 70.5 0.28 6,821,300 0.48
2034 198,311 0.62 70.7 0.28 6,853,400 0.47
2035 199,490 0.59 70.9 0.28 6,884,600 0.46
2036 200,665 0.59 71.1 0.28 6,915,600 0.45
2037 201,825 0.58 71.3 0.28 6,946,200 0.44
2038 202,973 0.57 71.4 0.14 6,976,500 0.44
2039 204,115 0.56 71.6 0.28 7,006,900 0.44
2040 205,257 0.56 71.8 0.28 7,037,400 0.44
Source: ONS, 2016-based Subnational Population Projections
Figure 3 Forecast Population Growth – Bedford Borough, England and East of England to 2040
18.00
16.00
14.00
Cumulitive Percentage Increase
12.00
10.00
8.00
6.00
4.00
2.00
0.00
2020 2025 2030 2035 2040
Bedford Borough % Increase England % Increase
East of England % Increase
234.2.2. Age
The most significant age related housing issue facing the Borough during the lifetime of this strategy is meeting
the accommodation needs of an aging population.
Figure 4 shows age range of the population of Bedford Borough as at the 2011 Census.
Figure 4: Age Breakdown of Bedford Borough, England and East of England’s Residents 2011 (Percentage of
Population)
Source: Census 2011
The older persons’ population was estimated to increase nationally by 90% over the 20 years following the
2011 census. It is forecast that the national increase will largely be in the population aged 80 and over,
24reflected in the 2011 Census data for Bedford Borough where almost 16% of the population was aged 65 and
over (Housing LIN (December 2011) ‘Strategic Housing for Older People: A resource pack’).
The Council’s Older Persons Accommodation Strategy 2018 – 2023 (OPAS) contains the strategy for meeting
the accommodation needs of those aged 65 and over during the five years it covers and the delivery of its
objectives is reflected in Theme 4 –Meeting the Needs of Vulnerable People.
Further extensive detailed analysis of age related demography in the Borough is contained within the OPAS
and its Appendices. The OPAS will be updated during the lifetime of this strategy and will contain and consider
updated demographic information following the census undertaken in 2021.
4.2.3. Income and Employment
Table 2 shows the median earnings (gross weekly pay) in Bedford Borough, the East of England and England
in 2018.
Median earnings in Bedford Borough were £577, lower than those for the East of England (£590) and England
(£591). This is reflected in the hourly pay which was lower for Bedford Borough (£14.41) when compared to
the East of England (£14.77) and England (£14.94).
Table 2: Median earnings for people living in Bedford Borough, East of England and England (2018)
Bedford East of
England
Borough England
(£)
(£) (£)
Gross weekly pay
Full time workers 577 590 591
Hourly pay (excl overtime)
Full-time workers 14.41 14.77 14.94
Source: NOMIS
25Table 3 shows the employment status of adults in Bedford Borough, England and the East of England April
2018 – March 2019. 80.6% of those aged 16 and over in Bedford Borough were economically active of which
77.7% were in employment. This is broadly consistent with data for the East of England (81.2% of which 78.4%
in employment) and England (80.0% of which 76.9% in employment). Bedford Borough had a lower proportion
of people who were self-employed (9%) than the East of England (11.4%) and the United Kingdom as a whole
(10.7%).
Table 3: Employment Status of those aged 16 and over in Bedford Borough, East of England and England
(April 2018 - March 2019)
East of
Bedford Bedford England
England
Borough Borough
(%) %
(Number) (%)
Economically Active 89,400 80.6 81.2 80.0
Total In Employment 86,300 77.7 78.4 76.9
Of which: Employees 76,800 68.7 66.8 64.4*
Self employed 9,400 9.0 11.4 10.7*
Unemployed 3,600 4.0 3.4 4.1*
*United Kingdom
Source: NOMIS, figures do not sum in NOMIS
Table 4 shows the number and percentage of the population of Bedford Borough and the percentage of the
population of the East of England and England who were economically inactive between April 2018 – March
2019.
19.4% of those aged 16-64 in Bedford Borough were economically inactive. This is slightly higher than in the
East of England (18.8%) but slightly lower than for England as a whole (20.9%). Reasons for economic
inactivity include being a student, looking after family / home, long term sick and retired.
Of those economically inactive in Bedford Borough 23.1% were retired. This is significantly more than the East
of England (16%) and England (12.5%). This supports the evidence of an aging population in Bedford
Borough.
26Table 4: Economic Inactivity in Bedford Borough and East of England, people aged 16-64 (April 2018 – March
2019)
Bedford
Bedford East of
Borough England (%)
Borough (%) England (%)
(Number)
Total Economically
20,400 19.4 18.8 20.9
Inactive
% of those % of those % of those
Of those economically
Number economically economically economically
inactive:
inactive inactive inactive
Student 4,400 21.5 23.1 27.0
Looking after family/home 4,200 20.8 25.3 24.3
Long-term sick 4,300 20.8 21.6 22.4
Retired 4,700 23.1 16.0 12.5
Other 2,800 14.0 14.0 14.0
TOTAL 20,400 100 100 100
Source: NOMIS
Table 5 shows the number and percentage of households in Bedford Borough and the East of England that
were workless in 2018. Data is not available for England. A household is workless when no one in the
household is in employment. There were 8,500 workless households in Bedford Borough between January
and December 2018. The percentage of households that were workless (14.7%) in Bedford Borough was
higher than the East of England percentage (12.2%) but broadly similar to the United Kingdom as a whole
(14.3%).
27Table 5: Workless Households in Bedford Borough (January – December 2018)
Bedford East of United
Borough England Kingdom*
Number of Workless
8,500 238,200 2.920m
households
Percentage of households
14.7 12.2 14.3
that are workless
Source: NOMIS
*data not available for England
The Strategic Housing Market Assessment (SHMA – see Section 5.2.1) predicts that the economically active
population will increase by around 9,800 persons over the 20-year period 2015-2035, concluding that taking
into account identified changes in double jobbing the increase in resident workers could support up to 11,400
additional jobs in Bedford during that time. This workforce will require housing that is suitable – in terms of
location, affordability, size and tenure – the delivery of which is a focus of Theme 2 of this strategy ‘Delivering
the Homes Required’.
Table 6 shows the number and percentage of out of work benefits claimants for Bedford Borough and the
percentages for the East of England and England August 2014 – August 2019.
In common with the East of England and England, Bedford Borough saw a decrease in the percentage of work
benefit claimants between August 2014 and August 2016 after which the percentages increased to their
highest levels in the 5 year period at August 2019. Universal Credit was introduced in Bedford Borough in May
2017 which was relatively early in the national roll- out programme. Universal Credit rules require a wider range
of claimants to look for work than those claiming the previously applicable Jobseeker's Allowance. This may
help explain the increase in all areas in the later years of the period.
28Table 6: Out of Work Benefits - Claimants aged 16-64 in Bedford Borough August 2014 – August 2019
Aug-14 Aug-15 Aug-16 Aug-17 Aug-18 Aug-19
Bedford Borough 2,690 2,315 2,135 2,380 3,160 3,545
Bedford Borough (%) 2.6 2.2 2 2.3 3 3.4
East of England (%) 1.7 1.3 1.2 1.3 1.5 2.1
England (%) 2.6 2.1 2.1 2.1 2.4 3.2
Source: NOMIS
4.2.4. House Prices, Rents and Affordability
Table 7 shows that average property prices in Bedford Borough for all property types increased steadily
between October 2015 and October 2018. They then decreased slightly for all property types in the year to
October 2019. The percentage increase for all properties over the period was 23.4%. This percentage
increase is broadly consistent across the house-types.
Table 7: Average House Prices in Bedford Borough by Property Type October 2015 – October 2019
Increase
Oct-15 Oct-16 Oct-17 Oct-18 Oct-19
Oct 15 – Oct 19
Detached £375,568 £433,742 £459,196 £470,856 £467,791 24.6%
Semi £228,030 £263,347 £278,967 £286,738 £284,918 24.9%
Terraced £182,326 £209,279 £220,665 £226,116 £223,526 22.6%
Flat £135,096 £156,198 £167,668 £168,276 £162,489 20.3%
All £232,835 £268,492 £284,696 £290,994 £287,412 23.4%
Source: landregistry.data.gov.uk
Table 8 shows median monthly rents in Bedford Borough by property type between 2014 / 15 and 2018 / 19
and the percentage by which they have increased during that period. The average increase across all
property types is 19.2%. The highest increases are in the studio and 4 bedroomed plus properties, although
the increase in the 4 bedroomed plus properties occurred in 2014 / 15 and this has since stabilised.
29Table 8: Median Monthly Rent Values in Bedford Borough
2014/15 2015/16 2016/17 2017/18 2018/19 Increase
Room £350 £350 £365 £420 £395 12.9%
Studio £350 £450 £450 £475 £458 30.9%
1 bedroom £495 £525 £575 £600 £595 20.2%
2 bedroom £650 £695 £750 £750 £750 15.4%
3 bedroom £750 £815 £895 £895 £900 20.0%
4 or more bedrooms £1,000 £1,250 £1,250 £1,250 £1,250 25.0%
All Categories £650 £695 £750 £775 £775 19.2%
Source: Valuation Office Agency
The affordability ratio shows the relationship between median house prices and median incomes. It is used by
the NPPF 2019 as part of the Standard Methodology for calculating Objectively Assessed Need for housing for
planning purposes. Table 9 shows the affordability ratio for local authorities in Bedfordshire, selected local
authorities from adjoining counties and for England and the East of England for the period 2012 -2018.
The affordability ratio for Bedford Borough rose from 7.32 to 9.82 over the period 2012 – 2018, a rise of 34%.
In the same period the affordability ratio for England rose from 6.77 to 8.00 (18.2%) and for the East of
England from 6.79 to 9.12 (34%). The rise in the affordability ratio in Bedford Borough is therefore consistent
with the East of England but significantly greater than that of England as a whole. Housing markets are
generally more localised so this is not counter intuitive. In 2018 Bedford Borough had the second highest
affordability ratio of the Bedfordshire and adjoining local authorities, though some from neighbouring counties
(without an adjoining boundary with Bedford Borough – Cambridge and South Cambridgeshire for example)
had higher ratios.
Table 9: Affordability Ratios for Bedfordshire and Selected Neighbouring Local Authorities, England and East
of England between 2012 and 2018
Local Authority 2012 2013 2014 2015 2016 2017 2018
30Bedfordshire:
Bedford 7.32 7.31 7.94 8.43 8.55 9.35 9.82
Central Bedfordshire 7.85 7.75 8.60 9.51 10.44 10.57 10.86
Luton 6.08 5.93 6.40 6.34 7.31 7.36 8.35
Milton Keynes 6.55 6.61 6.84 7.74 7.63 8.66 8.81
Cambridgeshire:
Peterborough 5.01 5.07 5.54 5.76 5.93 6.64 6.79
Cambridge 9.44 9.61 11.39 12.55 13.00 13.53 12.95
Huntingdonshire 6.89 6.96 7.11 8.06 8.22 8.82 9.44
South Cambridgeshire 7.42 7.74 7.80 9.15 10.26 10.98 10.25
Northamptonshire:
Corby 5.08 5.48 5.53 5.88 5.96 6.36 6.68
Daventry 6.86 6.87 7.82 7.99 10.29 10.22 10.27
East Northamptonshire 6.32 5.73 6.71 6.81 7.92 8.29 8.45
Kettering 5.25 5.86 6.04 6.08 6.56 7.02 7.81
Northampton 5.36 5.26 6.14 6.69 6.84 7.28 7.60
South Northamptonshire 9.11 8.46 8.55 9.83 10.72 10.30 10.49
Wellingborough 5.79 6.18 6.25 7.26 7.27 7.49 7.40
England 6.77 6.76 7.09 7.53 7.72 7.91 8.00
East of England 6.79 6.94 7.30 7.86 8.33 9.10 9.12
Source: Office for National
Statistics
Figure 4 shows affordability ratios for Bedfordshire local authorities and those adjoining Bedford Borough.
Bedford Borough has the second highest affordability ratio of geographically collocated local authorities.
31Figure 4: Affordability Ratios – Bedfordshire Local Authorities and Those Adjoining Bedford Borough 2012 -
2018
As part of its determination of Market Signals the SHMA considers in significant detail the affordability of both
open market sale (Local House Prices, para 5.59ff, p105) and private rented (Private Rent, paras 5.66ff, p106)
tenures. Affordability has, therefore, been taken into account in determining the level of affordable housing
required on new development schemes. A further summary of the key findings of the SHMA is included in
section 5.2 – Theme 1 – Understanding Housing Needs, Data Sources, below.
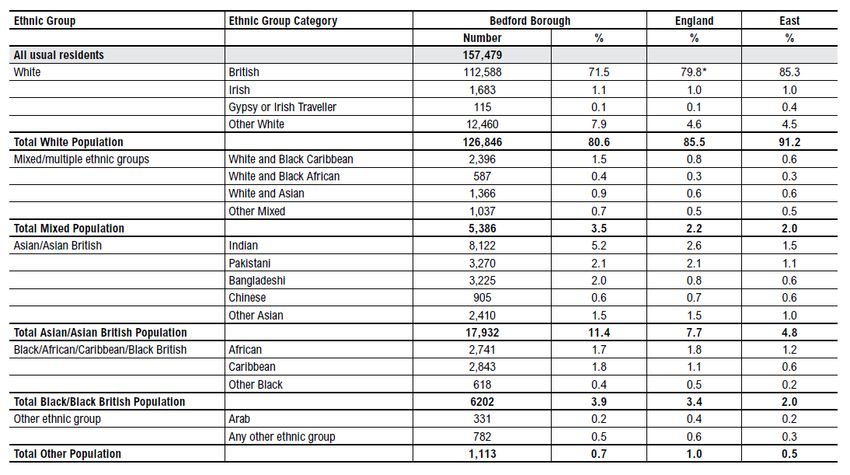
4.2.5. Ethnicity
Table 10 shows that at 2011 80.6% of the Boroughs population was from White Ethnic Groups. This is less
than for England (85.5%) and significantly less than for the East of England (91.2%).
32A total of 19.4% of Bedford Borough’s population was from Black and Minority Ethnic Groups in comparison to
8.8% in the East of England and 14.5% in England generally.
The most significant BME group in Bedford Borough was Asian/ Asian British (11.5%) of which Indian (5.2%)
was the largest group. Asian /Asian British comprise 7.7% of the population of England and 4.8% of the East of
England.
Bedford Borough also had a significant Black / African / Caribbean / Black British population (3.9%). Although
broadly similar to England (3.4%) this is almost double that for the East of England (2%).
Table 10 and Figure 5 show the ethnic breakdown of Bedford Borough in 2011 along with that of England and
the East of England.
Table 10: Ethnic Breakdown of Bedford Borough, England and East of England’s Population 2011
Source: ONS 2011 Census Data
33Figure 5: Ethnic Breakdown of Bedford Borough, England and East of England’s Population 2011
100
90
80
70
60
50
40
30
20
10
0
White Mixed/mulitple ethnic Asian/Asian British Black/Black British Other Ethnic Group
groups
Bedford England East of England
Source: ONS 2011 Census Data
345. Theme 1 – Understanding Housing Needs
5.1. Key Objective
The key objective in relation to Understanding Housing Needs is:
To ensure up to date information on the need for various forms of housing is available and understood such that it
can be used to inform decision making in relation to housing provision within the Borough and in determining
priorities.
5.2. Data Sources
The following are the key data sources relating to ‘Understanding Housing Needs’ and what each tells us:
5.2.1. Strategic Housing Market Assessment – Housing Needs
The Strategic Housing market Assessment (SHMA) was produced by Opinion Research Services in 2016 to
identify the Objectively Assessed Need for housing in support of draft Local Plan 2035. It was updated in 2018
to take into account a change of plan period to 2030. It identifies the housing required by tenure, size and mix
and provides information on the need for accommodation to meet specialist needs such as wheelchair adapted
housing.
Key housing needs findings of the SHMA are:
The objectively assessed need for housing for Bedford Borough for the 15 year period 2015 -2030 is 14,551
new dwellings - on average 970 per year.
The affordable housing requirement, included in the total of 14, 551 above, is for 4,188 dwellings – on
average 279 per year
An affordable housing requirement of 30% of new housing is needed.
Of the 30% affordable housing provision 78% should be for affordable rented and 22% for intermediate
tenure.
35 Starter Homes (a form of discounted market sale home ownership) does not address the same affordability
criteria as shared ownership. Any target for Starter Homes should be considered as being additional to the
overall affordable housing need that the SHMA identified.
49% of all new housing should meet building regulation M4 Category 2 Accessible and Adaptable Dwellings
5% of all market housing and 7% of all affordable housing should meet building regulation M4 Category 3 –
wheelchair user dwellings.
All specialist accommodation for older persons should achieve compliance with Category 3.
1,769 specialist homes for Older Persons are needed up to 2035. This includes around 900 sheltered
homes (535 owner occupied and 358 for rent) and almost 900 extra care homes (533 owner occupied and
343 for rent).
The SHMA 2016 and the 2018 Addendum are available here (Document 1)
https://edrms.bedford.gov.uk/PlanningBrowse.aspx?id=YusA5qiON3sL1VM1Bte50w%3d%3d
5.2.2. Rural Housing Needs Surveys
Rural Housing Needs Surveys provide housing needs information specific to individual rural settlements or
parishes.
In Bedford Borough they are usually - though not exclusively - undertaken by the Bedfordshire Rural
Communities Charity (BRCC) on behalf of parish councils in connection with potential rural exception schemes
or Neighbourhood Plan groups as part of the evidence base for their plans.
At February 2020 there were 16 rural housing needs surveys that had been published within the preceding five
years.
Thurleigh
Bletsoe
36 Colmworth
Bromham
Sharnbrook
Clapham
Ravensden
Oakley
Carlton and Chellington
Stagsden
Harrold
Felmersham and Radwell
Turvey
Wootton
Willington
Wilden
A further five are in production:
Wymington
Riseley
Little Staughton
Wilstead
Sharnbrook (update)
Individual surveys reveal detailed information on needs by tenure and property type and are available from the
organisations that commissioned them.
5.2.3. Self Build and Custom Housebuilding Register
The Self Build Register (see 3.13 above) helps the Council to understand the demand for self- build plots in the
Borough. As at 31st December 2019 there were 115 individuals and 1 Association on the register.
Table 11 shows the number of registrants by their stated preference for dwelling bedroom size.
37The majority of registrants (61%) expressed a preference for a plot which could accommodate a property with 4
or more bedrooms. Only one individual stated a preference for a plot sufficient for a 1 or 2 bedroom property.
Table 11: Bedroom Size Preference of Individuals on the Self Build and Custom Housebuilding Register
Number of Number of
bedrooms Individuals
1or 2 bed 1
2 bed 5
2 or 3 bed 1
3 bed 30
3 or 4 bed 10
4 bed 32
4 or 5 bed 12
5+ bed 18
1-5 beds 8
TOTAL 115
Source: Self Build Register
Registrants are also asked to provide details of their preferred location for a self-build plot. Co-located rural
areas are grouped for this purpose. Applicants are able to express a preference for more than one location.
Table 12 shows registrants preferences by location at December 2019:
Table 12: Location Preferences of Individuals on the Self Build and Custom Housebuilding Register
Number of
registrants
indicating a
preference for
Grouping Parishes in the Group location
Dean & Shelton, Melchbourne & Yielden, Knotting & 43
Group 1 Souldrop, Sharnbrook
Group 2 Wymington, Podington, Odell, Harrold 46
38Group 3 Pertenhall & Swineshead, Riseley, Bolnhurst & Keysoe 38
Little Staughton, Staploe, Colmworth, Wyboston Chawston &
45
Group 4 Colesden, Little Barford, Roxton
Group 5 Bletsoe, Thurleigh, Felmersham & Radwell, Milton Ernest 62
Group 6 Carlton & Chellington, Pavenham, Stevington 47
Group 7 Oakley 21
Group 8 Clapham 15
Group 9 Ravensden, Wilden, Renhold, Brickhill 67
Group 10 Bromham, Biddenham, Gt. Denham 78
Group 11 Turvey, Stagsden, Kempston Rural, Wootton, Stewartby 82
Group 12 Kempston Town 9
Group 13 Bedford Town 25
Group 14 Elstow, Wilshamstead, Wixams 27
Group 15 Cople, Cardington, Eastcotts 35
Group 16 Gt. Barford, Willington 25
Group 17 Any Of The Above 32
Group 18 Any Excluding Bedford & Kempston Towns 28
Source: Self Build Register
Rural areas in Groups 5, 9, 10 and 11 have the highest number of preferences. Only 25 preferences were
shown for Bedford Town and 9 for Kempston Town.
Table 13 shows the number of individuals on the Bedford Borough Self Build and Custom Housebuilding
Register 2015 – 2019. The Council has a duty to grant planning permission for sufficient plots suitable for self-
build / custom housebuilding to meet the demand on the register within 3 years of the recorded number on the
Register. The Council has met this obligation for 2015 / 16 by providing in excess of the 50 Register entrants
by 2018 / 19.
39Table 13: Number of Individuals or Associations on the Bedford Borough Self Build Register 2015 – 2019
Number on
Year
the
(October)
Register
2015/2016 50
2016/2017 137
2017/2018 172
2018/2019 110
Source: Annual Self Build Returns
5.2.4. Affordable Home Ownership – Help to Buy Agent Data
Information from the Help to Buy Agent provides data on the demand for shared ownership homes in Bedford
Borough.
The data available from the Help to Buy Agent for Bedford Borough reveals that 701 households had inquired
about shared ownership in Bedford Borough in 2019 / 20. Of these, 391 (55%) were recorded as looking for a
maximum of 2 or 3 bedrooms. The full breakdown provided is as follows:
22 stated a preference for a maximum of 2 bedroomed property
369 stated a preference for a maximum of 3 bedroomed property
196 stated a preference for a maximum of 4 bedroomed property
2 stated a preference for a maximum of 5 bedroomed property
112 did not specify a preference for bedroom size
The Help to Buy Agent has advised that these are ‘leads’ and that they are unable to confirm that all these
households would qualify for, or be able to afford, shared ownership.
Anecdotally they confirm that the average initial share being purchased by customers is reducing over time and
that the lack of availability of 4 bedroomed properties for shared ownership means that demand far exceeds
supply.
40Whilst this data is helpful, it is superficial and anecdotal. The availability of more robust data would better
inform the demand for shared ownership generally and the mix of house types in particular.
Notwithstanding this, the number of inquiries far exceeds the delivery of new shared ownership housing in the
Borough (see Table 18 below) – evidencing the ongoing relevance of it as an affordable home ownership
product.
5.2.5. Housing Register
The Council’s Housing Register provides information on the need for affordable and social rented properties in
the Borough.
Table 14 shows the total number of applicants on the Housing Register by application category by quarter over
the 12 months from September 2018 to September 2019. In 2019 new definitions of homeless relief,
prevention and homeless were added to the applicant categories.
Table 14: Total Registrants by Application Category
Applicant Category Sep-18 Dec-18 Mar-19 Jun-19 Sep-19
Homeless Accepted 68 99 74 120 103
Homeless Relief N/A N/A N/A 6 29
Homeless Prevention N/A N/A N/A 2 20
Homeless N/A N/A N/A 13 11
Housing Register 674 708 674 637 663
Transfers (bpha) 226 223 203 208 183
Other RP tenants 168 202 199 192 231
Sheltered 0 0 0 10 0
Total 1136 1232 1150 1188 1240
Source: Housing Register
The number of applicants on the Housing Register has increased from 1136 to 1240 in the year from
September 2018 to 2019, a rise of 9%. The number of Homeless Accepted increased from 68 in September
2018 to 103 in September 2019. The number of transfer applicants dropped from 226 to 183 whereas the
number of other Registered Provider tenants increased from 168 to 231 in this period.
41Table 15 shows the total number of applicants on the Housing Register by bedroom need by quarter over the
12 months from September 2018 to September 2019:
Table 15: Total Registrants by Bedroom Need
Number of bedrooms Sep-18 Dec-18 Mar-19 Jun-19 Sep-19
1 Bed 387 445 475 486 542
2 Bed 348 379 313 323 326
3 Bed 346 235 210 202 196
4 Bed 43 134 113 140 143
5 Bed 5 29 27 29 25
6 Bed 7 10 10 8 8
7 Bed 0 0 2 0 0
Total 1136 1232 1150 1188 1240
Source: Housing Register
The highest need at September 2019 was for 1 bedroom (44%) and 2 Bedroom (26%) dwellings, with 16%
demand for 3 bedroomed dwellings. A total of 70% of households on the Housing Register required a one or
two bedroom property.
During the period the demand for:
1 bedroomed properties increased steadily and significantly – from 387 to 542 properties (43%)
2 bedroomed properties decreased slightly from 348 to 326 properties (6%) but overall remained relatively
stable
3 bedroomed properties decreased significantly from 346 to 196 properties (43%)
4 bedroomed + properties increased significantly from a total of 55 properties to 176 properties (220%)
This is illustrated in Figure 6 below:
42Figure 6: Total Registrants by Bedroom Need
600
500
400
300
200
100
0
1 Bed 2 Bed 3 Bed 4 Bed 5 Bed 6 Bed 7 Bed
Sep-18 Dec-18 Mar-19 Jun-19 Sep-19
Source: Housing Register
Table 16 shows the total number of applicants on the Housing Register by banding priority over the 12 months
from September 2018 to September 2019:
43Table 16: Total Registrants by Band
Sep-18 Dec-18 Mar-19 Jun-19 Sep-19
Band A 95 101 93 90 95
Band B 233 275 222 260 246
Band C 631 672 650 640 683
Band D 7 9 7 5 6
Band S 165 175 178 192 208
Band E 0 0 0 0 0
Awaiting banding 5 0 0 1 2
TOTAL 1136 1232 1150 1188 1240
Source: Housing Register
At September 2019 of the 1240 applicants a total of 341 (28%) were in bands A (Urgent Housing Need) and B
(High Housing Need – Multiple Needs). The majority of households (55%) were in band C (Housing Need).
The relative size of the number of applicants in each banding has remained substantially the same over the
period as illustrated by Figure 7 below:
44Figure 7: Total Registrants by Band
800
700
600
500
400
300
200
100
0
Band A Band B Band C Band D Band S Band E Awaiting banding
Sep-18 Dec-18 Mar-19 Jun-19 Sep-19
Source: Housing Register
5.2.6. Gypsy and Traveller Accommodation Assessment 2017
The Gypsy and Traveller Accommodation Assessment (GTAA) 2017 was produced by ORS to support the
development of the local plan. It provides an assessment of the need for Gypsy and Traveller pitches and
Travelling Showpeople plots in the Borough up to 2035. It takes into account Planning Policy for Traveller Sites
(PPTS) 2015 which updated the definition of travellers such that those who have ceased to travel permanently
do not fall under the planning definition of a traveller for the purposes of assessing accommodation need.
45You can also read