STELLENBOSCH: SPATIAL TRANSFORMATION IN AN ASPIRING CITY OF OPPORTUNITY AND INNOVATION - July 2017 - SA Cities Network
←
→
Page content transcription
If your browser does not render page correctly, please read the page content below
STELLENBOSCH: SPATIAL
           TRANSFORMATION IN AN ASPIRING
              CITY OF OPPORTUNITY AND
                     INNOVATION
                              July 2017

Source: Unequalscenes, 2017

                              Report prepared by

                               Danie du Plessis
Stellenbosch | Page ii

                                                       Table of contents

1. INTRODUCTION .............................................................................................................. 5

2. DEMOGRAPHIC AND ECONOMIC OVERVIEW ............................................................. 6
   2.1 Overview of demographic characteristics and trends ................................................................... 6
   2.2 A brief overview of economic structure and performance ............................................................ 8

3. MAIN SPATIAL TRANSFORMATION ISSUES............................................................... 12

4. ALIGNMENT WITH OTHER SECTOR PLANS ............................................................... 15
   4.1      Provincial level plans ......................................................................................................... 15
   4.2      Municipal level plans ............................................................................................................. 17

5. OVERVIEW OF STELLENBOSCH SDF ......................................................................... 18
   5.1      Institutional setting and status of SDF .................................................................................. 18
   5.2      Expected outcomes of SDF .................................................................................................. 21
   5.3      Spatial concepts and proposals ............................................................................................ 24

6. ASSESSMENT OF STELLENBOSCH SDF .................................................................... 27
   6.1      Quality of the planning process ............................................................................................. 27
   6.2      General overview of plan quality ........................................................................................... 29
   6.3      Plan quality: Consideration of key spatial transformation principles ..................................... 31
   6.4      Implementation of SDF ......................................................................................................... 34

7. CONCLUSIONS ............................................................................................................. 36

BIBLIOGRAPHY ................................................................................................................. 42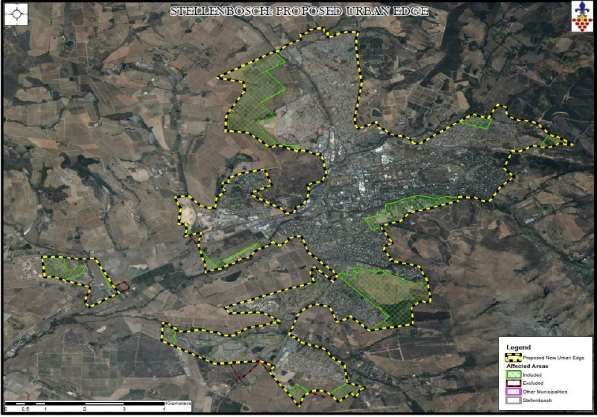
Stellenbosch | Page iii

                                          List of Figures

Figure 1: Spatial composition of Stellenbosch Municipality                                      5

Figure 2: Stellenbosch LM: Composition of gross value added and employment                      9

Figure 3: Security estate in rural area                                                         13

Figure 4: Informal housing in Kyamandi                                                          14

Figure 5: Growth potential of settlements and municipalities in the Western Cape                16

Figure 6: Western Cape Province consolidated framework proposals                                17

Figure 7: Stellenbosch land use change 2000 to 2010                                             22

Figure 8: Stellenbosch wine farms                                                               24

Figure 9: Stellenbosch SDF town analysis and proposals                                          25

Figure 10: Stellenbosch urban edge                                                              26

Figure 11: Stellenbosch University campus                                                       28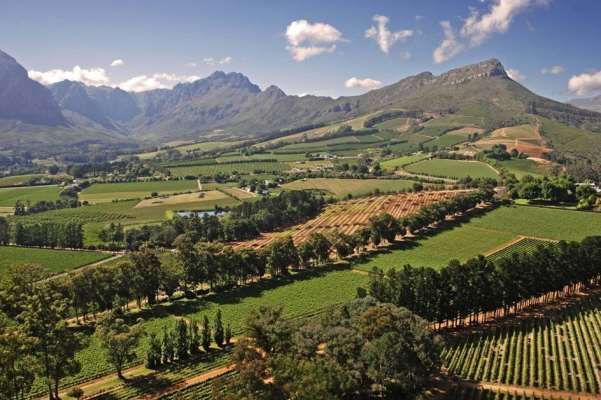
Stellenbosch | Page iv

                                          List of Tables

Table 1: Population and density trends                                                             6

Table 2: Access to basic infrastructure and housing                                                7

Table 3: Cape Winelands District municipalities: GDPR contribution and growth                      8

Table 4: Cape Winelands District municipalities: Employment creation                               9

Table 5: Stellenbosch employment status and income                                                 10

Table 6: Financial status                                                                          11

Table 7: Application of generic spatial planning concepts in Stellenbosch SDF                      30

Table 8: Assessment of relevance of IUDF policy levers and policy priorities to
Stellenbosch SDF                                                                                   37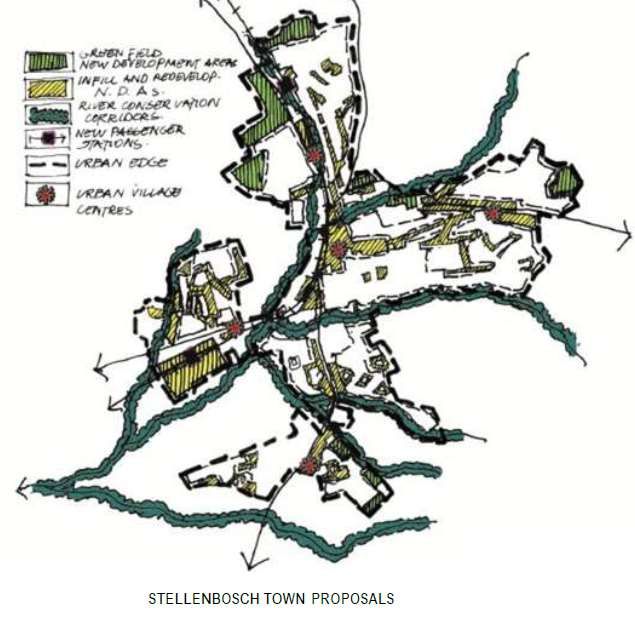
1. INTRODUCTION
Stellenbosch municipality forms part of the Cape Winelands District Municipality and
covers an area of approximately 831 km² with a population of 173 419 in 2016. The
municipality is characterized by a dispersed spatial settlement structure consisting of
13 identified nodes across the municipal area from Klapmuts in the north,
Franschoek in the east, Raithby in the south and Lynedoch in the west. The
municipal area includes the towns of Stellenbosch and Franschhoek, as well as a
number of rural hamlets such as Wemmershoek, La Motte, De Novo, Kylemore,
Pniel, Johannesdal, Languedoc, Groot Drakenstein, Muldersvlei, Klapmuts,
Elsenburg, Raithby, Jamestown, Koelenhof and Vlottenburg (most with a population
of less than 5 000) (Stellenbosch Municipality, 2016b).

Figure 1: Spatial composition of Stellenbosch Municipality

Source: Stellenbosch Municipality, 2017a

Stellenbosch town is the second oldest town in South Africa with its history dating
back to 1679 when the then Governor of the Cape, Simon van der Stel named an
island in the Eerste River Stellenbosch. From a more recent historical perspective
the local municipality area currently defined as Stellenbosch in the pre-1994 era
consisted of a number of individual institutional entities. These included
Stellenbosch, Franschhoek, Jamestown and Pniel that constituted independent
municipal authorities for white residents, the Coloured Local Advisory Councils
(CLACs) representing the coloured communities of Cloetesville and Idas Valley in
Stellenbosch | Page 6

Stellenbosch, the African settlement of Kayamandi administered by the Central
State, and the surrounding rural settlements under control of the Cape Provincial
Administration's control (Seethal, 2005).

The municipality houses a variety of educational institutions, including the University
of Stellenbosch and a number of prestigious schools. It has a strong business sector,
varying from major South African businesses and corporations, to smaller
enterprises and home industries. The municipality is well known for its world
renowned cultural landscapes and exceptional scenic quality. Stellenbosch is also
particularly well known for its wine industry and related wine tourism industry with the
Stellenbosch wine route receiving more than 800,000 visitors annually (Ferreira &
Hunter, 2017). The municipal area includes various architectural styles such as
Dutch, Georgian and Victorian which reflect their heritage and traditions, but also
divisions of the past (Stellenbosch Municipality, 2017b).

2. DEMOGRAPHIC AND ECONOMIC OVERVIEW
2.1 Overview of demographic characteristics and trends
The total population of the municipality increased from 103 996 in 1996, to 118 709
in 2001 and the most recent official figure of 173 419 in 2016 (Statistics SA, 2016).
This represents an average annual population growth rate of 2.6% per annum over
the period 2001 to 2016. The number of households increased from 29 023 to
52 371 between 2001 and 2016 representing an average annual household growth
rate of 4.0% per annum over this period. By 2016 as much as 91% of the population
lived in urban areas. The overall gross population density across the entire municipal
area is low and increased somewhat from 1.25 persons/ha in 1996 to 2.09
persons/ha in 2016. Based on the urban development footprint data of 2014 and the
2016 population data the estimated net population density of the municipality is 61.7
persons/ha (18.6 households/ha).
Table 1: Population and density trends
                           Indicator                          1996      2001      2011      2016
 Total number of people                                      103 996   118 709   155 733   173 419
 Total number of people urban                                  n.a       n.a     119 256   157 845
 Total number of people rural (commercial farms)               n.a       n.a      36 476    15 575
 Total number of households                                   25 931    29 023    43 420    52 374
 Avg annual growth rate (population) since previous period                 2.7       2.8       2.2

 Avg annual growth rate (households) since previous period                 2.3       4.1       3.8
 Density
 Total area of the municipality (ha)                         83 100    83 100    83 100    83 100
 Total area of built up area (urban area, 2014) (ha)                                         2 810
 Persons per ha                                                 1.25      1.43      1.87      2.09
 Persons per ha for built up area                                                             61.7
 Households per ha                                              0.31      0.35      0.53      0.63
 Households per ha for built up area                                                          18.6
Stellenbosch | Page 7
The levels of access to basic services in the municipality is high with 98.1% of the
population having access to a flush toilet, 92.7% to electricity and 66.8% with indoor
water access in 2016. One of the growing challenges from a services and physical
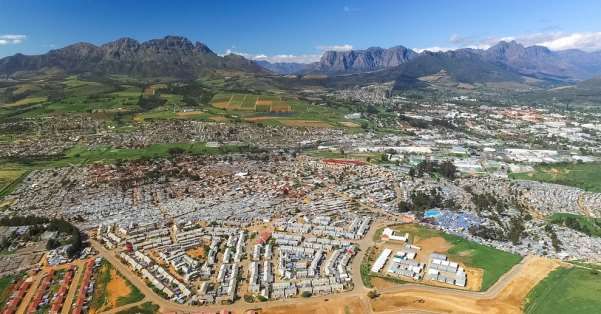
development perspective is the percentage of households living in informal
settlements that increased from 15.7% in 2001 to 34.2% in 2016. This 2016 figure is
the second highest figure amongst the 25 intermediate city municipalities in South
Africa.
Table 2: Access to basic infrastructure and housing
Indicator 1996 2001 2011 2016
Total number of households 25 931 29 023 43 420 52 374
Number of households with indoor water access 19 472 19 905 31 437 34 972
Percentage of households with indoor water
75.1 68.6 72.4 66.8
access
Number of households with flush toilet access 21 828 25 407 39 834 51 386
Percentage of households with flush toilet access 84.2 87.5 91.7 98.1
Number of households with electricity access 23 395 26 415 40 352 48 532
Percentage of households with electricity access 90.2 91.0 92.9 92.7
Number of households living in informal structures 3 543 4 556 9 947 17 936
Percentage of households living in informal
13.7 15.7 22.9 34.2
structures
In 2016 a total of 68.5% of the municipal population could be classified in the
economically active age category (15 to 64 years of age). The majority of these fall in
the age category 15-34 years of age and a further 26.2% between 35 and 64 years.
Children (population 14 years and younger) represent 23.8% of the total population
and the elderly (65 years and older) 7.7%. Expressed in dependency terms, the child
dependency ratio (ratio of children to economically population) fluctuated between
36.2 in 2001, 31.6 in 2011, and 34.7 in 2016. The elderly dependency ratio (ratio
between population 65 years and older and the economically active age population)
increased from 6.4 in 2001 to 6.8 in 2011 and quite dramatically to 11.2 in 2016.
Despite this sharp increase in the elderly dependency ratio in 2016 and the
impression expressed by some of the interview respondents that Stellenbosch
houses a large proportion of pensioners, the 2016 ratio of 11.2 only ranked 13th on
the elderly ratio amongst the 25 intermediate city municipalities. The overall
dependency ratio (children plus elderly expressed as a ratio relative to the
economically active population) fluctuated between 42.6 in 2001 to 38.4 in 2011 and
increasing again to 45.9 in 2016. This implies that Stellenbosch had the 4th lowest
total dependency ratio amongst the 25 intermediate municipalities in 2016.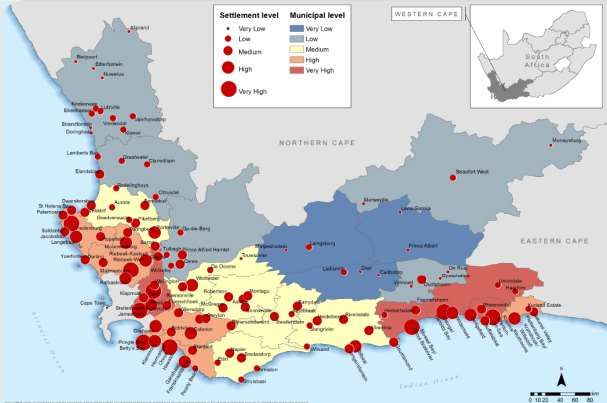
Stellenbosch | Page 8

Despite the vision of Stellenbosch described in its latest Integrated Development
Plan (Stellenbosch Municipality, 2017b) as “Valley of Opportunity and Innovation”
only 28.0% of its population had an education level of matric or higher in 2016,
placing Stellenbosch only 13th on the list of the 25 intermediate city municipalities. In
2011 a total of 52.9% of households in Stellenbosch earned less than R3200 per
month, a further 27.0% earned between R3200 and R12 800 per household per
month, and 20.1% of households earned in excess of R12 800 per month. The
estimated average monthly household income in the Stellenbosch LM increased
from R8 062 in 2011 to R12 769 in 2011. Stellenbosch LM remained with the highest
average monthly household income amongst the 25 intermediate municipalities in
both 2001 and 2011.

2.2 A brief overview of economic structure and performance
According to the 2015 Municipal Economic Review and Outlook for the province,
Stellenbosch is the largest and fastest growing municipality in the Cape Winelands
district (WCPT, 2015). Despite intensive agricultural activities located in the
municipality this sector only contributed 8.2% of GDP in 1996 and declining further to
6.5% of the municipal GDP in 2015. As indicated in Table 3 Stellenbosch
consistently outperformed the district and the Western Cape from an economic
growth perspective over the period 2005 to 2013 and by 2013 accounted for 34% of
the district GDP. In addition Stellenbosch was the only municipality that contributed
positively to employment creation on a net basis between 2005 and 2013.

Table 3: Cape Winelands District municipalities: GDPR contribution and
growth

Source: WCPT, 2015
Stellenbosch | Page 9

Table 4: Cape Winelands District municipalities: Employment creation

Source: WCPT, 2015

By 2013 Stellenbosch accounted for 33.7% of the district GVA and 29.1% of
employment (WCPT, 2015). The economic structure is dominated by the commercial
services sector (48% of municipal GVA and 39% of employment); general
government, community, social and personal services sector (20% of GVA and 32%
of employment), and manufacturing (20% of GVA and 14% of manufacturing).
Research into knowledge-based service industries in Stellenbosch revealed that
these businesses locate in Stellenbosch as a matter of preference rather than
necessity. It also indicated that the most prominent factors crucial to the successful
performance of core business activities is the opportunity for face-to-face client
consultation and the availability of a highly educated workforce (Adendorff &
Donaldson, 2012). These figures also dispel the perception and anecdotal
statements such as contained in the municipal IDP (Stellenbosch LM, 2017b) stating
that “Stellenbosch’s economy is also driven by the agricultural sector which requires
the seasonal influx of labor”.

Figure 2: Stellenbosch LM: Composition of gross value added and
employment

Source: WCPT, 2015
Stellenbosch | Page 10

All economic sectors in Stellenbosch experienced positive GVA growth between
2005 and 2013 and apart from the agricultural sector and construction sector all
other sectors experienced positive net employment creation between 2005 and
2013.

The economic performance of Stellenbosch as outlined by the indicators above is
also reflected in the official employment statistics. According to the official definition
of unemployment the unemployment rate in Stellenbosch decreased slightly from
16.9% in 2001 to 15.2% in 2011. The employed as a percentage of the unemployed
over the same period decreased slightly from 37.1% to 36.6%. When comparing the
2011 figures of the 25 intermediate municipalities, Stellenbosch had the lowest
unemployment rate and the second highest percentage employed people.
Stellenbosch also outperformed the other intermediate city municipalities with the
lowest youth unemployment rate in both 2001 (23.1%) and 2011 (21.5%).

Table 5: Stellenbosch employment status and income

 Indicator                                             1996      2001        2011       2016
 Total population                                      103 996   118 709     155 733    173 419
 Total number of people employed                       39 825    44 067      56 957     n.a
 Employed people as a percentage of total population   38.3      37.1        36.6       n.a
 Unemployment rate                                     n.a       23.1        21.5       n.a.
 Youth unemployment rate                               n.a       16.9        15.2       n.a
 Average household income                              n.a       96 743      153 233    n.a
 Annual growth in household Income (2001-2011)         n.a       n.a         4.7        n.a
 Average annual CPI (2001-2011)                        n.a       n.a         5.9        n.a
 Dependency ratio                                      n.a       42.6        38.4       45.9

A summary of the financial status of Stellenbosch as reflected by its audited financial
statements is summarized in Table 6. Total municipal expenditure increased from
R544 million in 2008/09 to R1.25 billion in 2015/16. Over this period the total capital
expenditure increased from R106 million (19.5% of total budget) to R287 million
(22.9% of total budget). Although the total expenditure on maintenance increased
over this period it decreased in proportional terms from 6.1% of total expenditure in
2008/09 to 4.4% in 2015/16. A positive indication is that the proportion of total
expenditure spent on salaries decreased from 30.8% in 2008/09 to 29.3% in
2015/16.

Total municipal income increased from R574 million in 2008/09 to R1.41 billion in
2015/16. The total income generated from property rates more than doubled from
R119 million to R270 million and as a percentage of total municipal income
decreased slightly from 20.7% to 19.2%. The proportion of total municipal income
derived from service fees decreased slightly from 52.4% to 50.% over this period. A
significant feature of the financial trends is that grants as percentage of total
municipal income nearly doubled from 8.8% in 2008/09 to 16.1% in 2015/16. In 2015
Stellenbosch | Page 11

the total number of employees per km² of built-up area was approximately 31.3 and
the average annual salary of employees (total municipal expenditure on salaries
divided by total number of employees) R313 000.

Table 6: Financial status

 Indicator                                                2008/2009          2015/2016
 Number of municipal employees
                                                                             1174
 Total Municipal expenditure
                                                          544 475 586        1 254 937 245
 Total capital expenditure
                                                          106 356 972        287 122 600
 Capital budget as % of total budget
                                                          19.5               22.9
 Municipal expenditure on maintenance
                                                          33 022 475         54 657 830
 Municipal expenditure on maintenance as a percentage
                                                          6.1                4.4
 of total expenditure
 Municipal expenditure on salaries
                                                          167 828 964        367 462 966
 Municipal expenditure on salaries as a percentage of
                                                          30.8               29.3
 total expenditure
 Total municipal Income
                                                          574 231 995        1 411 088 371
 Total Income from property rates
                                                          119 118 905        270 378 662
 Municipal income from property tax as a percentage of
                                                          20.7               19.2
 total municipal income (self- generated income)
 Total income from service fees
                                                          300 929 648.00     705 713 720
 Service fees as a percentage of total income
                                                          52.4               50.0
 Total income from grants
                                                          50 289 596.00      227 268 132
 Grants as a percentage of total income
                                                          8.8                16.1
 Total Municipal area (km²)
                                                          831                831
 Total Municipal built-up area (km²)
                                                                             28.1
 Number of municipal employees per km2
                                                                             1.41
 Number of municipal employees per km2 of built up area
                                                                             41.8
 Municipal expenditure per employee
                                                                             1 068 941
 Average salary of officials
                                                                             313 001
Source: Stellenbosch Municipality 2009 & Stellenbosch Municipality 2016a
Stellenbosch | Page 12
3. MAIN SPATIAL TRANSFORMATION ISSUES
Although there are some different interpretations of the concept of spatial
transformation it is broadly accepted that it is not only about the restructuring of
space, but also about institutional transformation, the development of organisational
capacity and a focused vision and plan (SACN, 2016). As part of the interviews with
the respondents they were asked to provide their understanding of the term spatial
transformation. Although a variety of ideas were expressed, these can be distilled
into a number of common ideas. Firstly, there is a general view that spatial
transformation consists of both a social dimension and an economic dimension.
There also seems to be a common view that successful spatial transformation from a
social perspective is not possible without sustainable economic development.
Secondly, there is a widely held perception that spatial transformation does not
necessarily only refer to low cost housing in high income suburbs, but rather a focus
on establishing a housing mix in line with the affordability levels of residents and the
labor force of Stellenbosch and the creation of innovative mixed land use areas. The
current affordable housing funding model is viewed as inappropriate to support
spatial transformation and it is generally agreed that available resources (land and
buildings) must be optimally used to support spatial transformation. It was also
mentioned that development norms and standards must be applied consistently
across all areas in the LM to support spatial transformation. A third broadly held view
is the need to maintain financial sustainability whilst accommodating spatial
transformation. It was mentioned that there are many pensioners and students living
in Stellenbosch struggling to keep up with increasing rates and taxes of the
municipality. This will in the long term impact negatively on the ability of the
municipality to support a successful spatial transformation agenda.
The main spatial transformation issues in Stellenbosch were identified as those
aspects that were identified as one of the “strategic perspectives” in the SDF and
identified by the interview respondents as priority spatial transformation issues. This
process resulted in the identification of five priority spatial transformation issues as
summarised in the subsequent paragraphs.
• Balancing the need for new development with maintaining the unique rural and
historical heritage character and sense of place of the town and municipality.
Extensive urban expansion typified by the construction of low density suburbs on
agricultural land situated not in proximity of major transport systems and pressure
on arable land due to rapid population and settlement growth are identified as
important threats in the SDF. The SDF also noted that the agricultural industry
has experienced difficulties in attracting capital as high premiums are paid for the
lifestyle aspects of Stellenbosch farm land resulting in increasing property prices
and lower financial returns for farmers (Stellenbosch municipality, 2017a). Recent
research further emphasized the importance of not overdeveloping or over-
commercializing the Stellenbosch wine route experience and to maintain some of
its authenticity (Ferreira & Hunter, 2017).Stellenbosch | Page 13
Figure 3: Security estate in rural area
Source: Property 24, 2017
• Expanding the capacity of bulk infrastructure (including the improvement of
mobility, circulation and parking) to accommodate future development needs and
reduce negative environmental impacts. According to the SDF much of
Stellenbosch’s key water supply infrastructure is in a state of disrepair, severely
constraining the municipality’s ability to deliver uninterrupted fresh water services
to its constituents. The upgrading of the current wastewater treatment works is
one of the largest capital investments ever made by the Stellenbosch Municipality
(Stellenbosch Municipality, 2017b).
• Providing a broader mix of housing types in closer proximity to economic
opportunities, including the delivery of public and private sector housing in the
social, gap and lower income sectors to also accommodate the high proportion of
the Stellenbosch labour force that cannot afford to reside there. An important
principle to practically achieve this is the optimal use of publicly owned land to
maximize opportunities for mixed use and mixed housing type development.
Accommodating and managing the growing need for affordable housing
(especially the growth of Kyamandi) and the prioritization of the incremental
upgrading of informal settlements were also identified as an important spatial
transformation priority.Stellenbosch | Page 14
Figure 4: Informal housing in Kyamandi
Source: Stellenbosch Heritage Foundation, 2017
• The protection and conservation of key natural resources and eco-system
services and public open spaces. Pressure on fresh water resources due to rapid
population and settlement growth is identified as a threat in the SDF. Climate
change is likely to bring a combination of rising temperatures and reduced or
erratic rainfall, placing pressure on constrained water supplies (Stellenbosch
Municipality, 2017a). Stellenbosch is home to some very rare and diverse
vegetation that is coming under pressure from the uncontrolled expansion of
urban areas and industrialized agriculture into indigenous ecosystems
(Stellenbosch Municipality, 2017a: 33).
• The SDF identified the growth of Stellenbosch University as a major opportunity
for the property and services sectors and a driver of inclusive economic growth.
This growth of the university and its associated facilities however also brings its
own unique challenges for spatial development, especially the eexpanding
footprint, student accommodation encroaching into the suburbs, a major
contributor to traffic volumes in Stellenbosch, and its impact on infrastructure
capacity (Stellenbosch Municipality, 2017a). The university expressed a
willingness to become involved in upgrading precinct infrastructure where such
challenges are a result of University growthStellenbosch | Page 15 Other important spatial transformation issues also identified by the interviewees include the maintenance and further development of the municipality’s agricultural base; a much stronger focus on the interaction between spatial development, infrastructure prioritization and funding and financial sustainability; and the lack of progress with socio-economic integration (the different nodes as identified in the SDF have very distinct racial characteristics). It is also relevant to reflect on the main spatial issues that have been identified in the 2017 revision of the municipal Integrated Development Plan. These key issues include new property developments that have transformed the landscape in response to new market demands, homeless households who have occupied strategically located parcels of land, expansion of the University footprint and student accommodation has encroached into the suburbs, traffic congestion, the emergence of new malls, and the tourism and the services sector that has boomed. The need to consider the future spatial development of Stellenbosch in its broader regional context has also been identified as an important issue (Stellenbosch Municipality, 2017b). The 2016/17 IDP identified the importance of focusing strategic planning effort broader than mere administrative boundaries to also include the Cape Town Functional Region. This initiative recognizes shared environmental resources and key regional economic interdependencies such as a commuting workforce and a shared consumer catchment area (Stellenbosch Municipality, 2017b). 4. ALIGNMENT WITH OTHER SECTOR PLANS The Stellenbosch SDF only makes reference to two specific sector plans: precinct plans in some of the nodal proposals and the Stellenbosch University campus master plan. There are however a range of municipal sector plans potentially relevant to spatial development in Stellenbosch and are briefly summarized in the following sections. 4.1 Provincial level plans The primary objective of the Western Cape Provincial Growth Potential of towns Study (GPS 2013) was to determine the growth potential of settlements outside the City of Cape Town in terms of potential future economic, population and physical growth. The analysis of growth potential is based on two related concepts: inherent preconditions for growth and innovation potential. Five thematic indexes formed the basis for modelling the growth preconditions and innovation potential within each settlement and municipality in the province. Both Stellenbosch municipality (at municipal level) and Stellenbosch town at settlement level was identified as having a very high potential for future growth.
Stellenbosch | Page 16

Figure 5: Growth potential of settlements and municipalities in the Western
Cape

Source: DEADP, 2013.

The Western Cape Spatial Development Framework (PSDF) of 2014 is a
framework to guide the formulation and rolling out of coherent and consistent sector
and area based plans by the various spheres of government and state owned
enterprises operating in the Western Cape. It also provides communities and the
private sector with greater certainty over where development is heading to enable
them to respond to emerging opportunities. In terms of the consolidated framework
proposals Stellenbosch is identified as a regional center forming part of the Cape
metro priority urban functional region.
Stellenbosch | Page 17

Figure 6: Western Cape Province consolidated framework proposals

Source: DEADP, 2014

4.2   Municipal level plans
The purpose of the Heritage Inventory and Management Plan is to provide
detailed management information and guidelines on heritage resources in the
municipal area. A heritage register was completed for the historical core of
Stellenbosch through the Stellenbosch Heritage Foundation and was submitted to
Heritage Western Cape for assessment. A similar register was also completed for
the Stellenbosch University and approved by Heritage Western Cape.

The Municipality is in the process of reviewing the Integrated Human Settlements
Plan to ensure alignment with the Urban Development Strategy and with special
emphasis on alignment with the SDF and the IDP. The existing approved
Stellenbosch Housing Strategy supports the SDF’s proposed municipal spatial
configuration comprising of a system of interconnected and tightly configured
settlements with clear urban edges. The target is the provision of roughly 18 775
residential units to cater for the current backlog in housing.

The Comprehensive Integrated Transport Plan (CITP) serves as a mechanism to
plan for, develop, manage, integrate and provide for all modes of transport. The
latest completed CITP has been prepared and adopted by Council for the 2016-2020
Stellenbosch | Page 18

period and has identified the following areas of strategic intervention for Stellenbosch
(Stellenbosch municipality, 2017b):

•   “Towards Car Free Living” which refers to strategies that encourage more
    effective modes of travel such as public transport, NMT and other mechanisms to
    increase the number of passengers per vehicle.
•   “Travel Demand Management” which refers to strategies that manage overall
    demand for travel during peak periods such as congestion pricing and parking
    management.
•   “Infrastructure and Operational Enhancements” which refer to capacity
    improvements to transport infrastructure but only as part of the overarching
    transport philosophy in Stellenbosch.
•   “Optimal Land-Use and Interconnected nodes” which refers to integrated land
    use and transport planning which supports and promotes transit orientated
    development (TOD).
The municipality has also prepared a number of other sector plans such as an
Integrated Waste Management Plan, Electrical Master Plan, Water Services
Development Plan, Long term water conservation and water demand strategy, Local
Economic Development Strategy, Disaster Management Plan, Air Quality
Management Plan, Community Development Strategy, ICT turn-around strategy, and
Human Resource Plan.

The existing Stellenbosch University Campus Master Plan was approved by the
university management in May 2010. The aim of this master plan is to guide the
spatial development of a leading 21st century university campus by maintaining a
balance between new development and historical heritage. One of the overall
objectives of the plan is cooperation with the local municipality and communities.
This master plan provides detailed proposals for future spatial development of
academic facilities, student accommodation, and support services. It also includes
the identification of strategic properties required for the short, medium and long term
expansion of the university (Stellenbosch University, 2010). The master plan has a
20 to 30 year horizon and is currently (2017) being reviewed and updated.

5. OVERVIEW OF STELLENBOSCH SDF
5.1 Institutional setting and status of SDF
The spatial planning function of Stellenbosch is vested in the Directorate Planning
and Economic Development with the allocated responsibilities of management and
planning of heritage and environmental resources; spatial planning and land use
management, stakeholder management, neighborhood revitalization, community
development, local economic development and tourism. Political oversight of this
function is provided by the Economic Development and Planning Portfolio
Committee of the municipality (Stellenbosch Municipality, 2017b).
Stellenbosch | Page 19
The existing SDF was originally prepared in 2012 based on a draft status quo report
and draft strategies reports by CNdV Africa in 2010 and inputs from Stellenbosch
municipality in 2012. This SDF was approved by Council in 2013. The municipality
subsequently initiated two parallel processes to prepare an updated and SPLUMA
compliant SDF. As an interim measure the 2012 SDF has been revised during 2017,
specifically to accommodate some minor changes to the urban edge, and approved
as part of the 2017 IDP process. In parallel the municipality has embarked on a
process to prepare a completely new SDF that will be approved during the
2017/2018 IDP cycle in 2018. This process consists of four separate but mutually
informing baseline studies that will form the point of departure for formulating
alternative spatial development concepts and proposals:
• A heritage register and plan: The first phase focusing on the rural and farming
areas have been completed and approved. The second phase focusing on the
urban areas was in progress at the time of the completing this report.
• A rural development plan focusing on spatial development and appropriate forms
of development in the rural areas of the municipality (all areas outside the urban
edges).
• An urban development strategy informed by current and future requirements for
housing, economic growth and other space consuming activities. This urban
development strategy will also informed by a specialist study to accurately
quantify the housing backlog and need requirements in the municipality.
• A specialist study to investigate the feasibility of a proposed new western bypass
to alleviate traffic congestion in Stellenbosch and improve overall accessibility.
These four studies will then jointly form the bases for developing alternative spatial
development concepts and subsequent more detailed future spatial development
proposals.
The assessment and evaluation of the Stellenbosch SDF reflected on in the
remainder of this report thus refers to the existing Stellenbosch SDF of 2012 updated
in 2017.Stellenbosch | Page 20
Stellenbosch | Page 21

5.2 Expected outcomes of SDF
The revised April 2017 SDF clearly articulates four envisaged aims (Stellenbosch
Municipality, 2017a):
• Achieve shared growth
• Increase access to opportunities, particularly for disadvantaged citizens
• Improve sustainability by minimizing ecological footprints
• Maintain the unique sense of place of the municipality’s towns and regions

To achieve these outcomes the SDF is structured around seven strategic
perspectives that should guide the future spatial development of Stellenbosch. It also
provides a set of principles for each of these seven strategic perspectives. A
synopsis of these seven strategic perspectives as outlined in the SDF is summarized
in the subsequent sections (Stellenbosch Municipality, 2017a).

     i.    Interconnected nodes
The SDF recommends that each settlement should have its own design and
implementation framework that recognizes the unique characteristics of its setting.
The principles of walking distance, functional integration and socio-economic
integration should be common to all of them and it is hence suggested that
developments should be prioritized firstly around rail routes, and secondly alongside
road routes and intersections. This should be supported by a balanced supply of low,
middle and high income housing in each node including some social and gap-
housing on private developments. In accordance with the principles of densification,
existing settlement nodes should receive priority over greenfield land and land use
should be based on its best long term sustainable use, rather than on its best
financial return.

     ii.   Car Free Transport

The SDF calls for a reduction of the number of cars on the road through a
combination of non-motorized transport (NMT) and public transport facilities.
Adequate pedestrian and cycling infrastructure and appropriate development policies
should ensure that at least 50% of activities in the urban areas are within 1km of
residential areas, making it easier to live without private cars. Increased settlement
densities should also ensure improved financial viability of public transport facilities
and encourage a shift away from dependence on private cars.

    iii.   Inclusive Economic Growth
The SDF recognizes the imbalances between rich and poor and recommends the
provision of a proportionate balance of low, middle and high income housing with
more affordable housing provided closer to economic opportunities, and commercial
zones to be created within close proximity of low income suburbs. Sufficient
industrial land should also be made available near public transport links, especially
Stellenbosch | Page 22
rail. The SDF further recognizes the requirements of the informal sector and
proposes that shopping centers and areas with high pedestrian traffic should also
include market areas and sidewalk opportunities that help informal traders to access
more business. Markets and informal retail spaces should be properly managed, and
rentals charged for informal retail spaces according to the level of services provided.
The SDF further recommends that appropriately located public land should be used
for agricultural, conservation and tourism purposes in land reform, equity or lease
schemes that broaden participation in the rural economy.
iv. Optimal Land Use
The SDF recommends that the expansion of urban footprints should be limited and
that suitable locations need to be identified either as part of existing settlements
through densification or extension and integration of existing settlements. Preference
must be given to locations close to public transport hubs, and brownfield sites are
preferred over greenfield locations. Projects catering to low, middle and high income
groups should be designed as larger integrated settlements rather than stand-alone
townships or gated communities. Space should simultaneously be created for
additional educational and other facilities to ensure minimal need for vehicular
transport.
Figure 7: Stellenbosch land use change 2000 to 2010.
Source: Musakwa & Van Niekerk, 2013.Stellenbosch | Page 23
The physical growth and land use change of Stellenbosch town as the main
development node in the municipality between 2000 and 2010 is reflected on Figure
7. Clearly the most significant growth of the urban footprint occurred in the south (De
Zalze Estate and Paradyskloof), north-west (Kayamandi) and north (Welgevonden)
indicating significant pressure for the peripheral extension of the urban footprint.
v. Resource Custodianship
The SDF highlights five specific areas requiring urgent attention:
• Fresh water: Pollution reduction should be complemented by efforts to re-
establish and protect indigenous riverine ecosystems and the eradication of
alien vegetation from all areas should be supported. Peak water demand
should be accommodated with supplementary water storage and recycling,
and urban water conservation and demand management programs should be
implemented.
• Waste water: The SDF recommends that the WWTWs must be upgraded to
achieve minimum water quality standards as defined by DWAF and where
feasible, development at new settlement nodes should be serviced by
localized waste water treatment plants that utilize appropriate sustainability-
oriented technologies. Peak load management systems will need to be
considered for particular areas. Sewage should be regarded as a potential
source of water, nutrients, methane gas.
• Solid waste: The reduction of waste streams need to be prioritized and
strategies for waste separation at source should be formulated and
implemented. Private and community-based sub-contractors should be
included in a recycling- oriented waste management system.
• Energy: All new housing should install solar water heating devices, and non-
subsidy housing should be encouraged to supplement their demand by
generators such as solar photovoltaic panels and solar hot water heating
devices. Alternative energy sources should be developed and integrated into
the grid, and the largest energy users should be encouraged and incentivized
to invest in solar energy generation.
• Construction materials: The SDF proposes the use of recycled, recyclable and
low energy building materials in the construction of new buildings where
possible.
vi. Food and Agriculture
Land outside of existing or proposed urban settlements should be used for
agricultural production, biodiversity conservation, scenic quality and agri-tourism.
Further sub-division of land should be strongly discouraged. Informal, properly
managed farmers markets selling fresh produce should be provided in key centres,
while further large mall developments should be discouraged. This aspect is
particularly relevant in light of the findings of research indicating that despite a strong
agricultural context food insecurity is high in Stellenbosch (Kelly & Schulschenk,
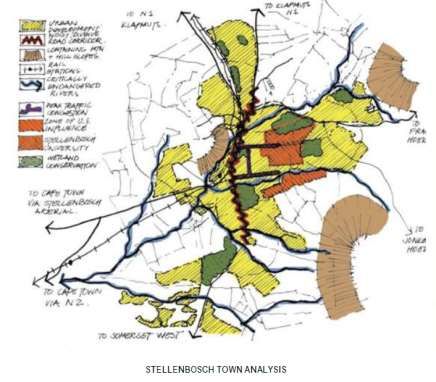
2011).Stellenbosch | Page 24 Figure 8: Stellenbosch wine farms Source: Wesgro, 2017 vii. Heritage The SDF proposes a number of specific principles to protect the character of the area, including the use of guidelines for sensitive biodiversity areas, controls over building heights and architectural styles along major roads, and the determination of appropriate land use zoning according to view sheds. 5.3 Spatial concepts and proposals From a spatial development viewpoint, and in line with the strategic perspective of interconnected nodes, the SDF identified 14 nodes as the focus of future development in Stellenbosch municipality. The SDF provides a summarized strategic analysis for each of the 14 nodes addressing aspects such as advantages, challenges, opportunities, constraints, future lateral growth, development areas, a summary of infrastructure constraints and implications, and rivers and conservation zones. The spatial proposals for each of the 14 nodes consists of three elements: a conceptual representation of the key findings of the analysis of each node, a conceptual representation of the spatial proposals for each node; and a detailed map showing the urban edge for each node (see examples provided in Figures 9 and 10).
Stellenbosch | Page 25

Figure 9: Stellenbosch SDF town analysis and proposals

Source: Stellenbosch Municipality, 2017a
Stellenbosch | Page 26

Figure 10: Stellenbosch urban edge

Source: Stellenbosch Municipality, 2017a

The conceptual categories to reflect the spatial proposals for the 14 nodes include
the following (not all categories used in the proposals for each individual nodes):
• Green field/new development areas
• Infill and redevelopment
• River conservation corridor
• New passenger stations
• Urban edge
• Urban village centers
• Important gateways to be protected
• Proposed agriculture (land reform)
• Upgrade of facilities (e.g. picnic site)
• Wetland conservation
• Traffic calming and pedestrian safety zone
• Urban agriculture
• Scenic route
Stellenbosch | Page 27

As summarized in Table 7 in Section 6 the concepts used in the spatial proposals
are rather limited and only includes 6 of the 14 generic spatial concepts widely used
in SDFs. The scale and level of detail of the proposals for each of the nodes was
generally regarded by the interviewees as insufficient to inform decisions regarding
individual development applications.

6. ASSESSMENT OF STELLENBOSCH SDF
6.1    Quality of the planning process
Both the existing SDF (2012 version updated in 2017) and the new SDF currently
being prepared has been and is developed by private consultants. The current SDF
process involves different private consultants and specialists for the various
components of the process. Although compiled by external consultants the municipal
planning department is actively involved in the process.

The interviewees held quite different views on the institutional capacity of the
planning function in the municipality. Some are of the opinion that the municipality is
sufficiently capacitated in this field whilst others regard it as insufficient. Specific
areas of concern that were mentioned include the lack of IT systems supporting
planning (especially a functional GIS), and the absence of a drawing office and map
room.

The general consensus opinion amongst the interviewees is that stakeholders were
adequately consulted in the process of preparing the existing SDF, although the
opinion was expressed that ward councilors could potentially play a more prominent
role to inform constituents of the SDF process. Regarding the current process
underway to prepare a new SDF for adoption during 2018, an attempt was made
during the 2017 IDP process to integrate the public engagement requirements of the
SDF process with the IDP consultative process. This was however not deemed very
successful because the focus of IDP meetings tended to focus more on general local
development issues (such as crime and services infrastructure) with limited
opportunity to engage on spatial aspects. Further ward level consultation around the
SDF specifically is planned for 2017/18. The current process to engage stakeholders
also includes bilateral meetings with identified stakeholder groups attended by the
mayor and an Intergovernmental Steering Committee to involve all relevant organs
of state in the process. In addition, monthly meetings are held between the SU and
the municipality to discuss planning issues of common interest. It was unclear to
what extent the different municipal departments have been involved in the
preparation of the existing SDF. It is however clear that other departments within the
municipality are actively and directly involved in the preparation of the new SDF. A
strategic meeting is held every 14 days between all the directors of the departments
regarding development in the municipality. This is not necessarily aimed at the SDF
only but also includes discussions relevant to the preparation of the new SDF.
Stellenbosch | Page 28

Despite a range of sector and other plans at provincial and municipal level potentially
relevant to spatial development (see details in Section 4) the Stellenbosch SDF only
makes clear reference to two related plans as informants of the SDF: precinct plans
in some of the nodal proposals and the Stellenbosch University campus master plan.
The respondents did however indicate that the current process to prepare a new
SDF does consider all relevant provincial and national policies and legislation as
required by SPLUMA.

Figure 11: Stellenbosch University campus

Source: http://www.holidaybug.co.za/a-360-view-of-stellenbosch-in-pictures-a-photoblog

From the interviews it became clear that there are two opposing views amongst the
community and stakeholder groups regarding spatial development:
• Those favoring new development
• Those opposed to new development mainly based on two arguments – impact on
   traffic and impact on rural character of area.

The opinion was expressed that the biggest influence on development originates
from influential local individuals and private developers and not necessarily
organized lobbyist groups. The views and comments on development applications by
organized community groups such as the Stellenbosch Interest Group (SIG) and the
Heritage committee are regarded as influential. There was however no mention of
power play influencing spatial development in a negative context.
Stellenbosch | Page 29

The alignment between the existing SDF and IDP is limited and the vision of the IDP
is not clearly reflected by the principles and proposals of the SDF. The current
process for preparing the new SDF however specifically aims to achieve alignment
of the two processes and it is envisaged that the new SDF will be approved together
with the 2018 revision of the IDP.

6.2   General overview of plan quality
The existing SDF was prepared in 2012 before the implementation and finalization of
SPLUMA and is thus not SPLUMA compliant. It is however envisaged that the new
SDF will be fully SPLUMA compliant in all respects. Due to the fact that the SDF was
prepared in 2012 well before the finalization of the draft IUDF (2014) and the final
IUDF (2016), the strategic goals and policy levers of the Integrated Urban
Development Framework (IUDF) is not considered in the current SDF. Surprisingly
the interviews revealed very limited knowledge about the existence and content of
the IUDF and its relevance for spatial transformation.

The general opinion of the interviewees is that the existing SDF is of an average
quality with no specific focus on spatial transformation and with limited ability to
influence development decisions. The general principles are generally regarded as
sound and even reflecting some far reaching proposals for spatial transformation but
provide insufficient detail to meaningfully guide development. Its impact is severely
constrained by the absence of prioritized projects and a detailed implementation
plan. Some proposals such as the development of new railway stations are viewed
by some as unrealistic.

Although the plan provides a proposed conceptual spatial framework for each of the
14 identified nodes, no alternative municipal or nodal level spatial concepts are
explored or evaluated in the SDF. The new SDF currently being prepared will
however specifically consider alternative SDF concepts to be formulated based on
the findings of a number of specialist studies referred to earlier.

Although spatial transformation is not specifically identified as one of the strategic
perspectives or objectives of the IDP, a number of the development principles
identified in the SDF do however represent some recognition of the need for spatial
transformation albeit not as a separately defined objective. Some of these principles
can in fact be regarded as quite radical from a spatial development perspective.
According to the SDF (Stellenbosch Municipality, 2017a: 20) municipal owned land
can be used to provide affordability advantages for agricultural and low income
housing developments rather than selling this land to the highest bidder. Some of the
principles identified under the strategic priority area of optimal land use include the
following (2017a: 21):
• Land and projects catering for low-, middle- and high-income groups should be
    designed as part of a larger integrated settlement rather than stand-alone
    townships or gated estates
• Public land to be used for social or low income housing should not be sold at the
    highest price, but rather leased or sold at levels that make such projects viable
Stellenbosch | Page 30
• Identify suitable locations for 6,000 middle- and low-income residential units
(middle to high density, including flats), preferably at locations that are close to
public transport links.
The SDF further recommends as one of its principles that areas of land should be
set aside, and if necessary expropriated, to provide SMMEs with access to well-
located parts of the CBDs for retail, service provision and manufacturing. It further
recommends as one of its principles that a range of informal retail locations should
be provided on sidewalks, verges and median areas to cater for permanent traders.
The SDF also supports the principle that the construction of additional large grocery
anchored shopping malls should be discouraged in the municipality, mainly because
they undermine neighbourhood-level commercial activity and they are often only
accessible by private car. Instead, locations for informal, properly managed farmers
markets selling fresh produce, arts and crafts should be provided in key centres
(Stellenbosch Municipality, 2017a).
Table 7: Application of generic spatial planning concepts in Stellenbosch SDF
Spatial concept Concept used Concept used
Yes / No/ ?
Development/activity corridors and spines
N
Development nodes N
Economic development/investment zones N
Civic/community areas; Multipurpose Urban village centers
Y
service delivery centers Facilities upgrade
Mixed use nodes or corridors N
Urban edge
Urban edge/boundary Y
Infill and redevelopment
Densification or infill areas Y
Green field/new development
Urban development/expansion areas Y areas
Urban renewal/regeneration zones N
Open space system NStellenbosch | Page 31
River conservation corridor
Protected or high biodiversity zones Y
Wetland conservation
Proposed agriculture (land
High potential agricultural land ? reform)
Urban agriculture
Coastal edge NA
New passenger stations
Public transport focus areas Y
Important gateways to be
protected; Traffic calming and
Other
pedestrian safety zone; Scenic
route
As summarized in Table 7 the concepts used in the spatial proposals are rather
limited and only includes 6 of the 14 generic spatial concepts widely used in SDFs. It
is a widely held view amongst the interviewees that the scale and level of detail of
the proposals for each of the nodes is insufficient to inform decisions regarding
individual development applications.
6.3 Plan quality: Consideration of key spatial transformation
principles
The SDF identified urban sprawl and the development of low density suburbs on
agricultural land as a specific threat and hence one of the seven strategic
perspectives of the SDF is interconnected nodes within a framework of a high
density nodal development pattern based on strategic transport intersections
(Stellenbosch Municipality, 2017a). One of the principles identified in support of this
strategic perspective is higher development densities supported by urban edges
that are strictly maintained. Neither the overall nodal proposals, nor the more
detailed conceptual proposal maps for each of the 14 nodes however provide more
detailed spatial guidelines for this densification process apart from the clearly defined
urban edges. According to the SDF each node has unique characteristics that make
different combinations of densification and greenfields development appropriate.
The SDF recommends that development should thus target infill and redevelopment
of strategic areas and identified a number of principles in support of higher densities
under the strategic perspective of optimal land use:
• Various forms of infill and brownfield development opportunities should be
prioritized over greenfield sites
• Policy consistency is required for at least 10 years with regard to the approval of
applications in terms of whether they are inside or outside the urban edge.
One of the sector plans referred to in the SDF is the SU campus master plan. This
plan also supports the concept of increased densities and prioritizes infill and
densification over new developments. It also supports densification through optimalStellenbosch | Page 32 use of space in existing buildings and the application of appropriate new space standards. One of the identified impediments to achieving densification is the parking requirements as specified in the current LUMS and bylaws of the LM. The view has been expressed that these bylaws will have to be amended and that norms and standards will have to be applied consistently across the entire LM area to give practical effect to densification. The SDF also supports the idea of mixed land use development based on the principle of “functional integration” to inform settlement design. The SU campus master plan supports the principle of grouping of similar land uses but supports the concept of multi-functional use of space within existing buildings and also students residences (should not only be spaces for sleeping and eating but also for studying and socializing). The SDF clearly supports the concept of shorter travel time and travel distances and improved connections between places of residence, place of work and social amenities. One of the seven strategic perspectives of the SDF is interconnected nodes to inform settlement design. This perspective is supported by the principles of walking distance, functional integration, and socio-economic integration. The SDF also promotes the principle that at least 50% of activities found within the urban area should be within 1km of where people live. The plan also promotes the principle of intensification, integration and mixed use development around primary station precincts (Stellenbosch Municipality, 2017a:17) and the principle that suitable land located close to places of work should be made available timeously to cater for the residential needs of employees, particularly in the gap, social and middle income markets (2017:19). Moreover, the SU campus master plan supports the idea of providing new student residences as close as possible to the existing campus. The SDF supports the idea of a wider usage of alternative transport modes and recommends that all regional roads should facilitate non-motorized transport (particularly cycling) and suggests the possibility of constructing more stations on the Lynedoch – Klapmuts rail line. Some of the persons interviewed expressed reservation about the concept of rail as a feasible public transport option between the various nodes. The SU campus master plan as one of the sector plans referred to in the SDF also prioritizes alternative modes – especially the needs of pedestrians and cyclists. It also supports the concept of peripheral parking with a shuttle service to town center and campus. The SDF provides a number of very clear principles for dealing with informality. It recommends as one of its principles that areas of land should be set aside, and even goes as far as to suggest that if necessary expropriated, to provide SMMEs with access to well-located parts of the CBDs for retail, service provision and manufacturing. It uses the term SMMEs but does not clearly indicate whether it also refers to informal businesses. It also does not provide any details of the conditions under which expropriation will be considered. The SDF recommends as one of its principles that a range of informal retail locations should be provided on sidewalks,
You can also read