CLIMATE CHANGE ADAPTATION AND MITIGATION STRATEGY 2020/21 2025/26
←
→
Page content transcription
If your browser does not render page correctly, please read the page content below
CLIMATE CHANGE ADAPTATION
 AND MITIGATION STRATEGY
      2020/21 - 2025/26
Table of Contents
   MAYORS MESSAGE ............................................................................................................................. 1
   EXECUTIVE SUMMARY ........................................................................................................................ 2
   1.      Background ................................................................................................................................ 3
           Purpose ...................................................................................................................................... 4
           Changing Climate ....................................................................................................................... 9
           City of Wanneroo and Climate Change.................................................................................... 11
   2.      CCAMS 2020/21-2005/26 ........................................................................................................ 18
           Risk Assessment Approach ...................................................................................................... 18
 2.1.1.        Additional Risks .................................................................................................................... 18
           Action Identification Process ................................................................................................... 18
   3.      Target Setting ........................................................................................................................... 20
           Energy Use Emissions............................................................................................................... 20
           Fleet Emissions......................................................................................................................... 20
           Waste generation reduction .................................................................................................... 22
   4.      Risk Management and Adaptation and Mitigation Actions ..................................................... 23
   5.      Implementation ....................................................................................................................... 35
   References ........................................................................................................................................ 36
MAYORS MESSAGE

The City of Wanneroo acknowledges the significant impact climate change has on our
everyday lives and the importance of reducing the long-term effects.

Global climate change is everyone’s responsibility and we can make changes to the way
we live; whether it’s reducing plastic usage, conserving energy or carpooling when possible.

The City has already undertaken numerous initiatives to adapt to the challenges of climate
change. However, in order to become more resilient, further developments need to be made
to ensure we are prepared to deal with future risks such as reduced rainfall, severe weather
conditions, bushfires, storms and rising of sea levels.

This revised Climate Change Adaption and Mitigation Strategy provides an updated
direction on how we plan, prepare and respond to the effects of climate change, including
areas of mitigation.

The City is also in the process of developing an Urban Forest Plan, which will further assist
us in preparing for the impact on the community; including alleviating rising temperatures
through protecting and preserving existing trees and planting additional trees across the
City.

It is heartening to see the commitment and enthusiasm of our younger residents towards
climate change and working towards a brighter and more sustainable future. The City has
a responsibility to these young people, and subsequent generations, to limit negative impact
on our community.

The City is a signatory to the WA Local Government Association’s Climate Change
Declaration and was recently presented with a Certificate of Declaration which outlines
initiatives the City can implement.

Together, all these programs will enable us to reduce our carbon footprint, become more
agile in our approach and guide us to develop innovative plans to protect and enhance our
natural environment and the lifestyles of future generations.

Mayor Tracey Roberts JP

                                             1
EXECUTIVE SUMMARY
The City’s Strategic Community Plan 2013/14 to 2022/231 aspires to achieve a sustainable
natural, built and healthy environment. In response to this community vision, an action within
the City’s Corporate Business Plan 2015/16 - 2018/19 has been the preparation of the
Climate Change Adaptation and Mitigation Strategy (CCAMS).

The purpose of the CCAMS is to identify areas where the City and the community it
represents, are exposed to the effects of climate change and provide risk management
adaptation measures to reduce the risk, as well as to identify practical mitigation measures
that would aid with the mitigation of the impacts of climate change.

In Western Australia, the CSIRO predicts climate change to result in hotter days and nights;
reduced rainfall but more intense rain periods; more extreme weather conditions such as
long periods of drought and severe storms; more bushfires; and rising sea levels 3. It is
expected that the City will be affected by these impacts.

The original CCAMS placed more emphasis on adaptation i.e. the ways the City can adapt
to, and be prepared for the unavoidable impacts of climate change as they arise. The
revised CCAMS outlines the adaptation actions that are still required to be implemented
across the City, as well as raising the importance of and putting in place a number of
mitigation actions to be implemented i.e continue reducing energy consumption which will
contribute to carbon emission reduction.

The City's Risk Management Framework has been used to identify effective management
measures for the risks associated with climate change. The Framework will assist in the
implementation of the CCAMS adaptation actions and will allow for efficient allocation of
resources addressing the highest priority issues.

                                              2
1. Background
  The City recognises and acknowledges the risk that climate change presents to the City’s
  community, Western Australians and the wider global community. To date, the City has
  made significant progress in terms of reducing its impact on climate change through a
  number of key initiatives including preparation and implementation of CCAMS 2016-2020.
  This document updates the previous Strategy and puts in place appropriate measures to
  effectively address climate change within the City’s local government context, ability and
  jurisdiction.

  Adaptation and Mitigation

  Adaptation to climate change means taking action to adjust to the changes in the climate
  that are already underway such as temperature increases, reduced rainfall and extreme
  weather events, and to plan and prepare for the risk of bigger changes in the future, and
  resulting impacts such as sea level rise. For the City, this means changing the way we
  operate to safeguard our communities against the negative impacts of climate changes as
  above (e.g. ensuring homes are built in safer places, planting more trees to moderate
  ground temperatures, use plants that need less water, etc.).

            The Intergovernmental Panel on Climate Change (IPCC) defines climate
       adaptation as: "an adjustment in natural or human systems in response to actual
        or expected climatic stimuli or their effects, which moderates harm or exploits
                               beneficial opportunities (2018) "5

  The City’s main priority is to be able to adapt to the impacts of climate change that are
  predicted to be of a large scale, highly likely or inevitable as it impacts on the local
  government area and is within the City’s ability and jurisdiction.

  Climate change mitigation means taking initiatives to prevent (i.e. contribute to actions that
  help to delay, reduce or avoid) further climate change. The best example of mitigation is to
  reduce the carbon footprint, which is a global level initiative but must be contributed to at
  the local level, and primarily involves energy use reduction and shifting away from fossil
  fuels.

           The CSIRO defines mitigation as actions that aim to reduce the amount of
         climate change, typically by limiting the future increases in concentrations of
                        greenhouse gases in the atmosphere(2011)"6

  The City should demonstrate through its actions that it is taking active steps to reduce its
  contribution GHG emissions that are causing changes in the climate.

  By implementing adaptation actions to reduce climate change impacts, the City can also
  indirectly reduce its overall contribution to GHG emissions, which would contribute to
  mitigation. For instance, an adaptive action to cope with a hotter climate such as planting
  trees throughout the City, can serve to reduce air-conditioning use required to ensure
  comfort to occupants of buildings. The reduced energy consumption leads to a reduction in
  greenhouse gases, and additionally trees will absorb carbon dioxide through photosynthesis
  so further reducing GHG emissions. In addition, the City will continue to undertake active
                                                3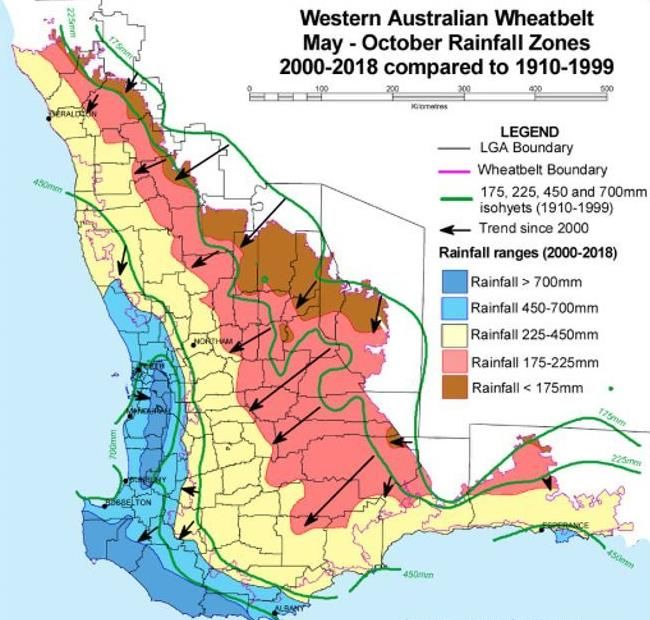
mitigation through implementation of its Energy Reduction Plan, which was an initiative of
the previous CCAMS, to reduce City’s emissions. This scenario is outlined in Figure 1.

                                                                      City prepared for
                                                                       climate change
                                                                           impacts
    Climate Change                  Adaptation Actions
   Risk Management                           +
    and Adaptation                  Mitigation Actions
         Plan                                                            Indirect and
                                                                       Direct Mitigation
                                                                          outcomes
 Figure 1   CCAMS outcomes

       Purpose

As a local government, the City, on behalf of the community, shares a responsibility for the
management of risks to public assets (including the natural environment) associated with
climate change. This involves creating an institutional framework that promotes and
supports adaptation to and mitigation of climate change whilst delivering services to the
community. Through consultation with its residents, including the City’s youth, the City has
identified the need to have a stronger vision and a clear strategy for responding to climate
change. This conversation, which is ongoing, has informed the review of this revised
strategy.

Global organisations, such as the IPCC and The United Nations Framework Convention on
Climate Change (UNFCCC), an entity tasked with supporting the global response to the
threat of climate change, have long been encouraging risk management, adaptation and
mitigation strategies, so that society is prepared for climate change. The UNFCCC is the
parent treaty of the 1997 Kyoto Protocol and the 2015 Paris Agreement. These aim to
stabilise greenhouse gas concentrations in the atmosphere at a level that will prevent
dangerous climate system changes, allowing time for ecosystems to adapt naturally and
enable sustainable development19. According to professor Jean Palutikof Director of the
Australian National Climate Change Adaptation Research Facility, “the scientific evidence
points strongly that there will be unavoidable climate change even though our mitigation
efforts can reduce some impacts. As Australia’s climate changes in increasingly significant
ways over the coming decades we need to be sure that we are ready (4)”.

Local governments are at the forefront in dealing with the impacts of climate change at a
local level, so innovative planning and appropriate action in both mitigating the impacts of
and adapting to the climate changes by the City is essential.

The CCAMS implements the aspirations identified by the community in the City’s Strategic
Community Plan (SCP) 2017/18-2026/27 and implements the actions of the Corporate
Business Plan (CBP) 2019/20-2022/23 as demonstrated in Figure 2. The SCP is a long-
term, overarching document that presents the vision and aspirations for the future of the
community, and sets out key strategies and actions required to achieve these aspirations.

                                             4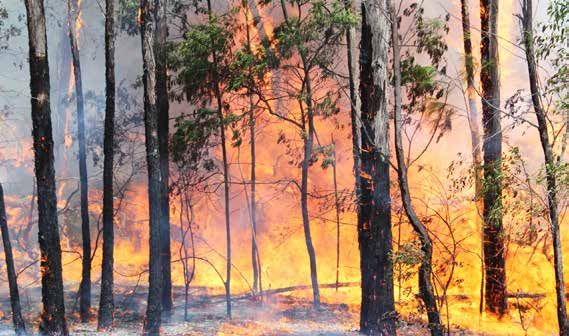
Strategic Community Plan
                                                             2017/18-2026/27

                                                                                                Civic
                                     Economy         Environment           Society
                                                                                             Leedership

                                              Local            Strategy 3.1.1
                                         Environmental       Minimise impacts
                                            Strategy         of climate change

    Flora &           Land &         Climate       Community       Air & Energy      Water
     Fauna            Waste          Change

                                     CCAMS

Figure 2      City of Wanneroo Climate Change Adaptation and Mitigation Strategy strategic alignment

In response to the SCP, the City’s Local Environment Strategy 2019 (LES) outlines the
City’s overall approach to protecting and managing the key environmental resources and
values important to the City’s future. The LES acts as an extension to the Environmental
pillar and provides a direct response to the community’s expectations through the six
themes of flora and fauna, land and waste, community, climate change, air and energy, and
water. Climate change has impacts on and or gets impacted by the other five themes,
however it has been separated due its complexity and level of importance.

Before development of CCAMS 2016-2020

Before development of the CCAMS, the City’s risk management process identified climate
change as a strategic risk to the City with the overall risk rated as high in the City’s Risk
Register. This had resulted in various initiatives being developed and implemented to deal
with this risk.

The City’s Local Environment Plan 2009-147 later replaced by the Local Environment
Strategy 2019, promoted a focus on reducing greenhouse gas emissions. In line with this,
and to demonstrate its commitment to sustainability in 2011, the City in 2011 jointly
sponsored the design and build of the award winning EcoVision display homes. The two
homes showcased best practice affordable and sustainable design options including water
conservation, greywater recycling, photovoltaics, healthy home principles and universal
design. The homes were open to the public for 12 months and took out numerous awards
including the National Greensmart Award for the Sustainable Townhouse/Villa category.

The City has also funded large scale solar panel systems at high energy usage sites that
had been identified as having ideal conditions for solar panel investment. These include the
Civic Centre, Aquamotion, Kingsway Sporting Complex and Clarkson Library. This has
ensured the City is less reliant on non-renewable electricity and has provided a
demonstration of Council’s commitment to the environment - achieving environmental
outcomes in a financially viable way.
                                             5
The City has diversified its investment in the future by installing a voltage optimisation
system at Aquamotion. This electrical energy saving device is further cutting the City’s
energy usage by ensuring less energy is wasted within the facility. Undertaking the Civic
Centre extension project has had a high level of sustainable inclusions, including passive
solar design orientation, solar panels, energy efficient lighting and sunshades (reducing the
need for air conditioning). All of these features ensure less reliance on electricity derived
from non-renewable sources.
Changes since CCAMS 2016-2020 came into effect
In July 2019, through the City’s risk management process, risk rating of climate change as
a strategic risk to the City has been downgraded from high to moderate based on existing
management systems and controls in place, including the City’s:
Local Environment Strategy 2019; Coastal Hazard Risk Management
Local Biodiversity Plan 2018/19-2023/24; Adaptation Plan (CHRMAP)
Climate Change Adaptation and Mitigation Development Consultation Process;
Strategy 2016-2020; District Emergency Management
Energy Reduction Plan 2017-2020; Committee;
Coastal Assets Policy; Local Emergency Management
Local Planning Policy 4.21; Committee;
Bushfire Committee; Local Emergency Management
Bushfire Management Plan; Arrangements; and
Sand Renourishment Programs; Local Planning Policy 4.10
Streetscapes etc.
Implementation of the CCAMS has seen a number of initiatives and projects undertaken
including energy and water audits of a number of high use facilities, implementing audit
recommendations, and achieving significant water and energy savings. The City
participated in the joint Department of Water and Environmental Regulation (DWER) and
Water Corporation’s Waterwise Council Program, and in 2020 received endorsement as a
‘gold’ Waterwise Council. The City is also putting in place an Environmental Management
System (EMS) to record, manage and analyse environmental-related data relating to all the
City’s activities, and to identify where environmental impacts might or are occurring, ensure
appropriate actions are put in place to prevent and eliminate them. The EMS is underpinned
by a risk assessment approach and includes risks relating to climate change.
In September 2019 the City endorsed an Environment Policy which demonstrates the City’s
commitment to protecting and enhancing its natural environment and incorporating the
principles of ecologically sustainable development throughout its operations and business
activities to benefit current and future generations taking into account environmental,
economic and social impacts (Triple Bottom Line). It also makes specific commitment to
adapting to the changing climate and where practical, minimising its contribution towards
climate change.
Following a community petition in October 2019, for the City to declare a climate emergency,
the City strengthened its commitment to address climate change by becoming a signatory
to the Western Australian Local Government Association’s (WALGA) Climate Change
Declaration. The Declaration acknowledges that climate change is occurring and will
continue to have significant effects on the environment, society and economy, and that
human behaviours, pollution and consumption patterns have both immediate and future
6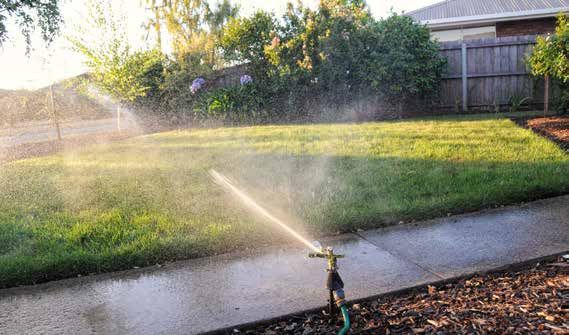
impacts on the climate and environment. Through the Declaration, the City also commits to
strengthen its actions towards adaptation and mitigation, as reflected by the CCAMS.
In addition to the above adaptation actions, initiatives and resultant indirect climate change
mitigation, the City has an Energy Reduction Plan (ERP). The ERP has been reviewed in
line with the new CCAMS, and in its revised form will continue to reduce the City’s energy
use. It will also seek to encourage the City’s community to reduce their energy use, thereby
also contributing to overall reductions of GHG emissions. The City has conducted an
independent energy audit of the top 20 energy use sites and has identified a range of energy
efficiency improvements. The City also addresses GHG emissions issues through a range
of policies, strategies and action plans including:
Environment Policy Waste Management Services Policy
Purchasing Policy (Sustainable Procurement) Waste Plan 2020-2025
Investment Policy Waste Education Plan 2018/19-
Local Biodiversity Plan 2022/23
Waterwise Council Action Plan Bushfire Risk Management Plan
Water Conservation Plan
Table 1 below, outlines examples of completed/ongoing and current measures undertaken
by the City to address impacts of climate change, including associated risks and related
impacts.
Table 1 Risks, measures undertaken and related impacts
Risk Measures undertaken Related impact
Increasing Implementation of Local Emergency Management and Increased
temperature Recovery Plans; potential for
Annual bushfire awareness community day; bushfires
Annual review of current emergency management risks
within the City;
Quarterly local Emergency Management Committee
meetings with all relevant agencies; and
Employment of Fire Protection Officers by the City.
Increasing Annual tree planting programs implemented at various Increase in
temperature sites around the City including wetlands, bushlands, surface
foreshore, parks/reserves, streetscapes and residential temperature
verges;
Shade policy incorporated into the Local Planning Policy
4.3: Public Open Space as a standard requirement with
preference given to tree planting as primary shade
provider for playgrounds and picnic areas, however,
installation of a shade sail until such time as tree shade is
adequate is required;
Shade sail installation program for existing sites that do
not have adequate shade;
Preparation of Streetscapes local planning policy;
Implementation of a Mosquito Monitoring Program and
public education campaign to reduce the potential
increase of mosquitos;
Investigation into alternative pathway and road materials
to reduce urban heat island effect and increase proportion
of recycled materials used; and
Commenced preparation of the Urban Forest Plan.
7
Risk Measures undertaken Related impact
Reducing Implementation of Hydrozoning program involving the Reduced water
rainfall staged replacement of irrigation systems in parks and availability for
reserves, to ensure water is used more effectively parks and other
throughout parks; irrigated areas
Wetting agent dosing units installed to all irrigation
systems on Active Sports Fields and will continue to be
installed at new sites;
Preparation and implementation of North West Corridor
Water Supply Strategy (with Department of Water);
Comprehensive assessment of water usage within City
buildings has been carried out (water audits of top 10 high
use sites) identifying savings with a plan to continue; and
Participation in the Waterwise Council Program and
development of a Waterwise Council Action Plan.
Extreme Implementing the City's Coastal Monitoring Programme More intense
weather which includes: storms
events
o Six monthly photographic monitoring;
o Post storm inspections;
o Six monthly coastal surveys of the whole City
coastline; and
o Annual condition assessment of coastal protective
structures (groynes, breakwaters and seawalls).
Aerial Coastal Surveys;
Regular sand nourishment along areas of the City’s
coastline subject to coastal erosion;
Reviewed City’s insurance policies to ensure they
adequately treat climate change risks;
Conducted risk assessment on current (older) stormwater
systems; and
Reviewed City’s stormwater drainage specification
design standards.
Sea Level Implementation the Coastal Hazard Risk Management Storm surges
rise and Adaptation Plan; and flooding
Preparation of Coastal Assets Policy; and
Photographic monitoring and survey of beach levels twice
yearly at Quinns Beach, Two Rocks and Yanchep Lagoon
to monitor long term coastal erosion.
8Changing Climate
Over the last 130 years, the globe has warmed by approximately 0.85°C, with each of the
last three decades being warmer than the previous one, as evident in Figure 3. Major
contributors to this warming are human activities, which includes the burning of fossil fuels
and release of large quantities of greenhouse gases into the atmosphere (Figure 4)8. These
gases become trapped within the lower atmosphere increasing the temperature of the global
climate, resulting in a ranges if effects including glaciers melting, sea levels rising, rainfall
patterns changing and extreme weather events becoming more intense and more frequent8.
Figure 3 Global average temperature from 1850 to 201915
Figure 4 Annual total CO2 emissions, by world region15
Over the past 50 years in Australia there has been an increase in heatwaves, less rain, less
frosts, increase in droughts, and a slight rise in sea level. The Australian population have
seen these changes in their daily lives, and through flow-on effects such as higher fresh
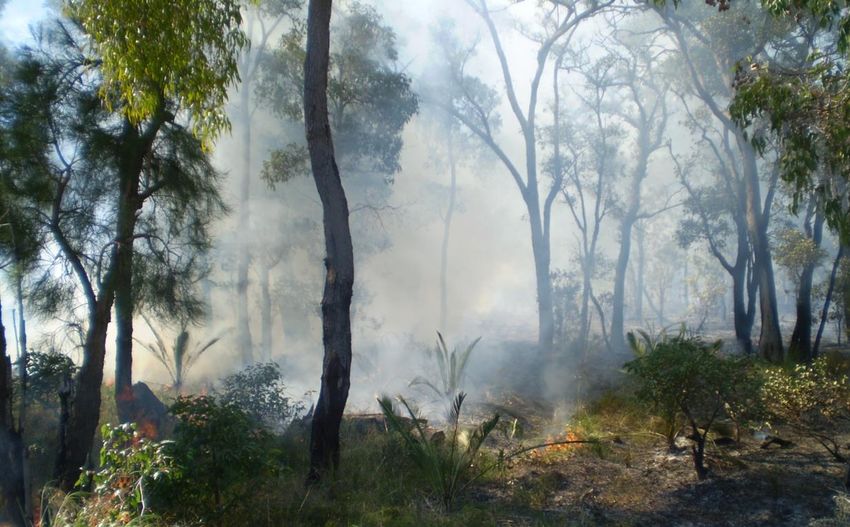
9food prices and water restrictions in certain parts of the country9. In recent years, bushfires
have become more frequent, more intense and affecting more people than ever. Also fire
seasons have extended, now starting earlier and lasting longer. Making decisions for
multiple futures requires recognising system uncertainty in planning and being flexible and
adaptive. While it is important to have long term outlooks and actions, having shorter time
scales allows for having more confidence and reduced uncertainty10.
The climate modelling community has developed Representative Concentration Pathways
(RCPs) in 2011 to explore credible future options. The Australian climate change projections
according to CSIRO are derived from climate models forced by the RCPs. There are four
RCPs, RCP8.5, RCP6.0, RCP4.5 and RCP2.611. RCP8.5 predicts a future with little curbing
of emissions, with a CO2 concentration continuing to rapidly rise, reaching 940 ppm by
2100. RCP6.0 with application of some mitigation strategies and technologies predicts
CO2 concentration reaching 660 ppm by 2100. RCP4.5 predicts emissions peaking around
2040, and the CO2 concentration reaching 540 ppm by 2100. RCP2.6 was the most
ambitious mitigation scenario, with emissions peaking early in the century (around 2020),
then rapidly declining. Considering the current global greenhouse gas concentration levels
and trends (Figure 5), this scenario does not appear likely, which means not achieving the
Paris agreement of 1.5°C temperature limit. The latest assessment found that the world in
2020 was on a path to 2.9°C of warming; however, because of the recent more ambitious
targets and commitments by some countries warming is estimated at 2.1°C by 2100, which
is still short of the Paris target.
Figure 5 Emissions of CO₂ across the RCPs (left), and trends in concentrations of carbon dioxide (right). Grey
area indicates the 98th and 90th percentiles (light/dark grey) of the values from the literature. The dotted lines
indicate four of the SRES marker scenarios11
The diagram in Figure 6 outlines the expected climate change impacts in Western
Australia.
10Impacts of Climate
Change in WA
80% increase in Bushfires will
drought months become more
by 2070 frequent and severe
Since 1960, the
Sea level rise of up to
natural disaster
1m by 2100 is predicted
events have tripled
and could potentially
and are predicted to
impact up to 30,000
increase
residential buildings
Extreme high Days above 35°C are
temperatures will predicted to increase
contribute to more from 28 days to up to 67
human deaths related Wheat production is
days per year by 2070
to respiratory and predicted to decline by
cardiovascular 13.4% by 2050 with a
disease similar decline in meat
availability
Figure 6 Impacts of Climate Change in WA (Sourced from WHO8 and Department of Environment12).
City of Wanneroo and Climate Change
The City will experience numerous impacts resulting from changing climate. This section
details the changes in temperature, rainfall, extreme weather and sea level and outlines
how these changes may impact the City.
Temperature
Wanneroo’s average temperature has increased since 1910 in line with the Perth average
and is predicted to continue rising. It is expected there will be more hot weather and less
cold weather, with more record hot weather and an increase of average temperature (Figure
7). Perth's temperature has increased by just over 1.0°C since 1910 to 201813. Under the
Representative Concentration Pathway RCP8.5, the average temperature is predicted to
increase between 0.5 to 1.5°C by 2030. If greenhouse gas emissions continue to rise at
rates consistent with past trends, warming is projected to be in the range of 0.5 to 3.0°C by
2050, and between 3.0 and 4.5 by 20909.
11Figure 7 Increased probability of hot extremes and decreased probability of cold extremes with
an increase in average temperatures17
The following impacts and consequences (Table 2) are predicted to apply to the City both
in the immediate and long-term future, as a result of the predicted increase in temperature.
Table 2 Increased temperature impacts and consequences
Impacts Consequences
Increased risk of
bushfires Increase in home evacuations to recovery centres;
(Figure 8) Access blockage on major arterial roads and train lines;
Death of people unable to evacuate;
Disruption to the biodiversity cycle resulting in biodiversity loss;
Increase in weed invasion;
Impact on water quality;
Damage to council facilities and property;
Damage to street lighting; and
Loss of power.
Impacts upon
human health Rise in food poisoning cases;
Increase in mosquito borne diseases (and various other potential disease
vectors); and
A rise in heat stress and mental health issues particularly on vulnerable
groups such as elderly and children, which will result in increased pressure
on medical facilities.
An increase in
surface Loss of and/or severe stress on plants/vegetation cover and trees (i.e.
temperature street and civic landscaping, conservation reserves, etc.)
Potential air conditioner malfunction due to overuse;
Financial stress (cost of transport and cooling); and
Impacts on transport systems (buckling of rail lines and road wear and
tear).
Damage to
agricultural Increase in food costs and an overall reduction in productivity that will
crops see changes in the agricultural industry;
Potential for cleared rural lands to become ‘dead’ zones with no
vegetation cover; and
Subsequent impacts on land use, economy and employment.
12Figure 8 shows the trends from 1978 to 2017
in the annual (July to June) sum of the daily
Forest Fire Danger Index as an indicator of the
severity of fire weather conditions. Yellow to
red colours, are indicative of an increasing
length and intensity of the fire weather season.
Climate change, including increasing
temperatures, is contributing to these
changes13.
Figure 8 Severity of fire weather conditions across
Western Australia (trends from 1978 to 2017)13
Rainfall
Autumn and winter seasonal rainfall throughout the Perth Metropolitan area, including the
City has declined by 20 per cent over the past 60 years14. This drying trend has intensified
over the last 20 years with very much below average rainfall as per Figure 9, and with other
parts of the state having lowest on record rainfall. Annual rainfall in the south-west is
projected to decline by 6% by 2030 and 12% by 2090 for a medium-emission scenario, and
by 5% and 18%, respectively for a
high-emission scenario14. April to
October rainfall deciles (data
ordered into 10 groups with an
equal number of data points in
each) for the last 20 years (1999–
2018). A decile map shows where
rainfall is above average, average
or below average for the recent
period, in comparison with the entire
rainfall record from 1900.
Areas across northern and central
Australia that receive less than 40
per cent of their annual rainfall
during April to October have been
faded13.
Figure 9 April to October rainfall declines between 1999 and 201813
13Decreasing rainfall is contributing to the reduction of ground water levels held
in the Gnangara water mound. This is reflected in related wetlands, including
Lake Joondalup and Loch McNess (Yanchep National Park), with lowering
water levels, exposed acid sulphate soils, water quality deterioration and
negative ecological impacts16. Decreasing rainfall also poses a risk of lack of
water for irrigation purposes.
Along with reduction in annual
rainfall, rainfall zones are also
shifting in the south west direction
having a significant effect on the
agricultural sector as well as other
natural/ ecological processes
dependent on seasonal rainfall
(Figure 10)14. Table 3 presents the
impacts and consequences that
are predicted to affect the City.
Figure 10 May to October rainfall zones shifting due to climate change14
Table 3 Reduction of rainfall impacts and consequences
Impacts Consequences
Reduced water
availability for park Reduced turf quality of playing fields and park closures affecting
areas community health and lifestyle.
Increasing cost to
deliver services As water supply reduces the price is likely to increase.
Reduced water
availability for Increase in food costs and an overall reduction in productivity that will
agricultural crops see changes in the agricultural industry; and
Subsequent impacts on land use, economy and employment.
Reduced water
availability for Loss of biodiversity; and
ecosystem Loss of amenity and cooling affect from natural water bodies.
services
14Extreme weather
Climate change induced extreme weather events are increasing in frequency and or severity
as evident in Figure 11. Not shown on the graph, 2018 was a year of wild weather both
globally and in Australia17. Drought-months (months without rainfall) are predicted to
increase by 20 per cent by 2030 and up to 80 per cent by 207014. This will consequently
increase the number of fire-weather risk days.
In the south-west in recent years, including the metropolitan area, hot spells have become
more frequent, and it is predicted that average annual number of days with temperatures
over 35°C will increase from 28 days in the recent past (1971–2000 average) to 36 days in
2030, and to 40 days and 63 days in 2090 for intermediate and high-emission scenarios,
respectively14.
Figure 11 Number of extreme weather events worldwide17
It is predicted with medium to high confidence that the intensity of heavy rainfall events will
increase14. This is likely to cause more flash flooding and with an increase in wind speed,
damage both built infrastructure and natural assets. Impacts and consequences associated
with extreme weather are presented in Table 4, with bushfire risk covered in Table 2 above.
Table 4 Extreme weather impacts and consequences
Impacts Consequences
More intense
storms Damage to vegetation causing hazards for people and animals (e.g.
falling tree branches);
Damage to structures of all types;
Road closures; and
Loss of biodiversity.
15Increase in
storm surge Beach erosion; and
Damage to coastal facilities, property and structures.
Aberrant
extreme High costs due to damaged infrastructure and buildings; and
weather events Increased risks to human safety.
Sea level rise
The rate of sea level rise is predicted to be greater in the 21st century than over the past
four decades, with coastal cities such as Perth having an average increase of 60 – 66 cm
by 2090 for RCP8.5 (high concentration scenario) and 45 – 47 cm for RCP4.5 (medium
concentration scenario) (Figure 12). A likely range of change for RCP8.5 could be wider
ranging from 38 cm to 89 cm across these cities18.
Figure 12 Sea-level change around Australia by 2090 (2081-2100) compared to 1986-2005 for the three
concentration scenarios (RCPs) according to CSIRO and Bureau of Meteorology18
The City’s coastline extends 32 kilometres from Tamala Park to Two Rocks and is
characterised by marinas, coastal limestone cliffs, coastal heathland vegetation and relic
sand dune formations occurring as beach ridges. Even though there may not be serious
direct impacts from the rise of the sea level (at ‘normal’ conditions) to the City’ coastline,
impacts would be amplified when combined with intensified storm events. Table 5 outlines
how the City will be impacted by sea levels rising.
Table 5 Sea Level Rise Impacts and consequences
Impacts Consequences
Storm surges and
flooding Erosion and inundation of dune systems;
Damage and loss of coastal structures including recreational facilities,
marinas and harbours (including the damage and loss of boats and
ships);
16Impacts Consequences
Damage to residential and commercial buildings, facilities and parks
resulting in devaluation of private properties and litigation;
Effects on unconfined aquifers and contamination of bores;
Impacts on infrastructure including leakage to septic tanks and sewer
systems, causing instability of swimming pools, tanks and other
subsurface structures that are not anchored; and
Impact on roads and City owned infrastructure.
Conclusion
In summary, the City has a challenge ahead to ensure its assets and the community are
prepared for the potential impacts of climate change. Effective adaptation and mitigation
planning is needed to reduce the expected impacts, consequences and risks associated
with climate change. Through the City’s risk management process and integration of climate
related risks into the City’s Environmental Management System (EMS) the City will continue
to address and strengthen the adaptation and mitigation efforts going forward.
Source: Crops Wanneroo (Wes Cooper), Loch McNess Dried up (Steve Copsy) and Mental Health (WA Government)
172. CCAMS 2020/21-2005/26
At present the City is improving its management of climate change by developing and its
EMS in alignment with international standards (ISO 14001). This has resulted in the
following advances.
Risk Assessment Approach
As part of the preparation of the previous CCAMS, the initial risk assessment process
examined the level of climate change risk for the City in the areas of temperature, rainfall,
extreme weather events and sea level rise, with temperature and rainfall rated as high, and
extreme weather and sea level rise as moderate.
The re-assessment of climate change related risks as part of the new CCAMS was
undertaken slightly differently by incorporating them into the City’s risk management
process by using the City’s EMS, rather than in the CCAMS itself. Corporate level as well
as operational level risks associated with areas of temperature, rainfall, extreme weather
events and sea level rise, were identified and assessed or re-assessed in August 2020 and
incorporated onto the EMS. Going forward, these risks will be monitored along with other
significant environmental risks within the EMS’s Environmental Aspect Register and
reviewed on a regular basis through the City’s Risk Management process.
2.1.1. Additional Risks
The review process recognised there are subsequent risks to climate change adaptation as
a consequence of insufficient mitigation actions. If there are insufficient or no actions taken
to mitigate, over a longer period the result would be an escalation in adaptation related
issues and impacts, which would in turn increase the risk rating. A more immediate risk to
the City would be reputational resulting from community dissatisfaction. Nevertheless, it is
noted that the City as a local government has a limited capacity and jurisdiction to implement
various mitigation strategies that the community often assume their local government
should act on. Having said this, the City has been addressing all possible areas it can take
action on within its jurisdiction at this stage, and will strive to do increasingly more in the
future as the implementation of the Strategy progresses.
From a sustainability perspective, there are also opportunities associated with the risks and
GHG emission reductions in particular. It is important that the City take all opportunities to
pursue proactive initiatives, particularly those that translate to economic benefits to the
community, good business management and financial outcomes. There are social and
corporate responsibility requirements associated with this.
Action Identification Process
A review of the nominated actions identified by the previous CCAMS has been conducted
as part of the CCAMS review. Actions completed or that have become standard operational
practice or policy, have been removed, whilst some existing actions will continue and a
number of new actions introduced. The new actions were developed based on the risks
18and opportunities identified through the EMS risk assessment approach, learnings from
implementation of previous CCAMS actions, internal consultation, updated science and
research available. Policies that need to be updated or newly created to address risks have
also been identified. The City has taken into account the views and concerns raised in the
Climate Change Youth Forum conducted in December 2020. The document has also been
advertised and feedback obtained from the wider community.
Section 4 outlines the risks and actions identified to address the following:
Temperature related risks – Impacts associated with increase in temperature will be
alleviated through various actions with one being development and implementation of an
Urban Forest Plan that will decrease negative impacts on human health, decrease carbon
emissions and cost of living, and improve liveability.
Rainfall related risks – In response to the impacts of declining rainfall the City will amongst
other actions be advocating to State Government as well as developers to adopt innovative
approaches to water reuse and recycling, reducing dependency and need for both scheme
and groundwater.
Extreme weather events related risks – Dealing with impacts of extreme weather, the
City will continue implementing the coastal monitoring and storm response program for the
City’s coastline and associated assets.
Sea level rise related risks – In order to provide accurate and up to-date advice in relation
to planning and dealing with impacts of sea level rise the City plans to review and update
Coastal Vulnerability Assessment and Hazard Mapping as per the schedule and as new
scientific data and mapping becomes available.
Mitigation related risks – The City is planning to strengthen existing and develop new
policies related to emission reduction and will investigate various practical opportunities that
would result in substantial energy and therefore carbon emission reductions.
Multi-risk adaptation and mitigation – Opportunities that will deal with multiple risks and
will achieve both adaptation and mitigation outcomes have been segregated and include
actions such as revising Local Planning Schemes and local planning policies. This will
ensure climate change impacts and relevant mitigation and adaptation measures are
adequately addressed through appropriate land use planning mechanisms in terms of
liveability, emergency response and creating resilient communities.
In order to implement the various actions, the timeframe for the commencement and
completion of the actions have been identified. Relevant service units have also been
assigned to lead the implementation, with others identified to support the implementation of
the actions.
193. Target Setting
Understanding where and how greenhouse gas (GHG) emissions are produced/emitted is
the first step towards effective emission reductions. The second step involves measuring
the emissions to allow for setting baseline data and finally setting of the targets. Target
setting is important as it creates a method for quantifying a desired outcome and tracking
progress towards it.
Targets have been determined considering both industry best practice and the need for
improved data collection and analysis, while being realistic and recognising that the City is
growing with the number of assets increasing each year as well as the number of
households being serviced for waste collection. Due to complexity of monitoring and
calculating the emissions, the City has decided to split the target into three categories.
Emissions from energy use (electricity and gas) by City assets;
Emissions from fuel use by City fleet (diesel and unleaded petrol); and
Waste generation reduction (reducing emissions associated with decomposition of
waste).
Long-term target year 2029/30 has been chosen for energy use emissions and waste
reduction with interim target year 2024/25. Short-term target year 2024/25 has been chosen
for emissions associated with fleet. Fleet targets only consider the City owned and operated
vehicle fuel use, with plans to establish better data collection to capture emissions
associated with contracted services. Targets will be revised at end of interim target period
(as part of the next CCAMS review) or earlier if significant data collection improvements are
identified, including contractor data and past data collection or analysis.
Energy Use Emissions
With increasing population and more assets to service the growth, the City has chosen to
set an average ‘per asset’ emission reduction target as outlined in Table 6. This is based
on the overall use of energy averaged per asset with an asset being identified by having a
gas and/or electricity account associated with it (e.g. parks, community facilities, etc). The
reason for choosing this target is because it relates to City owned and/or managed assets
over which the City has control or potential to influence.
Table 6 GHG emission reduction targets associated with energy use at City assets
Number of Energy use Total emissions Average emissions
Year
assets (MWh equivalent) (t CO2-e) * per asset (t CO2-e)
2019/20
380 12,151 8,384 22
(baseline)
2024/25 Interim target (10% reduction from baseline by 2024/25) 20
2029/30 Long-term target (25% reduction from baseline by 2029/30) 17
* Emissions resulting from electricity and gas used at council owned buildings and parks (excluding Western Power street lighting).
Fleet Emissions
The City vehicle fleet consists of various types and size of vehicles using either unleaded
petrol or diesel, with the exception of two electric vehicles. Targets have been split into fleet
(ULP) and fleet (diesel) due to different emission factors being used to calculate emissions
20produced. The overwhelming majority of diesel consumption is attributed to waste trucks
with small to medium size vehicles using predominantly unleaded petrol (ULP).
Baselines selected for Fleet (ULP) and Fleet (Diesel) differ slightly due to an anomaly in
diesel data. Both baselines align with the development and endorsement of the CCAMS
2016-2020 and Energy Reduction Plan 2017/2020.
The Fleet (ULP) target of 25 % reduction in GHG emissions from 2017/18 baseline by
2024/25 as outlined in Table 7 is based on the current trend and the plans the City has to
continue improving efficiency, reducing fleet size and purchasing hybrid and or electric
vehicles.
Table 7 GHG emission reduction targets associated with fleet using ULP
Fleet (ULP)
Year (kL) GHG emissions (t CO2-e)
2017/18 (baseline) 119 275
2018/19 116 268
2019/20 105 242
Target (25 % reduction from baseline by 2024/25)
2024/25 89 206
Note: GHG emissions were calculated using factors taken from Department of Environment and Energy (National Greenhouse
Accounts Factors August 2019).
For the diesel fleet the target has been set based on the emissions per bin serviced per
year. The reason for this target is an expectation that the total fuel use and therefore
associated emissions will increase in the short term as a result of the city growing and more
households being serviced. The target chosen has been based on the projections from
current per bin emission trend, the City progressively replacing the fleet with more efficient
trucks, and looking into hybrid technologies. Even though the total emissions are expected
to see an increase in the short term, the City can still show that is doing all it can to improve
efficiency.
The City is planning to introduce a 3rd bin system to separate the greens which will result in
an increase in the number of bin collections and associated trips to empty the trucks. This
service will be contracted out and excluded from current targets, but with a view to include
it at the next review together with other contractor data.
The target is to reduce the diesel using fleet GHG emissions per bin serviced per year by
25% from 2016/17 base year level by 2024/25 (target 0.47 kg CO2-e per bin per year).
Table 8 GHG emission reduction targets associated with fleet using diesel fuel
Fleet (diesel)
GHG
# of bins
GHG emissions per
serviced
Year Diesel (kL) emissions bin serviced
(current 2
(t CO2-e) per year
bin system)
(kg CO2-e)
# of bins
2016/17 serviced
1,242 3,378 5,365,620 0.63
(baseline) (future 3
2017/18 1,191 3,240 5,465,772 0.59 bin system) t CO2-e
212018/19 1,145 3,115 5,547,516 0.56
2019/20 1,155 3,141 5,649,228 0.56
Target (25% reduction per bin serviced
2024/25 per year from baseline by 2024/25)
0.47 8,073,498 3,795
Note: GHG emissions were calculated using factors taken from Department of Environment and Energy (National Greenhouse Accounts
Factors August 2019). Number of households estimated using ‘Average people per households’ from 2016 ABS Census Qiuckstats.
Waste generation reduction
It is well known that a significant by-product of waste disposal is gas emissions into the
atmosphere. When organic waste decomposes in landfills, it releases methane and other
greenhouse gases, contributing to climate change. Calculating the emissions from waste is
complex and dependent on a number of factors such as the size, type and operation of
landfill as well as legacy emissions. Therefore, rather than attempting to estimate and
convert amount of CoW waste being deposited to the landfill managed by Mindarie Regional
Council, the City has decided to set a waste generation reduction per capita per year target.
The target is to reduce Municipal Solid Waste generation per capita by 10% by 2024/25 and
20% by 2029/30 based on 2014/15 levels. This target, including the baseline aligns with the
Waste Strategy 2030, with the City already meeting its target of 10% in 2018/19, therefore
being on track for the target years (Table 9).
Table 9 Waste generation reduction per capita per year
Waste Reduction to Target
Total domestic status
Year Population generation per date from
waste generated (t)
capita/year (kg) base year (%)
2014/15
185,876 90,297 486 -
(baseline)
2015/16 194,778 90,483 465 4.4
2016/17 198,787 90,905 457 5.9
2017/18 202,051 90,205 446 8.1
2018/19 204,788 89,429 437 10.1 Target met
2019/20 206,860 90,237 436 10.2 Target met
Target (10% reduction from
2024/25 437 - On target
baseline by 2024/25)
Target (20% reduction from
2029/30 389 - On target
baseline by 2029/30)
Note: Bins serviced are based on population and household forecasts sourced from profile id (2016 to 2041, prepared by .id, May 2020.)
224. Risk Management and Adaptation and Mitigation Actions
The timeframe relating to how long it is expected for an action to be completed following commencement will be set as SHORT, MEDIUM and LONG term and defined as:
SHORT 1 - 2 years
MEDIUM 3 - 5 years
LONG over 5 years
1. TEMPERATURE RELATED RISKS
Temperature increase of up to 3°C by 2050
Increased surface temperature, increased bushfire potential, impacts on public health, increased stress on biodiversity, impacts to agriculture, impacts to transportation
systems and financial costs.
ACTIONS RISK RELATED LEAD SERVICE COLLABORATING RESOURCES MEASURABILITY ACTION DURATION IMPLEMENTATION
IMPACTS UNIT SERVICE UNIT OF SUBSEQUENT
Commence Timeframe ACTIONS/PLANS
1.1 Develop an Urban Forest Plan Human health Strategic Land Parks & Additional Report on targets (i.e. # 2020/21 Long 10 + years
(UFP) and incorporate actions into impacts. Use Planning & Conservation staff of trees planted,
the City's Environmental Increased emissions Environment Management resources preserved, creation of
Management System (EMS) and and cost of living required breezeways etc..).
relevant Service Unit Plans. from use of air-
conditioning.
1.2 Investigate preparation of a local Impacts upon human Strategic Land Land Staff time Draft planning policy 2022/23 Medium Up to 10 years
planning policy and/or guidelines for health. Use Planning & Development and guidelines
developers to improve energy Increased emissions Environment developed (with
efficiency performance of the built and cost of living examples from other
form within the City. from increased use LGAs) and presented
of air-conditioning. to working group for
further consideration.
1.3 Undertake investigation into Increase in surface Strategic Asset Land Staff time Results of the 2020/21 Short N/A
materials for roads that can reduce temperature Management Development; and investigation to inform
pavement temperatures to help Engineering consultant the feasibility of using
mitigate the Urban Heat Island Effect, Maintenance. costs the material on a wide
including financial viability. scale.
23ACTIONS RISK RELATED LEAD SERVICE COLLABORATING RESOURCES MEASURABILITY ACTION DURATION IMPLEMENTATION
IMPACTS UNIT SERVICE UNIT OF SUBSEQUENT
Commence Timeframe ACTIONS/PLANS
1.4 Investigate appropriate instrument Increase in surface Land Strategic Asset Staff time Report on steps taken 2022/23 Medium 10 + years
(policy or other) to enable temperature Development Management Material to identify and
minimisation of exposed hard costs and developed a suitable
surfaces to direct sunlight throughout contractor instrument/policy.
the City, reducing thermal banking costs
and the Urban Heat Island effect.
24The timeframe relating to how long it is expected for an action to be completed following commencement will be set as SHORT, MEDIUM and LONG term and defined as:
SHORT 1 - 2 years
MEDIUM 3 - 5 years
LONG over 5 years
2. RAINFALL RELATED RISKS
20% reduction in rainfall since 1960s with further 18% reduction by 2090
Reduced water availability for public open space irrigation affecting the community and lifestyle, increase in costs to deliver services, reduced water availability for natural
wetlands affecting the natural environment and reduced water availability for agricultural crops affecting local agribusiness and increasing cost of living.
ACTIONS RISK RELATED LEAD SERVICE COLLABORATING RESOURCES MEASURABILITY ACTION DURATION IMPLEMENTATION
IMPACTS UNIT SERVICE UNIT OF SUBSEQUENT
Commence Timeframe ACTIONS/PLANS
2.1. Analyse City's current policies and laws Reduced water Land Staff time Analysis of 2021/22 Medium 10 + years
relating to standards and specifications on availability for Development policies and laws
the amount and type of permeable surfaces park areas complete.
including permissible and non-permissible Relevant
verge treatments, and amend existing or policies/laws
introduce new policies to ensure rainwater amended or new
infiltration is maximised and water retained policies adopted.
and delivered to the root zones of trees and
plants on verges and in front yards (relates
to action 1.4).
2.2 Continue to review water use for Reduced water Parks & Land Staff time Annual reduction 2021/22 Long Ongoing
irrigation incorporating best industry practice availability for Conservation Development Material costs in scheme and
and reflect changes in the City’s Irrigation irrigation Management and potential groundwater use
Specification and irrigation management purposes contractor costs per hectare for
practices. irrigation use with
details provided
to Waterwise
Council Program.
2.3 Develop a five-year prioritised plan of Increasing costs Strategic Asset Building Staff time Five year 2021/22 Short N/A
action to address high water use sites on an to deliver Management Maintenance prioritised plan of
annual basis, based on continued services action complete.
assessment of water use across all City
owned buildings.
25ACTIONS RISK RELATED LEAD SERVICE COLLABORATING RESOURCES MEASURABILITY ACTION DURATION IMPLEMENTATION
IMPACTS UNIT SERVICE UNIT OF SUBSEQUENT
Commence Timeframe ACTIONS/PLANS
2.3.1 Implement the five year prioritised plan Strategic Asset Building Staff time Actions 2022/23 Long 5 + years
of action. Management Maintenance Consultant implemented as
Costs per the plan and
Material costs informing the
and potential Waterwise
contractor costs Council Program.
2.4 Advocate to State Government as well Increasing cost Strategic Land Advocacy & Staff Time Responded to 2021/22 Long Ongoing
as developers to adopt innovative to deliver Use Planning & Economic invitations to
approaches to water reuse and recycling, services Environment Development; comment/
where viable, reducing dependency and Land participate in
need for both scheme and groundwater - in Development. development of
response to the impacts of declining rainfall. water
management
reports.
2.5 Investigate opportunities to reduce City's Reduced water Parks & Staff time Annual reduction 2020/21 Medium Ongoing
use of scheme and groundwater for availability for Conservation in scheme and
irrigation. irrigation Management groundwater use
purposes per hectare for
irrigation use with
details provided
to Waterwise
Council Program.
2.6 Advocate to the Department of Water Reduced water Strategic Land Advocacy & Staff time Establish an 2021/22 Long 10 + years
and Environmental Regulation to further availability for Use Planning & Economic ongoing
develop and implement effective integration irrigation and Environment Development consultative
of land use and water management planning ecological program with
for the Gnangara groundwater system, to services DWER and report
achieve a sustainable management and use on progress
of the groundwater system. (As per the made as a result
intention of the initial Gnangara of an
Sustainability Strategy). annual/biannual
working sessions.
26You can also read