Projected changes in drought occurrence under future global warming from multi-model, multi-scenario, IPCC AR4 simulations

Page created by Jimmy Wells
 
CONTINUE READING
Projected changes in drought occurrence under future global warming from multi-model, multi-scenario, IPCC AR4 simulations
Clim Dyn
DOI 10.1007/s00382-007-0340-z

Projected changes in drought occurrence under future global
warming from multi-model, multi-scenario, IPCC AR4
simulations
Justin Sheffield Æ Eric F. Wood

Received: 24 July 2007 / Accepted: 5 November 2007
Ó Springer-Verlag 2007

Abstract Recent and potential future increases in global       precipitation with increased evaporation from higher tem-
temperatures are likely to be associated with impacts on the   peratures modulating the changes. In some regions,
hydrologic cycle, including changes to precipitation and       increases in precipitation are offset by increased evapora-
increases in extreme events such as droughts. We analyze       tion. Although the predicted future changes in drought
changes in drought occurrence using soil moisture data for     occurrence are essentially monotonic increasing globally
the SRES B1, A1B and A2 future climate scenarios relative      and in many regions, they are generally not statistically
to the PICNTRL pre-industrial control and 20C3M twen-          different from contemporary climate (as estimated from the
tieth century simulations from eight AOGCMs that               1961–1990 period of the 20C3M simulations) or natural
participated in the IPCC AR4. Comparison with observa-         variability (as estimated from the PICNTRL simulations)
tion forced land surface model estimates indicates that the    for multiple decades, in contrast to primary climate vari-
models do reasonably well at replicating our best estimates    ables, such as global mean surface air temperature and
of twentieth century, large scale drought occurrence,          precipitation. On the other hand, changes in annual and
although the frequency of long-term (more than 12-month        seasonal means of terrestrial hydrologic variables, such as
duration) droughts are over-estimated. Under the future        evaporation and soil moisture, are essentially undetectable
projections, the models show decreases in soil moisture        within the twenty-first century. Changes in the extremes of
globally for all scenarios with a corresponding doubling of    climate and their hydrological impacts may therefore be
the spatial extent of severe soil moisture deficits and fre-   more detectable than changes in their means.
quency of short-term (4–6-month duration) droughts from
the mid-twentieth century to the end of the twenty-first.
Long-term droughts become three times more common.
Regionally, the Mediterranean, west African, central Asian     1 Introduction
and central American regions show large increases most
notably for long-term frequencies as do mid-latitude North     The climate varies naturally in response to external forcings,
American regions but with larger variation between sce-        such as solar radiation (Christensen and Lassen 1991) and
narios. In general, changes under the higher emission          atmospheric aerosols (Robock and Mao 1995), and because
scenarios, A1B and A2 are the greatest, and despite fol-       of internal interactions between components of the climate
lowing a reduced emissions pathway relative to the present     system (Trenberth and Hurrell 1994). The extremes of these
day, the B1 scenario shows smaller but still substantial       variations have consequences on the terrestrial water cycle
increases in drought, globally and for most regions.           that impact human activities in terms of changes to the
Increases in drought are driven primarily by reductions in     availability or absence of water, e.g., flooding or drought
                                                               (Higgins et al. 2000; Dai et al. 1998). When coupled with
                                                               potential climate change, which may impact regionally and
J. Sheffield (&)  E. F. Wood
                                                               exaggerate the influence of natural variability, the extremes
Department of Civil and Environmental Engineering,
Princeton University, Princeton, NJ 08544, USA                 of climate may become more pronounced (Easterling et al.
e-mail: justin@princeton.edu                                   2000; Palmer and Räisänen 2002). To design and implement

                                                                                                                  123
J. Sheffield, E. F. Wood: Projected changes in drought occurrence under future global warming

strategies to minimize climate change or mitigate against the      by positive feedbacks, such as increases in the frequency of
detrimental impacts (Hasselmann et al. 2003), it is essential      heat waves (Seneviratne et al. 2006a, b) and decreased
to be able to detect whether climate change is actually            carbon uptake by vegetation (Ciais et al. 2005).
occurring and to what extent. This is problematic because the         Several studies using climate models have suggested
climate change signal may be small relative to the natural         that the interior of the northern hemisphere continents will
variability of the climate system (Hulme et al. 1999) and may      become drier over the next century, especially in the
thus be undetectable, at least over the short term. The pos-       summer (Rind et al 1990; Gregory et al. 1997; Wetherald
sibility then arises that by the time the signal becomes           and Manabe 1995, 1999, 2002). Gregory et al. (1997)
detectable, adverse impacts may have already occurred and it       analyzed summer drought over southern Europe and cen-
may be too late to reverse the change or even adapt to it          tral North America in terms of precipitation and soil
(Pittock 1999; King 2004).                                         moisture from a single integration of the Hadley climate
   Climate change is often measured by changes in primary          model forced by 1% year-1 increasing CO2 concentrations.
climate variables such as global surface air temperature and       They found increases in multivariate drought statistics that
precipitation. These variables are first order drivers of          were driven primarily by evaporation through increased
climate impacts, inducing changes in weather extremes, sea         temperatures but also decreased precipitation in the form of
ice thinning and glacier retreat, and thus are appropriate for     fewer events. Wetherald and Manabe (1999) analyzed soil
studying the broader issues in climate change. They are            moisture from the GFDL climate model for three scenarios:
also the best-observed variables over large scales with            increasing greenhouse gases, increasing sulphate–aerosol
relatively long historical records. Recent changes in cli-         and combination of both. They similarly found summer
mate may be large enough to be detectable now, although            dryness and winter wetness in North America and southern
this will depend on the climate variable and our level of          Europe as well as other semi-arid regions, although high
confidence in detecting change (Hegerl et al. 2006).               latitudes showed increasing wetness. Based on a threshold
Analysis of the instrumental record indicates that recent          of one standard deviation, changes in soil moisture did not
increases in global annual temperature are anomalous and           become detectable for several decades. In summarizing
more rapid compared to the long-term record (e.g., Jones           such studies, the third Intergovernmental Panel on Climate
et al. 1999; Hansen et al. 1999; Brohan et al. 2006) and           Change (IPCC) report (IPCC 2001) concluded that
model results suggest that this cannot be due to natural           increased drought risk over these regions was ‘‘likely’’.
variability alone (Jansen et al. 2007). However, changes in           More recently, Giorgi (2006) analyzed a set of IPCC 4th
global variables may bear little relation to regional chan-        Assessment Report (AR4) simulations and calculated a
ges, especially for precipitation (Giorgi and Bi 2005) and         climate change index based on changes in precipitation and
thus changes in, for example, droughts and floods that may         temperatures means and variability. He found major cli-
have serious impacts on human and environmental welfare.           mate change ‘‘hot-spots’’ in the Mediterranean and
   The potential acceleration of the hydrologic cycle under        Northern Europe, followed by high northern latitudes and
recent and future global warming is of considerable interest       Central America. Other hot-spots occur in Southern
(Huntington 2006), especially in terms of changes in               Equatorial Africa, the Sahara and eastern North America.
regional variability and extremes. Of all natural disasters,       Wang (2005) analyzed a large set of IPCC AR4 models in
the economic and environmental consequences of drought             terms of consensus changes in precipitation, temperature
are among the highest, due primarily to the longevity and          and soil moisture and found inter-model consistency in
widespread spatial extent of many droughts (Wilhite 2000).         some regions of northern mid- and high-latitudes in pre-
Thus the potential impacts of climate change on drought            dicting summer dryness and winter wetness. In terms of
are most pertinent. As temperatures rise, the capacity of the      drought, Burke et al. (2006) calculated the Palmer Drought
atmosphere to hold moisture would increase as governed             Severity Index (PDSI), a commonly used drought index,
by the Clausius–Clapeyron equation (Held and Soden                 from the latest version for the Hadley centre climate model
2000), with potential for increased evaporation and/or             for the SRES A2 scenario and found regionally strong
precipitation (Trenberth 1999), although these may be              wetting and drying, but a net global drying trend resulting
limited by other factors such as available energy and aer-         in an increase in the area of extreme drought from 1 to 30%
osol concentration. Climate model studies have shown that          by end of this century. The conclusion of the latest IPCC
variability is likely to increase under plausible future cli-      report (IPCC 2007, Chap. 10, p. 783) was that ‘‘In a war-
mate scenarios (Wetherald and Manabe 2002), dependent              mer future climate, most Atmosphere–Ocean General
upon climate sensitivity, with large regional changes in the       Circulation Models project increased summer dryness and
water cycle. The potential for more droughts and of greater        winter wetness in most parts of the northern middle and
severity is a worrisome possibility (Gregory et al. 1997;          high latitudes. Summer dryness indicates a greater risk of
Wetherald and Manabe 1999; Wang 2005), compounded                  drought.’’

123
J. Sheffield, E. F. Wood: Projected changes in drought occurrence under future global warming

   The consensus from these and other studies into the                 as well as the diversity of possible emission pathways as
hydrologic impacts of future warming and the synthesis                 represented by the different scenarios. Nevertheless,
conclusions of the past two IPCC reports point towards a               uncertainties are inherent in this study, such as biases
greater risk of drought during the twenty-first century. In            induced by the specific models and approaches we take and
this paper we investigate how drought is expected to change            we highlight these where relevant.
in the future by analyzing soil moisture and drought char-                The paper is laid out as follows. After presenting the
acteristics over global land areas, excluding Antarctica,              datasets and methods we briefly evaluate how well the
from a suite of climate model simulations carried out under            models represent drought during the twentieth century
the auspices of the IPCC AR4. We quantify the change in                against off-line estimates. This is critical to our confidence in
global and regional drought occurrence relative to both the            the models to project future changes. We then show how
present day and the pre-industrial era, as represented by              drought is expected to change over the twenty-first century
twentieth century and pre-industrial control simulations,              for the three future climate scenarios, globally and region-
respectively. We take into account the uncertainty in                  ally, and where these changes are statistically significant
regional climate change by using data from multiple climate            relative to contemporary climate variability as derived from
models and for three future climate scenarios that represent           twentieth century simulations. Mechanisms for the expected
a range of plausible emission pathways.                                changes are presented next, that show how changes in
   Although global warming is expected to accelerate the               evaporation, as forced by increasing temperatures, modify
hydrologic cycle and thus the occurrence and severity of               the primary impacts of precipitation changes and how this
drought, the changes may not become detectable for several             can be altered by changes in snow at higher latitudes. In Sect.
decades (Wetherald and Manabe 1999). The detectability of              4 we investigate the detectability of these changes and how
climate change can be quantified by how long we have to                this depends on the time period, drought characteristic, level
monitor for to detect significant changes against the back-            of significance and background variability against which the
ground of natural variability, which is basically a signal to          change is quantified. This section also looks at how drought
noise problem (McCabe and Wolock 1997; Zheng and                       detectability compares to that for other hydro-climatic
Basher 1999; Ziegler et al. 2003). The greater the variability,        variables and whether we are likely to detect changes in
the harder it is to detect a signal. We use this concept to            extremes, such as drought, earlier than changes in the mean
evaluate the detectability of potential future changes by              of primary climate variables, such as annual precipitation.
applying statistical analyzes to time series of drought
occurrence to determine when and where changes will
become detectable. Detectability is a function of the natural          2 Datasets and methods
variability of the system, the magnitude of the change we are
interested in and the level of risk we are prepared to accept in       2.1 Climate model simulations
statistical testing, among others factors, and we carry out a
set of sensitivity experiments to evaluate their impact.               To estimate potential future climate change we use data
   This study is the first that we are aware of that analyzes          from the IPCC AR4 General Circulation Model (GCM)
potential changes in drought under future global warming,              simulations. The range of future climates predicted by
as characterized by persistence in severe soil moisture                GCMs is large and regionally dependent (NRC 2003;
deficits, from multiple models and scenarios. Previous                 Giorgi and Bi 2005) and we therefore use data from mul-
studies have assessed predicted changes in mean climate                tiple GCMs and three scenarios: the Special Report on
and specifically soil moisture (Wetherald and Manabe                   Emissions Scenarios (SRES) A2, A1B and B1
2002; Wang 2005) that will likely (but not necessarily)                (Nakićenović et al. 2000). Each scenario represents dif-
induce changes in drought. Here, we take into consider-                ferent mixes of changes in population, economic output,
ation changes in the full distribution of pertinent variables          land use, and energy and technology use, among others, but
and not just the mean or some other tendency measure.                  can be generally characterized by maximum atmospheric
Furthermore, we analyze actual model output as opposed to              CO2 concentrations. B1 represents relatively slow popula-
derived products such as the PDSI that may suffer from                 tion growth and an emphasis on environmental protection,
inadequacies, which will enhance uncertainty in the results.           with CO2 concentrations stabilized at 550 ppm by the end
In terms of models and scenarios analyzed, previous                    of the century. A1B describes a future of very rapid eco-
studies have focused on single models and/or single sce-               nomic growth, global population that peaks in mid-century
narios (e.g., Wetherald and Manabe 2002; Wang 2005;                    and declines thereafter, and the rapid introduction of new
Burke et al. 2006). To instil confidence in the robustness of          and more efficient technologies with a balance between
assessment of future change, it must take into account the             fossil and non-fossil energy sources and is characterized by
uncertainty in future climates because of model differences            maximum concentrations of 720 ppm. A2 describes a

                                                                                                                             123
J. Sheffield, E. F. Wood: Projected changes in drought occurrence under future global warming

Table 1 Models used in this
                                  Model name                       Modeling group                                               Country
study, which have monthly soil
moisture data available for the   CGCM3.1(T47)                     Canadian Centre for Climate Modelling &                      Canada
PICNTRL, 20C3M and SRES                                              Analysis
B1, A1B and A2 scenarios
                                  GFDL-CM2.1                       US Department of Commerce/NOAA /                             USA
                                                                     Geophysical Fluid Dynamics Laboratory
                                  GISS-ER                          NASA/Goddard Institute for Space Studies                     USA
                                  INM-CM3.0                        Institute for Numerical Mathematics                          Russia
                                  IPSL-CM4                         Institut Pierre Simon Laplace                                France
                                  MIROC3.2(medres)                 Center for Climate System Research (The                      Japan
                                                                     University of Tokyo), National Institute for
                                                                     Environmental Studies, and Frontier Research
                                                                     Center for Global Change (JAMSTEC)
                                  MRI-CGCM2.3.2                    Meteorological Research Institute                            Japan
                                  ECHAM5/MPI-OM                    Max Planck Institute for Meteorology                         Germany

heterogeneous world with continuously increasing global               length D with soil moisture quantile values, q(h), less than
population and regionally orientated economic develop-                a chosen threshold, q0(h). Here we use a value of 10%,
ment and fragmented technological change and is generally             which reflects conditions that occur only once every
regarded as a worst-case scenario that sees a four to five-           10 years for a particular month on average and so reflects
fold increase in CO2 emissions over 2000–2099 during                  rare events, and has been shown to be applicable to iden-
which CO2 concentrations increase from about 350 to                   tifying historic events at global scales (Sheffield and Wood
850 ppm. We also use data from the corresponding pre-                 2007). We are particularly interested in how individual dry
industrial control (PICNTRL) and twentieth century sim-               months are organized into sequences of consecutive dry
ulations (20C3M), which were also run in coupled mode,                months that can then be considered a drought with asso-
i.e., with a free-running ocean component. The 20C3M                  ciated deleterious impacts. Drought can be characterized in
simulations are driven by prescribed historical greenhouse            various ways and we define a number of statistics based on
gas concentrations, sulphate-aerosol loadings and other               duration (D), intensity (I), severity (S) and areal extent (A)
forcings since the start of the industrial revolution. We use         that are also dependent on q0 (h):
data for eight models (Table 1) which were selected as                        X
                                                                           1 tþD1
those which had soil moisture and ancillary data available            I¼           q0 ðhÞ  qðhÞt                                     ð1Þ
for all these scenarios. Where ensemble simulations for a                  D t¼t1
particular scenario were available we use the first ensemble          S¼ID                                                           ð2Þ
member but it should be noted that single simulations were
available more often than not.                                        Intensity is the mean magnitude over the duration of the
                                                                      drought and severity is the time integrated deficit below the
                                                                      threshold, with units of (% months). For example, a
2.2 Drought estimation                                                drought that lasted for 10 months and had a mean deficit
                                                                      below the threshold (intensity) of 7% would have a severity
We define drought occurrence as an extended period of                 of 70% months. We also define three classes of drought
anomalously low soil moisture. The amount of water in the             depending on their duration: short-term (4–6 months),
soil provides a useful indicator of drought as it reflects the        medium term (7–12 months), and long-term (longer than
aggregate effect of all hydrologic processes from changes             12 months), although we only show results for short- and
in short-term precipitation events and temperature swings             long-term droughts.
to long-term changes in climate, and can represent the
status of agriculture and potential hydrologic recharge to            D46 ; short-term:    4  D  6;      qðhÞ\ ¼ q0 ðhÞ            ð3Þ
rivers and reservoirs (Sheffield et al. 2004). Empirical              D712 , medium-term: 7  D  12;          qðhÞ\ ¼ q0 ðhÞ        ð4Þ
probability distributions are derived for the modelled soil
                                                                      D12þ ; long-term:     D [ 12;       qðhÞ\ ¼ q0 ðhÞ              ð5Þ
moisture fields for each month from the pre-industrial
control simulations and the current state of drought is               The spatial extent of drought, A, is defined as follows:
characterized by the quantile of the current soil moisture                PN
value in relation to the control period distribution. A                         AðiÞ ¼ fqðhÞ\ ¼ q0 ðhÞg
                                                                      A ¼ i¼1         PN                                       ð6Þ
drought is defined as a consecutive sequence of months of                               i¼1 AðiÞ

123
J. Sheffield, E. F. Wood: Projected changes in drought occurrence under future global warming

where A(i) is the area of grid cell i weighted by the cosine           complete period of each simulation from the IPCC data-
of the grid cell latitude and N is the total number of grid            base. Monthly values of soil moisture for each model are
cells in the region of interest.                                       available as depths of water and are normalized to volu-
                                                                       metric values by dividing by the field capacity, which is
                                                                       given for each model as a fixed field. This ensures that the
                                                                       soil moisture data for each model are analyzed with respect
2.3 Statistical methods
                                                                       to their dynamic range as governed by soil characteristics
                                                                       and meteorological conditions, and are thus inter-compa-
Changes in the occurrence of drought are calculated
                                                                       rable. The volumetric data are then interpolated from each
between the PICNTRL and 20C3M and future climate
                                                                       model’s native grid to a 2.0-deg regular grid, which is a
simulations, although we focus mainly on changes relative
                                                                       representative scale across the set of models. Ancillary
to the 20C3M data. The pre-industrial PICNTRL simula-
                                                                       variables (e.g., precipitation) that are used in subsequent
tions are used to represent natural variability; the 20C3M
                                                                       analysis of drought forcing are interpolated in the same
simulations are used to represent present day drought
                                                                       manner.
conditions under contemporary climate. Changes are esti-
mated for the ensemble of climate models to take into
account the uncertainty due to model differences. We also
                                                                       3 Results
investigate changes for a single model in Sect. 4.5 using
multiple ensemble members from the same model, where
                                                                       First, we evaluate the representation of drought in the cli-
uncertainty in the representation of climate is based on
                                                                       mate models by considering (1) the natural occurrence of
intra-ensemble differences rather than inter-model differ-
                                                                       drought as derived from the control simulations and (2)
ences. In both cases, for each model or ensemble member,
                                                                       drought under contemporary climate from the twentieth
we calculated the frequency of drought and other statistics
                                                                       century simulations. In Sect. 3.2 we compare the twentieth
in 30-year periods. For the 20C3M simulation this was
                                                                       century results with observation-based data to determine
done for the period 1961–1990, assuming this to be rep-
                                                                       whether the models are capable of reproducing our best
resentative of contemporary climate. For the future climate
                                                                       estimates of large-scale contemporary drought occurrence.
simulations we calculated statistics over a 30-year moving
                                                                       Sections 3.3–3.5 present the projected future changes in
window. For the PICNTRL simulation, statistics were
                                                                       drought, their statistical significance relative to contem-
calculated for each non-overlapping, consecutive 30-year
                                                                       porary climate (as estimated from 1961 to 1990 of the
period. To account for the differences in the PICNTRL
                                                                       20C3M data) and natural variability (as estimated from the
simulation length among models, which would bias the
                                                                       PICNTRL data), and the driving mechanisms of change.
results of the multi-model assessment towards a model
with a longer simulation, we simply averaged the values in
each 30-year period over the whole simulation for each
                                                                       3.1 Natural variability of drought from GCM control
model.
                                                                           simulations
   Changes in drought are identified by testing the null
hypothesis that the distribution of a drought statistic across
                                                                       Figure 1 shows the global distribution of drought statistics
all models has the same mean as the distribution across all
                                                                       in terms of the multi-model ensemble mean. The statistics
models during a future time period. Student’s t test statistic,
                                                                       are the frequency of D4–6 and D12+ droughts, the mean
which is a measure of the ratio of the difference in means to
                                                                       drought duration, Dmean, and the mean drought severity,
the combined variance of the two distributions, is calculated
                                                                       Smean. For each model, the drought statistics are calculated
at each grid cell and the null hypothesis is rejected for t-test
                                                                       over 30-year blocks within the control period and then the
values greater than the critical value at confidence level a
                                                                       mean is calculated over all blocks. The maps in Fig. 1
(usually taken as 0.05 or 95%). In this case we conclude that
                                                                       show the multi-model mean and standard deviation (inter-
a statistically significant change has occurred. Application
                                                                       model variability) of the individual model means.
of the test assumes that the means of the two samples do not
                                                                          For D4–6 droughts, the highest frequencies are located in
deviate substantially from a normal distribution.
                                                                       mid-latitudes and the Tropics, with peak values of about
                                                                       1–2 droughts per 30 years in the Pacific northwest and
                                                                       eastern United States, central Europe and Asia, China and
2.4 Data preparation                                                   central Africa. Low frequencies (\0.5 droughts 30 year-1)
                                                                       occur in arid regions where soil moisture is persistently low
We focus on monthly values for all calculations, which is              and does not change much from year to year, and in high
the smallest time scale for which data are available for the           latitudes where freezing temperatures and snow cover

                                                                                                                         123
J. Sheffield, E. F. Wood: Projected changes in drought occurrence under future global warming

Fig. 1 Multimodel ensemble drought statistics for the pre-industrial   drought severity (% months). The statistics are calculated for 30-year
control (PICNTRL) simulation. The statistics are number of 4–6-        periods within the each models control period and then averaged all
month duration droughts (30 yearr-1), number of 12+-month duration     30 year periods. The multimodel ensemble mean and standard
droughts (30 year-1), mean drought duration (months) and mean          deviation are shown on the left and right hand side, respectively

123
J. Sheffield, E. F. Wood: Projected changes in drought occurrence under future global warming

prolong soil moisture anomalies (Wang 2005; Sheffield and                                     4

                                                                       month droughts
                                                                                                                  20C3M multi-model ensemble

                                                                       Number of 4-6
Wood 2007). The standard deviation or inter-model vari-                                       3                   VIC off-line

ability is largest in regions of high seasonality, such as the                                2
edges of the footprint of the Inter Tropical Convergence                                      1
Zone (ITCZ) in Africa and lowest in dry regions and high
                                                                                              0
latitudes.

                                                                                                   world
                                                                                                    neu
                                                                                                           med
                                                                                                           waf
                                                                                                            eaf
                                                                                                            saf
                                                                                                           nas
                                                                                                           cas
                                                                                                                   tib
                                                                                                                  eas
                                                                                                                  sas
                                                                                                                  sea
                                                                                                                  aus
                                                                                                                                   ala
                                                                                                                                  nec
                                                                                                                                 wna
                                                                                                                                  cna
                                                                                                                                 ena
                                                                                                                                 cam
                                                                                                                                 amz
                                                                                                                                  ssa
   The distribution of D12+ frequencies is generally the
opposite of that for short-term droughts, with maxima in                                      1

                                                                       month droughts
                                                                       Number of 12+
central and northern North America, eastern south Amer-                                      0.8

ica, Siberia, and eastern Asia among others. High values                                     0.6
                                                                                             0.4
are also prevalent in dry regions although as the range in
                                                                                             0.2
soil moisture is so small, the absolute magnitude of drought
                                                                                              0
is also very small. Minima are mostly located in regions

                                                                                                   world
                                                                                                    neu
                                                                                                           med
                                                                                                           waf
                                                                                                            eaf
                                                                                                            saf
                                                                                                           nas
                                                                                                           cas
                                                                                                                   tib
                                                                                                                  eas
                                                                                                                  sas
                                                                                                                  sea
                                                                                                                  aus
                                                                                                                                   ala
                                                                                                                                  nec
                                                                                                                                 wna
                                                                                                                                  cna
                                                                                                                                 ena
                                                                                                                                 cam
                                                                                                                                 amz
                                                                                                                                  ssa
with more seasonally uniform climates such as central
tropical Africa, parts of southeast Asia and the eastern and                                 10

                                                                       duration (months)
                                                                         Mean drought
Pacific northwest coasts of North America. The standard                                       8
                                                                                              6
deviation values are also at a maximum in high latitudes
                                                                                              4
and globally are relatively high compared with the mean,
                                                                                              2
possibly indicating a lack of consensus across models in
                                                                                              0
how drought varies on longer time scales. Mean drought

                                                                                                   world
                                                                                                    neu
                                                                                                           med
                                                                                                           waf
                                                                                                            eaf
                                                                                                            saf
                                                                                                           nas
                                                                                                           cas
                                                                                                                   tib
                                                                                                                  eas
                                                                                                                  sas
                                                                                                                  sea
                                                                                                                  aus
                                                                                                                                   ala
                                                                                                                                  nec
                                                                                                                                 wna
                                                                                                                                  cna
                                                                                                                                 ena
                                                                                                                                 cam
                                                                                                                                 amz
                                                                                                                                  ssa
duration and severity are similarly distributed being that
severity is dominated by drought duration at low threshold             severity (% months)   40
                                                                         Mean drought

values. Mean drought duration is at a maximum in high                                        30
latitudes, central North America, Brazil, southern Africa                                    20
and Australia.                                                                               10

                                                                                              0
                                                                                                   world
                                                                                                    neu
                                                                                                           med
                                                                                                           waf
                                                                                                            eaf
                                                                                                            saf
                                                                                                           nas
                                                                                                           cas
                                                                                                                   tib
                                                                                                                  eas
                                                                                                                  sas
                                                                                                                  sea
                                                                                                                  aus
                                                                                                                                   ala
                                                                                                                                  nec
                                                                                                                                 wna
                                                                                                                                  cna
                                                                                                                                 ena
                                                                                                                                 cam
                                                                                                                                 amz
                                                                                                                                  ssa
3.2 Twentieth century drought and comparison with
    off-line modeling                                                  Fig. 2 Regionally averaged D4–6 and D12+ frequencies, Dmean and
                                                                       Smean for 1961–1990 from the twentieth century (20C3M) simulations
Comparison of soil moisture data from the IPCC AR4                     (box and whispers) and an observation forced land surface model
20C3M simulations with field measurements have been                    simulation (black dots). The box and whispers represent the inter-
                                                                       quartile range and the range (maximum and minimum values) of the
carried out by Li et al. (2007) over small regions in the              set of GCMs
Northern Hemisphere based on the database of Robock
et al. (2000). They found that the models simulated the                meteorological dataset (Sheffield et al. 2006). Because of
seasonal cycles for Ukraine, Russia, and Illinois ade-                 the lack of large scale, long-term monitoring of soil
quately, but were generally poor for Mongolia and China.               moisture, observation forced off-line modeling provides
Importantly, all models failed to replicate observed sum-              the best possible estimate of historic soil moisture values
mer drying in Russia and the Ukraine during the latter part            at continental to global scales (Maurer et al. 2002; Shef-
of the twentieth century. Here we are interested in the                field et al. 2006, Guo and Dirmeyer 2006).
large-scale, long-term statistics of drought as characterized             The climate model values in Fig. 2 generally encapsu-
by persistent soil moisture deficits. A comparison of glo-             late observation-based values, although the spread among
bal and regional averaged drought characteristics from the             models and the occurrence of outliers can be large
20C3M simulations with observation-based estimates is                  depending on the region and statistic (e.g., CAM for D4–6,
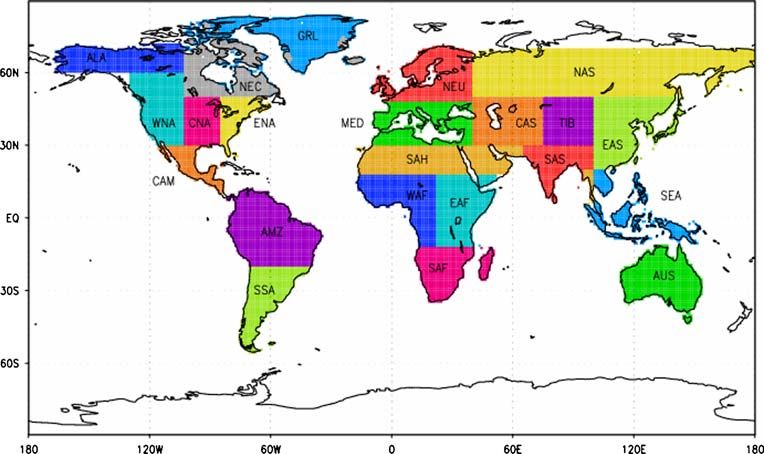
shown in Fig. 2. The regions are shown in Fig. 3 and are               SAF for D12+, AUS for Dmean). For Dmean and Smean, the
defined by Giorgi and Francisco (2000) with the inclusion              agreement is reasonably good and the observation-based
of the northeast Canada region (NEC) in place of the                   values fall within the maximum and minimum range for
Canadian-Greenland (GRL) region. We also define the                    nearly all regions and generally lie within the inter-quartile
WORLD region as continental land areas excluding                       range of the model distribution. This is consistent with
Greenland and Antarctica. The observation-based statistics             Seneviratne et al. (2006a, b) who, as part of the Global
are derived from off-line simulations using the Variable               Land Atmosphere Coupling Experiment (GLACE), showed
Infiltration Capacity (VIC) land surface model (Sheffield              that AGCMS were capable of distinguishing between
and Wood 2007), forced by an observation-based                         observed regions of high and low soil moisture memory on

                                                                                                                                               123
J. Sheffield, E. F. Wood: Projected changes in drought occurrence under future global warming

Fig. 3 Map of regions used in the analysis as defined by Giorgi and Francisco (2000). The original GRL region is split into northeastern Canada
(NEC) and Greenland for this study

monthly time scales. For the most part, the climate model                PICNTRL and 20C3M scenarios. The frequency of D4–6
values tend to be higher, most notably for D12+ frequencies,             droughts also doubles and D12+ droughts become two and
Dmean and Smean, although for the former this is a result, in            three times more frequent relative to the PICNTRL and
part, of the zero lower bound in most regions. The general               20C3M scenarios, respectively. The spread in model
overestimation by the models of long-term drought fre-                   projections as quantified by the inter-quartile range (IQR)
quencies and mean drought duration points to an                          is, however, fairly large, even at the beginning of the
underestimation of climate variability that has been noted               twenty-first century (also noted previously in the twenti-
previously (e.g., Collins et al. 2002; Hunt 2006).                       eth century comparisons in Sect. 3.2) and this increases
                                                                         by the end of the century, such that the lower bound on
                                                                         projections shows little change over the century, although
3.3 Global and regional drought under future climate                     these are invariably increases.
    scenarios                                                               Figures 5, 6 and 7 show the multi-model mean,
                                                                         regionally averaged time series of D4–6 and D12+ frequen-
Next we investigate how soil moisture and drought are                    cies and A. Similar to the global results, most regions show
predicted to change under future climates. Global aver-                  increases in drought statistics, but with large variation
aged time series of monthly mean soil moisture and                       between regions and across scenarios. In particular, the
drought characteristics for the three future climate sce-                MED, WAF, CAS and CAM regions show large increases,
narios are shown in Fig. 4. For these models, the future                 most notably for D12+ frequencies. The mid-latitude North
climate simulations were initialized from the end of the                 American regions (WNA, CNA, ENA) also show increases
20C3M simulation and we prepend these data (in terms of                  but with larger variation between scenarios. Changes over
the multi-model distribution) to the future scenario time                high latitudes (ALA, NEC, NEU, NAS), eastern mid-
series. Globally, soil moisture decreases under all sce-                 latitude Asia (EAS, TIB) and regions bordering the Indian
narios, with corresponding increases in drought spatial                  Ocean (EAF, SAS, SEA) are relatively small. The fre-
extent. Note that the spatial extent of drought may not be               quency of D12+ droughts actually decreases in NEU. Again,
contiguous which is more likely for larger regions. Cor-                 changes under the B1 scenario are the least and the A1B
responding changes in drought statistics (frequency of D4–               and A2 results are similar.
6 and D12+ droughts and Smean) are all increasing. In
general, the increases in drought statistics are greatest
under the higher emissions scenario, A2, and least under                 3.4 Statistical significance of changes
the lower emissions scenario, B1 (Table 2). The global
spatial extent of drought across all models roughly dou-                 We next evaluated the statistical significance of changes in
bles by 2070–2099 under all scenarios relative to the                    drought by the end of the twenty-first century with respect

123
J. Sheffield, E. F. Wood: Projected changes in drought occurrence under future global warming

Fig. 4 Global average time                                                    SRESB1                                 SRESA1B                                  SRESA2
series of soil moisture and

                                     Vol. soil moisture (%)
                                                              80                                         80                                    80
various drought statistics for the                            70                                         70                                    70
twenty-first century for the                                  60                                         60                                    60
SRESB1, SRESA1B and
                                                              50                                         50                                    50
SRESA2 scenarios. Monthly
soil moisture and drought extent                              40                                         40                                    40
(q0(h) = 10.0%) is shown as the                               30                                         30                                    30
121-month running mean. The                                   20                                      20                                       20
frequency of 4–6 month                                          1900       1950   2000   2050    2100   1900       1950   2000   2050   2100     1900   1950   2000   2050   2100
duration droughts                                             40                                         40                                    40

                                     Drought extent (%)
(q0(h) = 10.0%), 12+-month
duration droughts                                             30                                         30                                    30
(q0(h) = 50.0%) and the
maximum severity (defined as                                  20                                         20                                    20
the drought intensity times the
drought duration) are calculated                              10                                         10                                    10
over a 30-year moving window.
                                                               0                                           0                                    0
The data are shown as the 0, 25,
                                                                1900       1950   2000   2050    2100       1900   1950   2000   2050   2100     1900   1950   2000   2050   2100
50, 75 and 100% percentiles of
                                     Num. 4-6mo droughts

                                                               4                                           6                                    6
the distribution of the
multimodel ensemble of soil                                                                                5                                    5
                                                               3
moisture and drought statistics                                                                            4                                    4
                                                               2                                           3                                    3
                                                                                                           2                                    2
                                                               1
                                                                                                           1                                    1
                                                               0                                           0                                    0
                                                                    1900   1950   2000   2050    2100       1900   1950   2000   2050   2100     1900   1950   2000   2050   2100
                                     Num. 12+mo droughts

                                                              1.5                                        1.5                                   1.5

                                                               1                                           1                                    1

                                                              0.5                                        0.5                                   0.5

                                                               0                                           0                                    0
                                                                1900       1950   2000   2050    2100       1900   1950   2000   2050   2100     1900   1950   2000   2050   2100
                                     Mean severity (% mo)

                                                              80                                         80                                    80

                                                              60                                         60                                    60

                                                              40                                         40                                    40

                                                              20                                         20                                    20

                                                               0                                           0                                    0
                                                                1900       1950   2000   2050    2100       1900   1950   2000   2050   2100     1900   1950   2000   2050   2100

                                                                                                0 - 100%                   25 - 75%                     50%

to the twentieth century as represented by the 1961–1990                                                decreases is mostly restricted to high latitudes and generally
period of the model 20C3M simulation (Figs. 8, 9). In                                                   results in zero frequencies. Increases in the southern US,
general, D4–6 drought frequency increases globally between                                              Central America, the Mediterranean and southern Africa,
the twentieth century and the future period (Fig. 8). Large                                             are of the order of 2 droughts 30 year-1. The spatial dis-
areas experience greater than 5 short-term droughts per                                                 tribution of changes is fairly robust across scenarios, but
30 years (averaged over all models) that are statistically                                              with magnitudes greatest under the A2 scenario, and lowest
significant at the 95% level, including southern Europe,                                                under B1. Figure 10 and Table 3 summarize the regionally
large parts of the USA, the Amazon, southern South                                                      averaged D4–6 and D12+ drought frequencies and spatial
America, central west Africa and scattered regions in Asia.                                             extent of drought for the PICNTRL and 20C3m (1961–
Statistically significant changes in D12+ drought frequency                                             1990) simulations and the projected changes and their sta-
are less spatially extensive (Fig. 9), with both increases and                                          tistical significance for the three future climate scenarios
decreases scattered across the globe. The small extent of                                               (2070–2099). Note that increases in D4–6 drought frequency

                                                                                                                                                                      123
J. Sheffield, E. F. Wood: Projected changes in drought occurrence under future global warming

Table 2 Summary of multi-model global mean soil moisture and drought characteristics for the PICNTRL, 20C3M and future climate SRES B1,
A1B and A2 scenarios
                     PICNTRL       20C3M (1961–1990)          SRES B1 (2070–2099)         SRES A1B (2070–2099)        SRES A2 (2070–2099)

SM (%)               50.8, 0.9     49.8, 4.0                  45.8, 5.6                   44.7, 7.4                   44.9, 7.3
A (%)                9.2, 1.0      11.2, 3.1                  18.9, 6.2                   22.3, 7.2                   23.0, 6.7
D4–6 (30 year-1)     1.1, 0.3      1.4, 0.3                   2.2, 0.8                    2.6, 1.0                    2.8, 1.1
D12+ (30 year-1)     0.2, 0.14     0.3, 0.2                   0.6, 0.6                    0.7, 0.7                    0.7, 0.6
Dmean (months)       3.0, 1.4      3.2, 1.7                   4.7, 3.3                    5.4, 4.9                    5.2, 3.6
Smean (months %)     14.8, 7.0     17.8, 9.3                  31.9, 22.2                  39.8, 40.7                  38.2, 29.3
The first of each pair of values is the multi-model mean and the second is the multi-model IQR. The individual model PICNTRL values are
calculated as the average of the values in each 30-yr period within the whole simulation period, whose length varies among models and is
between 330 and 500 years

are statistically significant for about half the regions and               processes at the earth’s surface. This is complicated further
scenarios and for most regions for spatial extent. Significant             by changes in mean precipitation versus changes in pre-
changes in D12+ frequencies are restricted to the MED, and                 cipitation frequency and intensity and the seasonality of
CNA regions for all scenarios and the WORLD, SAF, CAM                      changes, especially in snow dominated regions. Apart from
and SSA regions for the higher emission scenarios only. In                 precipitation, the key linkage between climate change and
particular the MED region shows more than 2, 3 and 3 times                 changes in soil moisture is evaporation. Although temper-
increase in D4–6 and D12+ drought frequency and A,                         ature increases will tend to increase potential evaporation,
respectively since 1961–1990.                                              actual evaporation may be enhanced or diminished by
                                                                           precipitation increases and decreases respectively.
                                                                              Model projections of future climates show increases in
3.5 Drivers of changes in drought occurrence                               temperature globally and for all regions whereas changes in
                                                                           precipitation are regionally and often scenario dependent as
Figure 11 shows how predicted changes in regional                          shown for three example regions in Fig. 12. These regions
drought are skewed towards the warm season. The figure                     were chosen as they show diversity in changes in future
shows the multi-model mean of regional averaged, monthly                   drought. The MED region shows some of the largest
frequency of occurrence of soil moisture deficits for                      increases in drought frequency that is robust across models
q0(h) \ 10.0% for the PICNTRL, 20C3M and the three                         (Sect. 3.3). This can be directly attributed to reductions in
future climate scenarios. By definition the PICNTRL fre-                   precipitation totals, especially in the warm season,
quencies are 10% for all months. The 20C3M and SRES                        accompanied by reductions in runoff and soil moisture
frequencies are progressively larger, with 20C3M \                         (Fig. 12). Changes in evaporation are limited to small
B1 \ A1B \ A2 as noted previously. Warm season                             decreases in the summer, driven by reduced precipitation
increases are nearly always greater than those in cooler                   that is not offset by increased atmospheric demand from
seasons. For southern hemisphere regions, such as SAF,                     higher temperatures in an already water limited environ-
AMZ, SSA and AUS, the largest changes are predomi-                         ment. In the CNA region, drought occurrence is expected
nantly in the austral spring. In cooler regions (NAS, ALA,                 to increase but changes in other variables are mixed. Pre-
NEC), increased frequencies tend to be concentrated in the                 cipitation is expected to increase in the spring but decrease
warm season and increases in the cool season, especially                   in the summer. Coupled with increased temperature, this
for ALA and NAS, are minimal.                                              leads to increased evaporation in the spring but little
   Precipitation and temperature are the primary drivers of                change in the summer as decreased precipitation likely
drought. Increases in temperature will potentially increase                outweighs any increases in potential evaporation.
transpiration and direct evaporation from the soil through                    Changes in drought in the NAS region are modest but are
increased atmospheric demand, while increases in precipi-                  focused on the summertime and are generally representative
tation will tend to increase soil moisture. Conversely,                    of other high latitude regions. The hydrology in these regions
decreases in temperature and precipitation will tend to                    is dominated by snow and ice processes which, given
increase and decrease soil moisture respectively. However                  increases in air temperature in these regions, can explain the
the contribution of future changes in temperature and pre-                 seasonally disproportionate changes in soil moisture deficits.
cipitation to changes in drought occurrence under future                   Warmer temperatures tend to reduce the snow cover through
climates is not straightforward because of the complex                     melting of the existing pack and increasing the ratio of
interactions between these forcing variables and hydrologic                rainfall to snowfall. Precipitation is also predicted to increase

123
J. Sheffield, E. F. Wood: Projected changes in drought occurrence under future global warming

Fig. 5 Regional time series of                                                                            World                          Northern Europe (NEU)                      Mediterranean (MED)
                                                                                        5                                         5                                       5
multi-model ensemble mean of
                                                                                        4                                         4                                       4
frequency of short-term
droughts (D4–6, q0(h) = 10.0%)                                                          3                                         3                                       3
for the twenty-first century for                                                        2                                         2                                       2
the SRESB1, SRESA1B and                                                                 1                                         1                                       1
SRESA2 scenarios. The values                                                            0                                         0                                       0
are calculated over a 30-year                                                                        West Africa (WAF)                      East Africa (EAF)                       Southern Africa (SAF)
moving window and then                                                                  5                                         5                                       5
averaged over each region                                                               4                                         4                                       4
                                                                                        3                                         3                                       3
                                                                                        2                                         2                                       2
                                                                                        1                                         1                                       1
                                                                                        0                                         0                                       0
                                                                                                     North Asia (NAS)                      Central Asia (CAS)                       Tibetan Plateau (TIB)
                                    Frequency of 4-6 month duration droughts (30yr-1)

                                                                                        5                                         5                                       5
                                                                                        4                                         4                                       4
                                                                                        3                                         3                                       3
                                                                                        2                                         2                                       2
                                                                                        1                                         1                                       1
                                                                                        0                                         0                                       0
                                                                                                      East Asia (EAS)                     Southeast Asia (SEA)                        South Asia (SAS)
                                                                                        5                                         5                                       5
                                                                                        4                                         4                                       4
                                                                                        3                                         3                                       3
                                                                                        2                                         2                                       2
                                                                                        1                                         1                                       1
                                                                                        0                                         0                                       0
                                                                                                      Australia (AUS)                         Alaska (ALA)                        Northeast Canada (NEC)
                                                                                        5                                         5                                       5
                                                                                        4                                         4                                       4
                                                                                        3                                         3                                       3
                                                                                        2                                         2                                       2
                                                                                        1                                         1                                       1
                                                                                        0                                         0                                       0
                                                                                               Western North America (WNA)             Central North America (CNA)               Eastern North America (ENA)
                                                                                        5                                         5                                       5
                                                                                        4                                         4                                       4
                                                                                        3                                         3                                       3
                                                                                        2                                         2                                       2
                                                                                        1                                         1                                       1
                                                                                        0                                         0                                       0
                                                                                                   Central America (CAM)                     Amazon (AMZ)                     Southern South America (SSA)
                                                                                        5                                         5                                       5
                                                                                        4                                         4                                       4
                                                                                        3                                         3                                       3
                                                                                        2                                         2                                       2
                                                                                        1                                         1                                       1
                                                                                        0                                         0                                      0
                                                                                            1900   1950    2000    2050    2100 1900     1950     2000    2050       2100 1900      1950     2000   2050       2100

                                                                                                                         SRESB1          SRESA1B                 SRESA2              20C3M

in the winter (and throughout the rest of the year). Rain                                                                    temperatures. The frequency of soil moisture deficits there-
falling on the existing snow pack will also increase the rate of                                                             fore increases disproportionately in the summer time
melting. This will in turn shift the spring melt earlier. These                                                              compared to the wintertime.
changes force wetter soil moisture conditions in the winter
and spring, although this is offset somewhat by increased
evapotranspiration due to higher temperatures. During the                                                                    4 Detectability of changes in drought
summer, soil moisture is reduced, despite increased precip-
itation, because of earlier spring melt that is compounded by                                                                The detection of statistically significant changes in drought
evapotranspiration increases as a result of increased                                                                        is dependent upon, among other factors, the strength of the

                                                                                                                                                                                                    123
J. Sheffield, E. F. Wood: Projected changes in drought occurrence under future global warming

Fig. 6 As Fig. 5 but for long-                                                                            World                                Northern Europe (NEU)                            Mediterranean (MED)
                                                                                       2                                          2                                               2
term (D12+) drought frequency
                                                                                      1.5                                      1.5                                            1.5

                                                                                       1                                          1                                               1

                                                                                      0.5                                      0.5                                            0.5

                                                                                       0                                          0                                               0

                                                                                                     West Africa (WAF)                            East Africa (EAF)                             Southern Africa (SAF)
                                                                                       2                                          2                                               2

                                                                                      1.5                                      1.5                                            1.5

                                                                                       1                                          1                                               1

                                                                                      0.5                                      0.5                                            0.5

                                                                                       0                                          0                                               0

                                                                                                     North Asia (NAS)                            Central Asia (CAS)                             Tibetan Plateau (TIB)
                                                                                       2                                          2                                               2
                                  Frequency of 12+ month duration droughts (30yr-1)

                                                                                      1.5                                      1.5                                            1.5

                                                                                       1                                          1                                               1

                                                                                      0.5                                      0.5                                            0.5

                                                                                       0                                          0                                               0

                                                                                                      East Asia (EAS)                           Southeast Asia (SEA)                              South Asia (SAS)
                                                                                       2                                          2                                               2

                                                                                      1.5                                      1.5                                            1.5

                                                                                       1                                          1                                               1

                                                                                      0.5                                      0.5                                            0.5

                                                                                       0                                          0                                               0

                                                                                                      Australia (AUS)                               Alaska (ALA)                              Northeast Canada (NEC)
                                                                                       2                                          2                                               2

                                                                                      1.5                                      1.5                                            1.5

                                                                                       1                                          1                                               1

                                                                                      0.5                                      0.5                                            0.5

                                                                                       0                                          0                                               0

                                                                                               Western North America (WNA)                   Central North America (CNA)                     Eastern North America (ENA)
                                                                                       2                                          2                                               2

                                                                                      1.5                                      1.5                                            1.5

                                                                                       1                                          1                                               1

                                                                                      0.5                                      0.5                                            0.5

                                                                                       0                                          0                                               0

                                                                                                   Central America (CAM)                           Amazon (AMZ)                          Southern South America (SSA)
                                                                                       2                                          2                                               2

                                                                                      1.5                                      1.5                                            1.5

                                                                                       1                                          1                                               1

                                                                                      0.5                                      0.5                                            0.5

                                                                                       0                                          0                                               0
                                                                                            1900   1950    2000    2050    2100       1900     1950     2000    2050       2100       1900      1950     2000   2050       2100

                                                                                                                           SRESB1                 SRESA1B              SRESA2                    20C3M

change (signal) against the background of natural vari-                                                                      regions where changes become significant or detectable at
ability (noise). As these factors vary, a change will be                                                                     later time periods (if simulation data are available).
detected earlier or later, and the time of detection can be
used to quantify detectability (e.g., Ziegler et al. 2003). The
above analysis shows that statistically significant changes                                                                  4.1 Examples of regional detectability
are predicted to occur in many regions by the end of this
century, in particular the MED, SAF, CNA and CAM                                                                             Figure 13 shows some examples of the detectability of
regions. However, these changes may actually have                                                                            drought occurrence for the A2 scenario for the WORLD
become significant at earlier times and there may be other                                                                   and five regions (MED, CNA, SAF, AMZ and SAS). These

123
J. Sheffield, E. F. Wood: Projected changes in drought occurrence under future global warming

Fig. 7 As Fig. 5 but for the                                                                   World
                                                                                                                         50
                                                                                                                                       Northern Europe (NEU)
                                                                                                                                                                          50
                                                                                                                                                                                         Mediterranean (MED)
                                                                            50
spatial extent of monthly
                                                                            40                                           40                                               40
drought, q0(h) = 10%
                                                                            30                                           30                                               30
                                                                            20                                           20                                               20
                                                                            10                                           10                                               10
                                                                             0                                            0                                                0

                                                                                          West Africa (WAF)                               East Africa (EAF)                              Southern Africa (SAF)
                                                                            50                                           50                                               50
                                                                            40                                           40                                               40
                                                                            30                                           30                                               30
                                                                            20                                           20                                               20
                                                                            10                                           10                                               10
                                                                             0                                            0                                                0

                                                                                          North Asia (NAS)                               Central Asia (CAS)                              Tibetan Plateau (TIB)
                                                                            50                                           50                                               50
                                                                            40                                           40                                               40
                                                                            30                                           30                                               30
                                    Spatial extent of monthly drought (%)

                                                                            20                                           20                                               20
                                                                            10                                           10                                               10
                                                                             0                                            0                                                0

                                                                                           East Asia (EAS)                              Southeast Asia (SEA)                               South Asia (SAS)
                                                                            50                                           50                                               50
                                                                            40                                           40                                               40
                                                                            30                                           30                                               30
                                                                            20                                           20                                               20
                                                                            10                                           10                                               10
                                                                             0                                            0                                                0

                                                                                           Australia (AUS)                                  Alaska (ALA)                               Northeast Canada (NEC)
                                                                            50                                           50                                               50
                                                                            40                                           40                                               40
                                                                            30                                           30                                               30
                                                                            20                                           20                                               20
                                                                            10                                           10                                               10
                                                                             0                                            0                                                0

                                                                                    Western North America (WNA)                      Central North America (CNA)                      Eastern North America (ENA)
                                                                            50                                           50                                               50
                                                                            40                                           40                                               40
                                                                            30                                           30                                               30
                                                                            20                                           20                                               20
                                                                            10                                           10                                               10
                                                                             0                                            0                                                0

                                                                                        Central America (CAM)                              Amazon (AMZ)                           Southern South America (SSA)
                                                                            50                                           50                                               50
                                                                            40                                           40                                               40
                                                                            30                                           30                                               30
                                                                            20                                           20                                               20
                                                                            10                                           10                                               10
                                                                             0                                            0                                                0
                                                                                 1900   1950    2000    2050      2100        1900     1950     2000    2050       2100        1900      1950    2000    2050       2100

                                                                                                                SRESB1                 SRESA1B                SRESA2                   20C3M

regions were chosen as they represent a variety of                                                                  characteristic and scenario, although we only show results
increasing drought responses (some regions, such as NEU                                                             here for A2 (results for all scenarios are shown in Sect.
and NAS, show no statistically significant changes). As the                                                         4.2). The variance (or spread) among models is also a
mean change in drought occurrence increases over time,                                                              factor. For some regions (e.g., MED) the changes are
because of, for example, decreasing precipitation, the                                                              detectable by mid-twenty-first century. In others, such as
statistical significance of the change generally also                                                               WORLD, changes at the same confidence level vary by
increases. Whether the changes in drought occurrence are                                                            several decades between drought characteristics. Else-
statistically significant is dependent on the region, drought                                                       where, changes can flip between being detectable or not

                                                                                                                                                                                                        123
J. Sheffield, E. F. Wood: Projected changes in drought occurrence under future global warming

Fig. 8 Multimodel ensemble mean of frequency of D4–6 droughts in       climate predictions. Statistically significant changes were estimated
the 20C3M (1961–1990) simulation and for 2070–2099 in the              by calculating t test statistics under the null hypothesis that the mean
SRESB1, SRESA1B and SRESA2 future climate scenarios. Also              of distribution of 20C3M period drought frequency equals the mean
shown are the standard deviation of the 20C3M (1961–1990) multi-       of distribution for the future climate period. Results are shown for
model ensemble and the statistical significance of the difference in   significance levels of 90.0, 95.0, 99.0 and 99.9% with negative values
ensemble means between the 20C3M simulation and the future             indicating a decrease in the frequency of drought

123
J. Sheffield, E. F. Wood: Projected changes in drought occurrence under future global warming

Fig. 9 As for Fig. 8, but for frequency of D12+ droughts

                                                                                                123
J. Sheffield, E. F. Wood: Projected changes in drought occurrence under future global warming

month droughts                    12                        20C3M 1961-90                      period in which the mean change in the regional average
                                                            SRES B1 2070-99
Number of 4-6

                                  10
                                                            SRES A1B 2070-99                   drought characteristic first becomes statistically significant
                                   8                        SRES A2 2070-99
                                   6
                                                                                               (at the 0.05 level), although in reality we would not be able
                                   4                                                           to make an assessment until the end of the period once
                                   2                                                           observations had been made. An earlier year of detection
                                   0
                                                                                               represents higher detectability in the predicted changes.
                                       world
                                        neu
                                               med
                                               waf
                                                eaf
                                                saf
                                               nas
                                               cas
                                                       tib
                                                      eas
                                                      sas
                                                      sea
                                                      aus
                                                                        ala
                                                                       nec
                                                                      wna
                                                                       cna
                                                                      ena
                                                                      cam
                                                                      amz
                                                                       ssa
                                                                                               Table 4 indicates that changes in D4–6 frequency and
                                   5                                                           drought extent are the most detectable drought character-
Number of 12+
                month droughts

                                   4                                                           istics. D12+ changes are undetectable in most regions.
                                   3                                                           Changes in the MED, CAM and SSA regions are detectable
                                   2
                                                                                               for all drought characteristics and scenarios (shown pre-
                                   1
                                                                                               viously in the end of century summary, Fig. 10) and in the
                                   0
                                                                                               WORLD and SAF regions for at least one scenario. For
                                       world
                                        neu
                                               med
                                               waf
                                                eaf
                                                saf
                                               nas
                                               cas
                                                      tib
                                                            eas
                                                            sas
                                                            sea
                                                            aus
                                                                        ala
                                                                       nec
                                                                      wna
                                                                       cna
                                                                      ena
                                                                      cam
                                                                      amz
                                                                       ssa
                                                                                               some regions (e.g., NEU, EAF, SEA), the changes are
                                  40                                                           undetectable within the simulation period. Calculations
duration (months)
  Mean drought

                                  30                                                           with data from lower emission scenarios, such as B1, tend
                                  20                                                           to increase the time to detection as the magnitude of the
                                                                                               changes are lower (although variance may decrease if
                                  10
                                                                                               models show more consensus and tend to increase detect-
                                   0
                                                                                               ability). Detectability under higher emission scenarios is
                                       world
                                        neu
                                               med
                                               waf
                                                eaf
                                                saf
                                               nas
                                               cas
                                                       tib
                                                      eas
                                                      sas
                                                      sea
                                                      aus
                                                                        ala
                                                                       nec
                                                                      wna
                                                                       cna
                                                                      ena
                                                                      cam
                                                                      amz
                                                                       ssa

                                                                                               increased (detection time decreases) because the magnitude
                                                                                               of change increases (increased signal to noise ratio),
severity (% months)

                                 300
  Mean drought

                                                                                               although this is complicated by the possibility that the
                                 200                                                           uncertainty in future changes under higher greenhouse gas
                                 100                                                           concentrations may increase the spread in model
                                                                                               projections.
                                   0
                                       world
                                        neu
                                               med
                                               waf
                                                eaf
                                                saf
                                               nas
                                               cas
                                                       tib
                                                      eas
                                                      sas
                                                      sea
                                                      aus
                                                                        ala
                                                                       nec
                                                                      wna
                                                                       cna
                                                                      ena
                                                                      cam
                                                                      amz
                                                                       ssa

Fig. 10 Regionally averaged drought statistics for 1961–1990
                                                                                               4.3 Detectability as a function of risk
(20C3M) and three future climate scenarios for 2070–2099 (SRES
B1, SRES A1B, SRES A2). Drought statistics are frequency of 4–6-                               The time of detection is also inherently controlled by the
month duration droughts, frequency of 12+-month duration droughts,                             level of risk that one is willing to take in making the
mean drought duration and mean drought severity. Box and whispers
represent the inter quartile range and maximum and minimum values
                                                                                               determination. The estimates in Sects. 3.3 and 4.2 are
of the set of models. The mean model value is shown as colored                                 made using a conservative, low-risk probability (a = 0.05)
circles if the change is statistically significant at the 95% level                            of making an error in detection. This low risk value could
relative to 1961–1990 from the 20C3M simulation                                                be representative of a conservative attitude to global
                                                                                               warming in which more time is needed for detection
(e.g., SAF for D4–6 frequency) or between two levels of                                        before taking steps toward mitigating the impacts of
significance (e.g., SAS for D4–6 frequency), which has                                         global warming; higher risk values imply less time is
implications for decision making based on discrete                                             required for detection. Figure 14 shows the sensitivity of
thresholds. In general, D4–6 frequency is more detectable                                      detection times to the test significance. As we instil more
than D12+ frequency, although the CNA region shows the                                         confidence in the detection process and a decreases, our
opposite behaviour and in the AMZ region only changes in                                       willingness to falsely detect a change when none is
D4–6 frequency are detectable. Changes in D4–6 droughts in                                     occurring decreases. Therefore the size of the change has
the SAS region become detectable relatively early (around                                      to be larger for us to be confident that it is statistically
2020) despite their small magnitude.                                                           different from background variability, which generally
                                                                                               implies that we have to wait longer to detect the change
                                                                                               and thus detectability decreases. At a = 0.05 the detection
4.2 Detectability under different scenarios                                                    times for changes in drought characteristics vary widely
                                                                                               depending on the region and variable, and changes for
Table 4 summarizes the detectability of changes in regio-                                      some variables are essentially undetectable (e.g., NAS for
nal drought for the three future climate scenarios.                                            all variables). Detection times for lower confidence levels
Detectability is quantified as the mid-year of the 30-year                                     are earlier, as expected, although often not substantially

123
J. Sheffield, E. F. Wood: Projected changes in drought occurrence under future global warming

Table 3 Regionally averaged,
                                              D4–6                           D12+                           A
multi-model mean values of
short- (D4–6) and long (D12+)                 PIC    20C   B1    A1B   A2    PIC    20C   B1    A1B   A2    PIC    20C    B1     A1B    A2
term drought frequencies and
spatial extent of drought (A), for    WORLD   1.1    1.4   2.2   2.6   2.8   0.2    0.3   0.6   0.7   0.7    9.2   11.2   18.9   22.3   23.0
the PICNTRL (PIC), 20C3M              NEU     1.4    2.0   2.3   2.9   2.9   0.1    0.2   0.2   0.2   0.2    9.2   11.1   12.3   13.3   14.1
(1961–1990) (20C) and SRES
B1, A1B, A2 (2070–2099)               MED     1.2    2.1   3.5   4.3   4.6   0.2    0.5   1.2   1.5   1.7    8.7   15.7   32.7   41.4   44.7
scenarios                             WAF     1.3    2.0   3.0   3.8   4.4   0.2    0.5   0.8   1.0   1.1    9.9   15.1   23.0   27.9   30.2
                                      EAF     1.2    1.5   2.0   2.4   2.6   0.2    0.3   0.3   0.4   0.4    9.7   11.2   14.5   16.9   17.1
                                      SAF     0.9    1.1   2.2   2.7   3.1   0.2    0.3   0.9   1.2   1.1    9.4   10.3   24.3   31.7   30.7
                                      NAS     1.0    0.9   1.5   1.7   1.8   0.2    0.2   0.4   0.4   0.4    9.8    9.9   13.6   15.0   14.9
                                      CAS     1.4    1.8   2.9   3.6   4.0   0.2    0.4   0.7   0.7   0.8    9.9   12.8   25.0   27.9   29.2
                                      TIB     1.5    1.7   2.1   2.6   3.0   0.2    0.5   0.5   0.7   0.7   10.0   14.8   19.4   24.1   24.4
                                      EAS     1.3    1.5   1.8   2.2   2.3   0.2    0.2   0.3   0.4   0.4    9.3   10.5   13.1   15.5   15.7
                                      SAS     1.3    1.7   2.7   2.8   2.8   0.2    0.4   0.5   0.5   0.4    9.4   14.0   17.9   20.4   18.5
                                      SEA     1.2    1.7   1.9   2.0   2.2   0.1    0.1   0.2   0.2   0.3    7.2    9.0   10.4   11.6   12.6
                                      AUS     1.0    1.2   1.5   1.9   1.8   0.3    0.5   0.8   0.9   0.9    9.3   12.2   20.2   22.1   22.4
                                      ALA     1.1    1.0   1.4   1.6   1.7   0.1    0.1   0.4   0.4   0.4    9.6    9.8   15.5   17.4   17.7
                                      NEC     1.0    0.9   1.5   1.7   1.8   0.1    0.3   0.4   0.4   0.4    8.8    8.8   17.3   18.3   18.2
                                      WNA     1.5    1.6   2.8   3.2   4.1   0.2    0.2   0.5   0.4   0.7    9.9   10.8   18.8   21.3   24.8
                                      CNA     1.6    2.0   3.0   3.2   3.8   0.2    0.2   0.6   0.8   1.1    9.9    9.7   20.3   26.3   30.5
Future values in bold are             ENA     1.5    1.8   3.1   3.3   4.0   0.1    0.2   0.5   0.5   0.5    8.9   10.4   18.2   21.1   24.1
statistically significant, relative   CAM     1.3    1.9   3.2   3.4   3.7   0.1    0.2   1.3   1.5   1.7    8.5   10.8   30.6   36.0   41.1
to 1961–1990 of the 20C3M             AMZ     1.4    1.7   3.1   3.9   3.8   0.2    0.2   0.7   0.8   0.9    9.7   11.8   23.8   28.0   29.0
simulation, at the 0.05 level
                                      SSA     1.3    1.4   2.5   3.1   3.2   0.2    0.2   0.5   0.8   0.8    9.5   10.1   19.0   24.8   24.9
with df = 14

different from the 95% values. However, above the 99%                  of the coupled atmosphere-ocean-land system. Figure 15
level, the changes generally become undetectable within                gives the detection times when using either the PICNTRL
the simulation period. For example, detection times for                or the 20C3M (1961–1990) data to estimate the back-
changes in D12+ frequency over CNA increase from about                 ground variability. Detectability generally increases when
2050 at 95% and below, to undetectable for 99% and                     using the PICNTRL data as would be expected, because
above.                                                                 drought frequency is, in general, relatively lower in the
                                                                       PICNTRL compared to the 20C3M simulations (as shown
                                                                       in the regional statistics in Table 3). It should be noted
4.4 Detectability relative to natural variability                      though that decadal variability within the twentieth century
                                                                       means that for some regions 1961–1990 is a wet period and
Detection of change is dependent on the background noise               the changes become detectable earlier than when using the
used to quantify the variability of the system. The results            PICNTRL data.
shown so far are relative to the model twentieth century
simulations, which represent contemporary climate and
thus encompass observed climate variability. This allows               4.5 Multi-model ensemble versus single model
us to perceive future changes relative to the contemporary                 detectability
occurrence of drought of which we have first hand expe-
rience. Nevertheless, it is also of interest to know the               Given the uncertainty in future climate projections by a
detectability of drought changes relative to a ‘‘pristine’’            single model, this study is based on a multi-model ensem-
climate without elevated greenhouse gases, and so estimate             ble. This enables us to capture the uncertainty in the
the anthropogenic influence on drought occurrence. This                representation of climate processes. However we have
was done by calculating the detectability relative to the              chosen to use a single model simulation as representative of
PICNTRL simulations, and therefore assuming that these                 each particular model despite the variability among same
are our best estimate of natural variability. Variability in           model simulations that differ only by their initial condi-
these simulations results from a number of sources                     tions. To assess how detectability differs when using the
including variability in solar output and internal variability         predicted climate of a single model we calculated the year

                                                                                                                                 123
You can also read