2021 Wild Coho Forecasts for Puget Sound, Washington Coast, and Lower Columbia - WDFW
←
→
Page content transcription
If your browser does not render page correctly, please read the page content below
2021 Wild Coho Forecasts for
    Puget Sound, Washington Coast, and Lower Columbia
                               Washington Department of Fish & Wildlife
                                    Science Division, Fish Program
                                                         by
                                                  Marisa N. C. Litz

Contributors: This coho forecast was made possible through funding from numerous federal, state, and
local sources and the participation of numerous WDFW, tribal, and PUD biologists. The following WDFW
employees, listed in alphabetical order, provided field data used in the 2021 forecast: Kale Bentley and
Brad Garner (Grays River), Clayton Kinsel (Skagit River and Big Beef Creek), Matt Klungle (Nisqually River),
Jamie Lamperth (Mill, Abernathy, and Germany creeks), Peter Lisi (Lake Washington), John Serl (Cowlitz
Falls), Pete Topping (Green River and Deschutes River), and Devin West (Bingham Creek, Chehalis River).
Sources of smolt data from tribal and PUD biologists and sources of freshwater and marine
environmental indicators are cited in the document. Thank you to Skip Albertson of the WA Department
of Ecology Marine Water Monitoring Program. Dave Seiler, Greg Volkhardt, Dan Rawding, Mara
Zimmerman, and Thomas Buehrens have contributed to the conceptual approaches used in this forecast.

Introduction
   Run size forecasts for wild coho stocks are an important part of the pre-season planning process for
Washington State salmon fisheries. Accurate forecasts are needed at the scale of management units to
ensure adequate spawning escapements, realize harvest benefits, and achieve harvest allocation goals.
    Wild coho run sizes (adult ocean recruits) have been predicted using various approaches across
Washington’s coho producing systems. Methods that rely on the relationship between adult escapement
and resulting run sizes are problematic due to inaccurate escapement estimates and difficulty allocating
catch in mixed stock fisheries. In addition, escapement-based coho forecasts often have no predictive
value because watersheds become fully seeded at low spawner abundances (Bradford et al. 2000).
Furthermore, different variables in the freshwater (Lawson et al. 2004; Sharma and Hilborn 2001) and
marine environments (Logerwell et al. 2003; Nickelson 1986; Rupp et al. 2012; Ryding and Skalski 1999)
influence coho survival and recruitment to the next life stage. Therefore, the accuracy of coho run size
forecasts can be improved by partitioning recruitment into freshwater production and marine survival.
In this forecast, wild coho run sizes (adult ocean recruits) are the product of smolt abundance and marine
survival and are expressed in a matrix that combines these two components. This approach is like that
used to predict hatchery returns where the starting population (number of smolts released) is known.
    Freshwater production, or smolt abundance, is measured as the number of coho smolts leaving
freshwater at the conclusion of the freshwater life stage. The Washington Department of Fish and
Wildlife (WDFW) and tribal natural resource departments have made substantial investments to monitor
smolt abundance in order to assess watershed capacity and escapement goals and to improve run size

  2021 Wild Coho Forecasts for Puget Sound, Washington Coast, and Lower Columbia
  WDFW Fish Science Division

                                                           1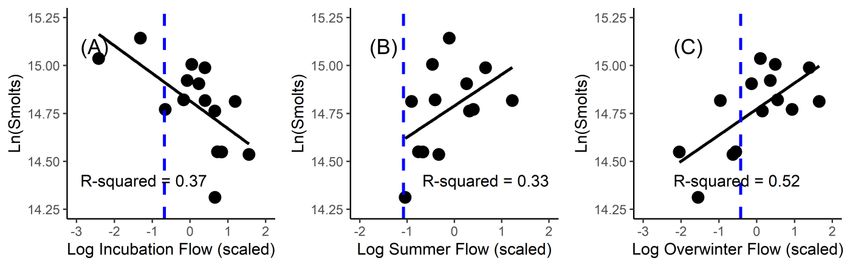
forecasts. Long-term studies on wild coho populations have been used to identify environmental
variables contributing to freshwater production (e.g., low summer flows, pink salmon escapement,
watershed gradient). For stocks where smolt abundance is not measured, smolt abundance is estimated
by using the identified correlates and extrapolating information from neighboring or comparable
watersheds.
    Marine survival is defined as survival after passing the smolt trap through the ocean rearing phase
to the point that harvest begins. Marine survival of a given cohort is measured by summing coho harvest
and escapement and dividing by smolt production. Harvest of wild coho is measured by releasing a
known number of coded-wire tagged wild coho smolts and compiling their recoveries in coastwide
fisheries. Coastwide recoveries are compiled from the Regional Mark Processing Center database
(www.rpmc.org). Tags detected in returning spawners are enumerated at upstream trapping structures.
Results from these monitoring stations are correlated with ecological variables from the marine
environment to describe patterns in survival among years and watersheds. The identified correlations
are used to predict or forecast marine survival of wild coho cohort for a given year.
    The WDFW Fish Program Science Division has developed forecasts of wild coho run size since 1996
when a wild coho forecast was developed for all primary and most secondary management units in Puget
Sound and the Washington coast (Seiler 1996). A forecast methodology for Lower Columbia natural coho
was added in 2000 (Seiler 2000) and has continued to evolve in response to listing of Lower Columbia
coho under the Endangered Species Act in 2005 (Volkhardt et al. 2007). The methodology used in these
forecasts continues to be updated; the most notable update in recent years has been in the methods
used to predict marine survival.
    Table 1 summarizes the 2021 run-size forecasts for wild coho for Puget Sound, Washington Coast,
and Lower Columbia River systems. Forecasts of three-year old ocean recruits were adjusted to January
age-3 recruits in order to provide appropriate inputs for coho management models (expansion factor =
1.23, expansion provides for natural mortality). The following sections describe the approach used to
derive smolt production and predict marine survival.

  2021 Wild Coho Forecasts for Puget Sound, Washington Coast, and Lower Columbia
  WDFW Fish Science Division

                                                           2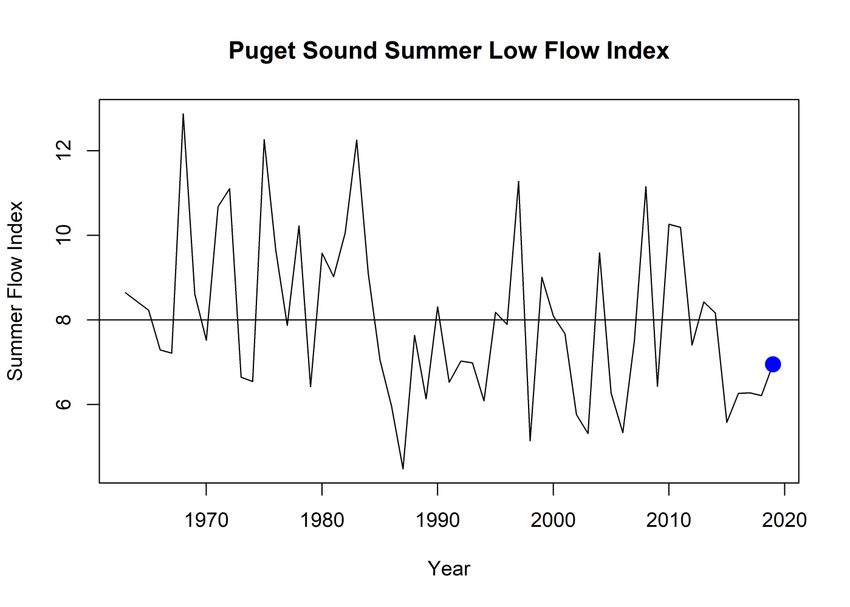
Table 1. 2021 wild coho run forecast summary for Puget Sound, Coastal Washington, and Lower Columbia.
                                Production      X    Marine Survival     =           Recruits
         Production             Estimated Smolts          Predicted           Adults        Jan.
             Unit                 Spring 2020          Marine Survival        (Age 3)     (Age 3)
Puget Sound
Primary Units
 Skagit River                      1,057,000                   5.7%           60,249       74,208
 Stillaguamish River                462,000                    4.8%           22,176       27,314
 Snohomish River                   1,519,000                   4.8%           72,912       89,805
 Hood Canal                         320,000                    4.6%           14,720       18,131
 Straits of Juan de Fuca            322,000                    1.6%            5,152       6,346
Secondary Units
 Nooksack River                    1,348,000                   2.9%           39,092       48,149
 Strait of Georgia                   16,000                    2.9%                464      572
 Samish River                        34,000                    5.7%            1,938       2,387
 Lake Washington                     49,000                    4.4%            2,156       2,656
 Green River                         48,000                    4.4%            2,112       2,601
 East Kitsap                         92,000                    4.4%            4,048       4,986
 Puyallup River                     435,000                    4.4%           19,140       23,575
 Nisqually River                     79,000                    4.1%            3,239       3,989
 Deschutes River                     15,000                    4.1%                615      757
 South Sound                        180,000                    4.1%            7,380       9,090
           Puget Sound Total       5,976,000                                  255,393     314,566
Coast
 Quillayute River                   221,000                    3.2%            7,072       8,711
 Hoh River                           94,000                    3.2%            3,008       3,705
 Queets River                       162,000                    3.2%            5,184       6,385
 Quinault River                     164,000                    3.2%            5,248       6,464
 Independent Tributaries            148,000                    3.2%            4,736       5,833
 Grays Harbor
  Chehalis River                   2,329,483                   3.2%           74,543       91,815
  Humptulips River                  253,250                    3.2%            8,104       9,982
 Willapa Bay                        595,000                    3.2%           19,040       23,451
        Coastal Systems Total      3,966,733                                  126,935     156,345
        Lower Columbia Total        574,000                    4.5%           25,830       31,815
                GRAND TOTAL        10,516,733                                 408,158     502,726

  2021 Wild Coho Forecasts for Puget Sound, Washington Coast, and Lower Columbia
  WDFW Fish Science Division

                                                           3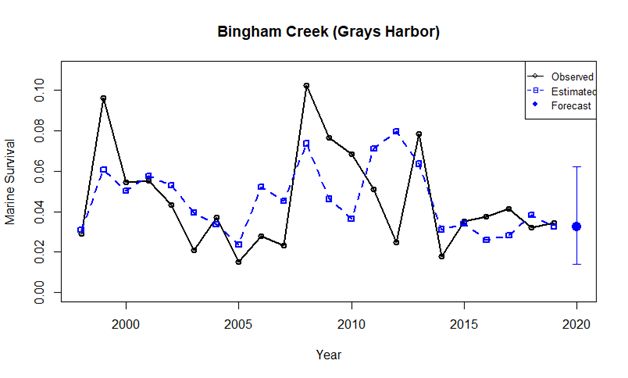
Puget Sound Smolt Production
Approach

    Wild coho production estimates for each of the primary and secondary management units in Puget
Sound were derived from results of juvenile trapping studies. Over the past 30 years, WDFW has
measured wild coho production in the Skagit, Stillaguamish, Snohomish, Green, Nisqually, and Deschutes
rivers as well as in tributaries to Lake Washington and Hood Canal. Analyses of these long-term data sets
demonstrated that wild coho smolt production is limited by a combination of factors including seeding
levels (i.e., escapement), environmental conditions (flows, marine derived nutrients), and habitat
degradation. In several systems, census adult coho data are available to pair with the juvenile abundance
estimates. In these systems, freshwater productivity (juveniles/female) is a decreasing function of
spawner abundance (Figure 1), demonstrating density dependence in juvenile survival. In most
watersheds, overall production of juvenile coho (juveniles/female * number females) is rarely limited by
spawner abundance, and the majority of variation in juvenile production is the result of environmental
conditions (Bradford et al. 2000). Summer rearing flows are a key environmental variable affecting the
freshwater survival and production of Puget Sound coho (Mathews and Olson 1980; Smoker 1955),
although extreme flow events in the overwinter rearing period (Kinsel et al. 2009) and local habitat
condition influenced by wood cover and channel complexity, fish passage, road densities, and water
quality are also likely to influence smolt production (Quinn and Peterson 1996; Sharma and Hilborn
2001). In addition, increases in odd-year pink salmon returns to Puget Sound beginning in 2001 have
dramatically increased the marine derived nutrients and food resources available for coho salmon
cohorts resulting from even-year spawners because these cohorts rear in freshwater in odd years when
pink salmon carcasses, eggs and fry are present in the river systems.
   In some watersheds, habitat degradation and depressed run sizes have been a chronic issue. Smaller
watersheds, which provide important spawning habitat for coho, are particularly sensitive to both
habitat degradation and low escapements. Density-dependent compensation may not be observed
when habitat degradation is severe or when escapements fall below critical thresholds. For example,
chronically low coho returns to the Deschutes River (South Sound), beginning in the mid-1990s, have
resulted in much lower freshwater survival (juveniles/female) than would be predicted from years when
coho salmon returns to the Deschutes River were substantially higher (Figure 2a) or from other
watersheds where spawner escapement has not been chronically depressed (Figure 1).

  2021 Wild Coho Forecasts for Puget Sound, Washington Coast, and Lower Columbia
  WDFW Fish Science Division

                                                           4
(a) 120
y = 41916x -0.796 Figure 1. Freshwater productivity
100 R² = 0.93 (juveniles/female) as a decreasing function of
female coho escapement in the South Fork
Smolts/female
80 Skykomish (a, Sunset Falls, brood year 1976-
1984) and Big Beef Creek (b, brood year 1978-
60 2009) watersheds.
40
20
0
0 5,000 10,000 15,000
Female coho
(b) 120
y = 4872.6x -0.741
100 R² = 0.75
Smolts/female
80
60
40
20
0
0 500 1000 1500 2000 2500
Female coho
2021 Wild Coho Forecasts for Puget Sound, Washington Coast, and Lower Columbia
WDFW Fish Science Division
5120 120 (b)
(a)
100 y = 829.78x -0.404 100
R² = 0.67
Smolts/female
Smolts/female
80 80
60 60
40 40
20
20
0
0 0 200 400 600 800 1,000 1,200
0 1,000 2,000 3,000 4,000 5,000
Female coho
Female coho
Figure 2. Freshwater productivity (juveniles/female) as a function of female coho spawners in the Deschutes River.
For brood year 1978-1994 (a), coho productivity was a decreasing function of escapement (black square) with the
exception of brood year 1989 (red square). The 1989 brood year corresponded with a landslide during egg
incubation. For brood year 1995 to 2009 (b), spawner escapements have been chronically depressed and coho
productivity has been far below the levels predicted (black line) under higher escapements (1978-1994).
In 2020, WDFW measured coho smolt abundance in five of the Puget Sound management units
(Skagit, Hood Canal, Lake Washington, Green, Nisqually). Smolt production data from six additional
management units (Nooksack, Juan de Fuca, Stillaguamish, Puyallup, East Kitsap, South Sound) were
available due to juvenile monitoring studies conducted by the Lummi, Jamestown, Elwha, Makah,
Stillaguamish, Puyallup, Suquamish, and Squaxin tribes. For watersheds where trapping data were not
available in 2020 (e.g., Snohomish, Samish), coho smolt abundance was indirectly estimated using
several approaches.
The most commonly used approach was based on the smolt potential predicted for each watershed
by Zillges (1977). Rearing habitat was estimated for each stream segment by the length of available
habitat defined in the Washington stream catalog (Williams et al. 1975) and summer stream width
estimated by Zillges (1977). Coho densities applied to the summer stream area of each segment was
based on smolt densities measured in small (Chapman 1965) and large (Lister and Walker 1966)
watersheds. Average production estimates for Puget Sound watersheds range between 8% and 100% of
the predicted potential production (Table 2). This approach was used to indirectly estimate production
from an entire watershed or management unit when smolt production was known from at least some
portion of that watershed or management unit or when a similar production level (percentage of
potential production) was assumed from a neighboring watershed.
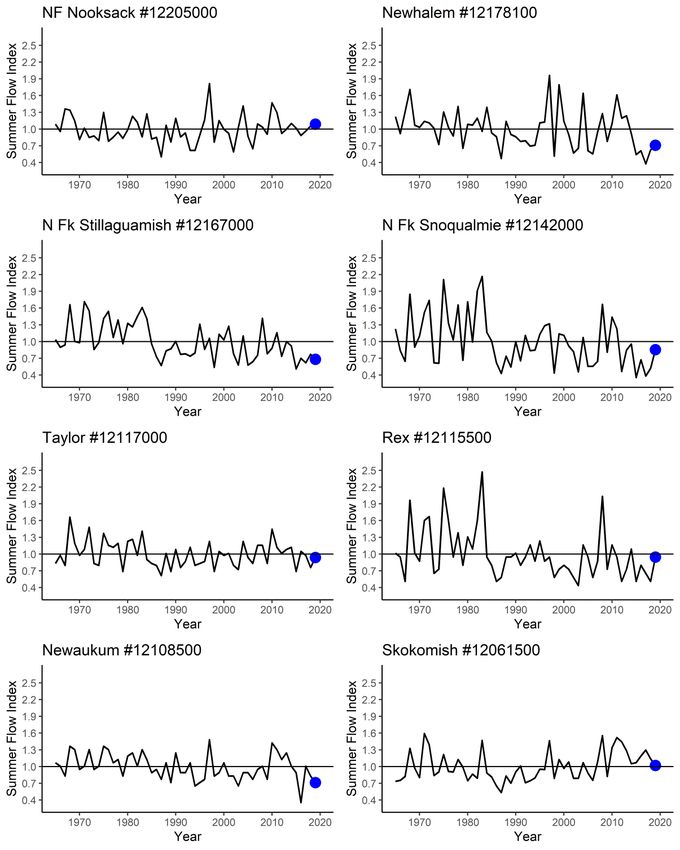
Zillges (1977) approach was based on the observation that summer flows are an important predictor
of freshwater survival in Puget Sound watersheds (Mathews and Olson 1980; Smoker 1955). Summer
flows in Puget Sound rivers can be described by the Puget Sound Summer Low Flow Index (PSSLFI,
2021 Wild Coho Forecasts for Puget Sound, Washington Coast, and Lower Columbia
WDFW Fish Science Division
6Appendix A). The PSSLFI is calculated from a representative series of eight USGS stream flow gages in
Puget Sound and is based on the general observation that summer low flows are correlated among Puget
Sound watersheds. Summer low flows in 2019 (corresponding to the 2020 outmigration and 2021
returning adults) had an index value of 7.0 or 87% of the average for the time series (Figure 3). In past
years, this index has been used to estimate smolts in watersheds where historical estimates were
available but current year estimates are not. In this year’s forecast, the information is provided as
context for the observed smolt production.
Table 2. Wild coho smolt production from WDFW smolt evaluation studies in Puget Sound watersheds. Table
includes the measured production compared to the potential production predicted by Zillges (1977) above the
smolt trap location in each watershed. Average values in this table are the arithmetic means and those of the
smolt production time series are geometric means.
Smolt production above trap Zillges (1977) potential above trap
Stream No. Years Geo mean Min Max Average Min Max
Hood Canal
Big Beef 43 25,352 8,115 58,136 65.7% 21.0% 150.7%
Little Anderson 27 388 45 1,969 7.6% 0.9% 38.6%
Seabeck 27 1,176 344 2,725 11.2% 3.3% 26.0%
Stavis 27 4,463 1,549 9,667 88.8% 30.8% 192.3%
Skagit River 31 1,040,290 426,963 1,884,668 75.9% 31.1% 137.5%
SF Skykomish River 9* 249,331** 212,039 353,981 82.0%** 69.7% 116.4%
Stillaguamish River 3 284,142** 211,671 383,756 42.9%** 31.9% 57.9%
Lake Washington
Cedar River*** 22 61,213 13,322 179,915 50.6% 11.0% 148.8%
Bear Creek 22 24,634 6,004 62,970 49.2% 12.0% 125.7%
Green River 17 53,915 22,671 194,393 23.9% 10.1% 86.2%
Nisqually 12 115,685 58,930 254,456 100.1% 51.0% 220.2%
Deschutes**** 40 19,566 1,187 133,198 8.9% 0.5% 60.7%
* Data does not include the three years when smolt production was limited by experimental escapement reduction.
** Arithmetic average, not geometric mean.
*** Cedar River production potential does not include new habitat available to coho above Landsburg Dam beginning in
2003.
**** Deschutes smolt production in this table includes yearling and sub yearling smolts. Both age classes are known to
contribute to adult returns. There were no trapping operations in 2019 or 2020.
2021 Wild Coho Forecasts for Puget Sound, Washington Coast, and Lower Columbia
WDFW Fish Science Division
7Figure 3. Puget Sound Summer Low Flow Index (PSSLFI) by summer rearing year (return year – 2). PSSLFI is based
on 60-day minimum flow averages at eight stream gages in Puget Sound (see Appendix A). The minimum 60-day
average flow at each gage is compared to the time series average (1963 to present) and then summed across all
eight gages. Flow index corresponding to the 2021 wild coho return (7.0) shown as blue point on graph.
2021 Wild Coho Forecasts for Puget Sound, Washington Coast, and Lower Columbia
WDFW Fish Science Division
8Puget Sound Primary Units
Skagit River
A total of 1,057,000 wild coho smolts (rounded from 1,057,204) are estimated to have emigrated
from the Skagit River in 2020 (Table 1). This estimate is based on catch of wild coho in a juvenile trap
operated on the lower main stem Skagit River (river mile 17.0 near Mount Vernon, Washington). The
juvenile trap was calibrated using recaptures of wild yearling coho marked and released from an
upstream tributary (Mannser Creek) and smolt abundance was calculated using a Petersen estimator
with Chapman modification (Seber 1973; Volkhardt et al. 2007). Coho smolt production from the Skagit
River in 2020 was 1,057,204 (±192,532 95% C.I.), which represents a 2% increase from the average
(geometric mean) of 1,040,290 smolts between the 1990 and 2020 ocean entry years (Table 2, Figure
4).
Figure 4. Time series of wild coho
smolt outmigration from the Skagit
River, ocean entry years 1990 to
2020. Blue point represents
outmigration of the cohort included
in this forecast. Horizontal line is
the geometric mean of the time
series.
Stillaguamish River
A total of 462,000 coho smolts (rounded from 462,210) are estimated to have emigrated from the
Stillaguamish River in 2020 (Table 1). This estimate was based on a CPUE index of abundance for the
2020 outmigration and a relationship between a time series of CPUEs versus back-calculated smolt
abundances for the Stillaguamish River.
There have been two different trapping operations conducted on the Stillaguamish River since 1981.
Between 1981 and 1983, smolt abundance estimates resulted from a juvenile trap study operated by
WDFW upstream of river mile (R.M.) 16. Basin-wide smolt abundance during these years was estimated
above the trap and expanded to the entire watershed above and below trap. The average smolt
abundance during these years was 360,000 smolts using methods described in previous forecast
documents (Seiler 1996; Zimmerman 2013). From 2001 to present, smolt catch-per-unit-effort (CPUE)
have been obtained from a juvenile trap study conducted by the Stillaguamish Tribe near R.M. 6 (K.
Konoski, Stillaguamish Natural Resources, personal communication). The more recent monitoring effort
has not included trap efficiency trials needed to directly expand CPUE to watershed abundance.
2021 Wild Coho Forecasts for Puget Sound, Washington Coast, and Lower Columbia
WDFW Fish Science Division
9However, CPUE provides an index of abundance to the extent that trap efficiency is relatively constant
among years. Between 2003 and 2020, CPUE has averaged 4.0 fish/hour (range 0.4 to 8.5). The first two
years of trap operation (2001, 2002) were shorter in length and CPUE data from these years are not
directly comparable to the remainder of the time series.
An indirect estimate of smolt abundance for the Stillaguamish River was back-calculated from ocean
age-3 abundance and an estimated marine survival rate. Ocean age-3 abundance is the summed
estimates of coho spawner escapement and harvest (terminal and pre-terminal) and is calculated
annually by the Coho Technical Committee of the Pacific Salmon Commission. Marine survival is not
directly available for the Stillaguamish River; however, a marine survival time series from the neighboring
SF Skykomish River was used to generate the back-calculated smolt time series for the Stillaguamish
River. Back calculated smolt estimates between 2003 and 2014 outmigration have a geometric mean of
426,000 smolts (range 165,000 to 1,195,000), values that bracket the watershed smolt estimates
calculated in 1981-1983.
Figure 5. Correlation between CPUE of
wild coho smolts in Stillaguamish smolt
trap and back-calculated smolt estimates,
2003 to 2014. The 2015 ocean entry year
was not used in the regression model.
Dashed blue line corresponds to the 2020
ocean entry year. Smolt trap data were
provided by K. Konoski (Stillaguamish
Natural Resources).
A positive correlation exists between the smolt trap CPUE and the back-calculated estimates of coho
smolts (Figure 5). Data were log transformed for analysis. This relationship was applied to the CPUE
obtained during the 2020 outmigration (4.3 fish/hour) resulting in an estimated outmigration of 462,210
smolts. The 2015 data were not used in the predictive model because this data point had large influence
on the fit of the regression. For the purpose of comparison, the predictive model that included the 2015
data resulted in an estimated outmigration of 418,663 smolts.
2021 Wild Coho Forecasts for Puget Sound, Washington Coast, and Lower Columbia
WDFW Fish Science Division
10Snohomish River
A total of 1,519,000 (rounded from 1,518,569) coho smolts are estimated to have emigrated from
the Snohomish River in 2020 (Table 1). The mark-recapture estimate of wild smolts in 2020 is not
available. Therefore, the estimated production is the recent 5-year geometric mean of the time series
(2015 to 2019) of coho smolt production from this management unit.
Coho smolt production in the Snohomish River is based on a mark-recapture estimate of smolt
abundance from two smolt traps, one operated on the Skykomish River (river mile 26.5) and the
second on the Snoqualmie River (R.M. 12.2). Traps are operated and results provided by the Tulalip
Tribes (D. Holmgren, personal communication). Smolt trap estimates for the Skykomish and
Snoqualmie rivers are summed and further expanded for rearing downstream of the trap locations in
the Snohomish River (per Zillges 1977). Coho smolt production from the Snohomish in 2020 was a 19%
decrease from the average (geometric mean) of 1,863,341 smolts between 2002 and 2019 ocean entry
years (Figure 6).
Figure 6. Time series of wild coho
smolt outmigration from the
Snohomish River, ocean entry years
2002 to 2020. No estimates are
available for 2008 or 2009. Blue point
represents outmigration of the cohort
included in this forecast. The
horizontal line is the geometric mean
of the time series. Data provided by
D. Holmgren (Tulalip Tribes).
Hood Canal
A total of 320,000 coho smolts (rounded from 320,079) are estimated to have emigrated from Hood
Canal tributaries in 2020 (Table 1). This estimate is based on measured smolt abundance in select
tributaries expanded to the entire management unit.
In 2020, wild coho smolt abundance was measured in Big Beef Creek (BBC; n = 19,499), Little
Anderson Creek (n = 57), Seabeck Creek (n = 344), and Stavis Creek (n = 4,426). Coho smolts in these
watersheds were captured in fan traps (BBC) and fence weirs. Catch was extrapolated for early and late
spring migrants using historical migration timing data.
The 2020 abundance of coho smolts from BBC was a decrease of 23% from the average (geometric
mean) of 25,352 between the 1978 and 2020 ocean entry years (Table 2, Figure 7). Coho smolt
abundances in neighboring Little Anderson, Seabeck, and Stavis creeks were decreases of 85%, 71%, and
1%, respectively, from the time series averages (geometric mean) in these watersheds (Table 2).
2021 Wild Coho Forecasts for Puget Sound, Washington Coast, and Lower Columbia
WDFW Fish Science Division
11Figure 7. Time series of wild coho
smolts from Big Beef Creek, ocean
entry years 1978 to 2020. Blue point
represents outmigration of the
cohort included in this forecast.
Horizontal line is the geometric mean
of the time series.
Three approaches have been used to expand measured smolt abundance in these tributaries to the
entire the Hood Canal management unit. The first approach assumes that coho abundance from all four
tributaries (Little Anderson, Big Beef, Seabeck, and Stavis creeks) was 5.9% of the entire Hood Canal
(Zillges 1977). A subsequent review by the Hood Canal Joint Technical Committee (HCJTC) revised this
estimate to 7.6% of Hood Canal (HCJTC 1994). A third approach (Volkhardt and Seiler 2001), based on
the HCJTC forecast review in summer of 2001, estimated that coho smolt abundance from Big Beef Creek
was 4.56% of Hood Canal.
As described, the three approaches estimated that the 2020 wild coho production in Hood Canal
ranged between 320,000 and 428,000 smolts. Using the Zillges approach, the total of 24,326 smolts from
the four tributaries were expanded to an estimated 412,305 Hood Canal smolts. Using the second
approach (HCJTC 1994 revision), the total smolts were expanded to 320,079. The third approach
expanded the 19,499 smolts from Big Beef Creek to a total of 427,610 Hood Canal smolts. This forecast
is based on the most conservative result, provided by the second approach.
Juan de Fuca
A total of 322,000 coho smolts (rounded from 322,153) are estimated to have emigrated from Juan
de Fuca tributaries in 2020 (Table 1). This estimate is based on measured smolt abundance in select
tributaries expanded to the entire management unit. In most years, up to eleven tributaries are
monitored in the Strait of Juan de Fuca through a collaborative effort by WDFW, Jamestown S’Klallam
Tribe, Elwha Tribe, and the Makah Tribe. Monitored tributaries were limited in 2020 but included creeks
in the eastern and western part of the Strait. Measured smolt abundance was extrapolated to all
tributaries in the Juan de Fuca management unit based on the proportion of summer rearing habitat
represented in the monitored tributaries (calculations provided by Hap Leon, Makah Tribe). The Elwha
and Dungeness rivers are managed separately from the Juan de Fuca management unit and are not
included in this forecast. Coho smolt production from the Juan de Fuca tributaries in 2020 was 16%
increase from the average (geometric mean) of 277,843 smolts between the 1998 and 2020 ocean entry
years (Figure 8).
2021 Wild Coho Forecasts for Puget Sound, Washington Coast, and Lower Columbia
WDFW Fish Science Division
12Figure 8. Time series of wild coho
smolts from Strait of Juan de Fuca
tributaries, ocean entry years 1998 to
2020. Blue point represents the
cohort contributing to this forecast.
The horizontal line is the geometric
mean of the time series. Data
provided by Hap Leon (Makah Tribe).
Puget Sound Secondary Units
Nooksack River
A total of 1,348,000 coho smolts (rounded from 1,348,442) are estimated to have emigrated from
the Nooksack River in 2020 (Table 1). The 2020 estimate is based on a mark-recapture estimate of smolt
abundance from a smolt trap operated by the Lummi Tribe. Results were provided by the Lummi Tribe
(D. Flawd, Lummi Nation, personal communication).
Between the 2005 and 2020 ocean entry years, excluding 2018 when there was no smolt trap
estimate, coho smolt production in the Nooksack River averaged (geometric mean) 353,515 smolts
(Figure 9, range 97,615 to 1,348,442, numbers updated in 2020 by D. Flawd, Lummi Nation). An
additional number of coho (0.1% to 5% of the total yearling smolts) are estimated to emigrate as fry. Fry
estimates are not included in the forecast calculations because they represent a small proportion of the
outmigration and their survival likely to be substantially lower than that of the yearling smolts. The coho
smolt production estimate from the Nooksack River in 2020 was a 281% increase from the average
(geometric mean) for the time series and the highest smolt outmigration estimate of the time series.
2021 Wild Coho Forecasts for Puget Sound, Washington Coast, and Lower Columbia
WDFW Fish Science Division
13Figure 9. Time series of wild coho
smolts from the Nooksack River,
ocean entry years 2005 to 2020. No
estimate is available for 2018. Blue
point represents the cohort
contributing to this forecast. The
horizontal line is the geometric mean
of the time series. Data provided by D.
Flawd (Lummi Nation).
Strait of Georgia
A total of 16,000 coho smolts (rounded from 15,546) are estimated to have emigrated from Strait of
Georgia watersheds in 2020 (Table 1). Coho smolt abundance has not been measured in any of the
tributaries in this region and was estimated based on the potential predicted by Zillges (1977) and the
assumptions that this management unit experienced similar levels of smolt production that were
observed in multiple Puget Sound management units. The Strait of Georgia management unit is
comprised of small independent tributaries that drain into the Strait of Georgia near the U.S. – Canadian
border. There is no direct measure of coho smolt production in these tributaries. Previous forecasts for
the Strait of Georgia estimated that wild coho production was 20% to 50% of its potential. Measured
smolt production for watersheds in geographic proximity to the Strait of Georgia tributaries were slightly
higher (i.e., Skagit) than average in 2020. Therefore, the 2020 coho production was estimated to be
15,546 smolts, 30% of the total production potential for these watersheds (51,821 smolts per Zillges
1977).
Samish River
A total of 34,000 coho smolts are estimated to have emigrated from the Samish River in 2020 (Table
1). Coho smolt abundance has not been measured in the Samish River and was approximated using
recent adult escapement and an assumed marine survival rate.
In the last decade, marine survival of wild coho in Puget Sound has averaged 5.0% with an average
of 5.8% in the Baker River, which is the measure of wild coho marine survival in closest geographic
proximity to the Samish River. During this time period, natural coho returns to the Samish River have
averaged ~2,000 adults. Assuming a marine survival rate of 5.8%, an average of 34,000 smolts will result
in a return of 2,000 adult spawners. This estimate corresponds to 34 smolts/female (assume 1:1
male:female) and 20% of the potential production predicted by Zillges (1977), both reasonable values
when compared to other watersheds. The Zillges (1977) calculation includes a potential of 57,923 below
the hatchery rack and 111,566 above the hatchery rack (57,923+111,566 = 169,489).
2021 Wild Coho Forecasts for Puget Sound, Washington Coast, and Lower Columbia
WDFW Fish Science Division
14Lake Washington
A total of 49,000 coho smolts (rounded from 48,998) were estimated to have entered Puget Sound
from the Lake Washington basin in 2020 (Table 1). This estimate is based on measured smolt estimates
for two major tributaries to Lake Washington (Cedar River and Bear Creek), historical production data
for Issaquah Creek (2000 migration year), and an estimate of survival through Lake Washington. Juvenile
traps operated in each watershed were calibrated using recaptures of marked coho released above the
trap and a time-stratified Petersen estimator (Carlson et al. 1998; Volkhardt et al. 2007).
The potential coho production for the Lake Washington basin (768,740 smolts) predicted by Zillges
(1977) is unrealistically high for an urbanized watershed. In addition, this potential includes the lake as
a substantial portion of rearing habitat, an assumption that has not been supported by field surveys
(Seiler 1998). Therefore, basin-wide smolt abundance was estimated based on the three sub-basins –
Cedar River, Bear Creek, and Issaquah Creek – that represent the majority of coho spawning and rearing
habitat.
In 2020, coho smolt abundance from the Cedar River was estimated to be 45,132 (±23,875 95% C.I.)
smolts. This production was a decrease of 26% from the geometric mean of 61,213 smolts between the
1999 and 2020 ocean entry years (Figure 10). Coho smolts from Bear Creek were estimated to be 11,854
(±4,877 95% C.I.), a 52% decrease from the geometric mean of 24,634 smolts between the 1999 and
2020 ocean entry years (Figure 10). Between 1999 and present, the difference in the number of coho
smolts produced by the Cedar River and Bear Creek has increased. Smolt production appears to have
followed a similar trajectory (higher or lower years) in the two watersheds since 2006. Among the
potential reasons for the observed pattern is the use of newly colonized habitat on the Cedar River. A
fish passage facility at Landsburg Dam was completed in 2003 and provides coho with access to at least
12.5 miles of quality spawning and rearing habitat between Landsburg and Cedar Falls. Coho returns to
this portion of the watershed have increased over time, and natural productivity appears to be
contributing substantially to this trend (Anderson 2011).
Figure 10. Time series of natural-
origin coho smolts from Cedar River
(black) and Bear Creek (blue), ocean
entry years 1999 to 2020. Larger
symbol represents outmigration of
cohort contributing to this forecast.
Horizontal lines are the geometric
mean for the time series in each
watershed.
2021 Wild Coho Forecasts for Puget Sound, Washington Coast, and Lower Columbia
WDFW Fish Science Division
15Issaquah Creek in the Sammamish sub-basin is the other major coho producing watershed in the
Lake Washington management unit. Coho smolt production from Issaquah Creek was based on
monitoring data from the neighboring Bear Creek. Both watersheds flow into the northern extent of the
lake and are assumed to be influenced by returns of natural and hatchery coho and summer low flows.
The 2020 coho production from Issaquah Creek was estimated by scaling the 2000 estimate for this creek
(19,812 smolts; Seiler et al. 2002a) based on the 2020:2000 smolt ratio in Bear Creek. In 2020, coho smolt
production in Bear Creek was 42.1% of that measured in 2000 (11,854/28,142 = 0.421). Therefore, 2020
coho production from Issaquah Creek was estimated to be 8,345 smolts (19,812 * 0.421).
The total coho production of 48,998 assumed 75% survival through Lake Washington. A total of
65,331 coho smolts were estimated to enter Lake Washington (45,132 Cedar + 11,854 Bear + 8,345
Issaquah). The 75% survival rate was estimated from detections of Passive Integrated Transponder (PIT)
tags applied to coho smolts caught in the traps and redetected at the Ballard Locks from 2001 – 2011
(Pete Lisi, WDFW, unpubl. data). The true survival rate may be lower (e.g., Kiyohara and Zimmerman
2011; 2012), but no calibration of detection efficiency is currently available for these studies.
Green River
A total of 48,000 (rounded from 48,053) natural-origin coho smolts are estimated to have emigrated
from the Green River in 2020 (Table 1). This estimate is the sum of 30,480 smolts upstream of the juvenile
trap (river mile 34), 17,573 smolts below the juvenile trap, and zero smolts from Big Soos Creek.
In 2020, coho smolts emigrating from above river mile 34 were estimated with a rotary screw trap.
The juvenile trap was calibrated based on recapture rates of marked wild coho and abundance was
estimated using a time-stratified Petersen estimator (Carlson et al. 1998; Volkhardt et al. 2007).
Production above the trap was estimated to be 30,480 (±25,448 95% C.I.) smolts. This production was a
decrease of 43% from the geometric mean of 53,915 smolts between the 2000 and 2020 ocean entry
years (Figure 11).
Figure 11. Time series of natural-origin
coho smolts above the Green River
smolt trap (river mile 34), ocean entry
years 2000 to 2020. Blue point
represents cohort contributing to this
forecast. Horizontal line is the
geometric mean for the time series.
2021 Wild Coho Forecasts for Puget Sound, Washington Coast, and Lower Columbia
WDFW Fish Science Division
16Coho smolt production above the juvenile trap was 13.7% of the 223,106 smolt potential estimated
for this portion of the watershed (Zillges 1977). Coho rearing in the main stem and tributaries (except
Soos Creek) below the trap were estimated to be 17,573 smolts based 13.7% of the potential production
(128,630) predicted for this portion of the watershed.
Big Soos Creek is a low gradient tributary that enters the Green River downstream of the juvenile
trap. A juvenile trap was operated in Big Soos Creek by WDFW in 2000 and natural-origin coho smolts
were estimated to be 64,341 smolts in this year (Seiler et al. 2002b). The Big Soos Creek trap was not
operated during 2019-2020 and, because there are no immediate plans to operate this trap in the future,
Muckleshoot Indian Tribe developed a methodology to estimate smolt emigration based on the
historically available smolt production, female abundance, summer minimum flow, and winter maximum
flow data. For 2020, it is estimated that zero natural-origin coho smolts emigrated from Big Soos Creek
as no adults were passed above Soos Creek hatchery in 2018.
East Kitsap
A total of 92,000 coho smolts (rounded from 92,149) are estimated to have emigrated from East
Kitsap tributaries in 2020 (Table 1). In previous years, this estimate was based on an expansion of
measured production in Steele Creek, an East Kitsap tributary which was trapped between 2001 and
2010 by the Steele Creek Organization for Resource Enhancement). During these years, smolt abundance
from Steele Creek ranged between 1,040 and 2,958 wild coho smolts, representing 25% to 71% of the
4,140 smolt potential for this creek (Zillges 1977).
The Suquamish Tribe established a smolt monitoring study on Lost and Wildcat creeks in 2011 and
continued this work in 2020 (J. Oleyar, Suquamish Tribe, personal communication). Based on an updated
assessment of summer rearing habitat conducted by the Suquamish Tribe, the smolt potential above the
trap locations is 2,809 smolts on Lost Creek, 6,875 smolts on Wildcat Creek, and 155,269 smolts for the
entire management unit (J. Oleyar, Suquamish Tribe). This smolt potential was slightly higher than that
estimated by Zillges based on an increased length of summer rearing habitat in Lost Creek (1.7 to 1.9 as
determined by the Suquamish Tribe biologists).
The 2020 coho abundance of 5,747 smolts from Lost (n = 2,890) and Wildcat (n = 2,857) creeks was
59.3% of the calculated smolt potential. Total coho smolt abundance for the East Kitsap management
unit was estimated to be 92,149 smolts based on 59.3% of the 155,269 smolt potential for all watersheds
in this management unit.
Puyallup River
A total of 435,000 coho smolts (rounded from 435,119) are estimated to have emigrated from the
Puyallup River in 2020 (Table 1). This estimate is based on measured production in the Puyallup River
above the juvenile trap (102,520), estimated production from the White River (325,905), and an estimate
from the Puyallup River below the Puyallup-White confluence (6,694).
In 2020, the Puyallup Tribe operated a juvenile fish trap on the Puyallup River just upstream of the
confluence with the White River. A total of 102,520 coho smolts were estimated to have emigrated from
the Puyallup River above the smolt trap, including production above Electron Dam (Berger 2020; A.
2021 Wild Coho Forecasts for Puget Sound, Washington Coast, and Lower Columbia
WDFW Fish Science Division
17Berger, Puyallup Tribe, personal communication). This production represented an increase of 81% from
the average (geometric mean) of 56,761 smolts between the 2005 and 2020 ocean entry years and was
over double the smolt production estimated in this system each year since 2015 (Figure 12). Coho smolt
production above the juvenile trap represents 16.1% of the smolt potential for the watershed between
the Puyallup-White confluence and Electron dam (Zillges 1977). However, the actual rate is lower than
this percentage as the 2020 smolts had access to spawning and rearing habitat above Electron Dam
which was not accounted for in Zillges estimations. Coho in the Puyallup River have had access to the
upper Puyallup River since a fish ladder was installed at Electron Dam in 2000.
Figure 12. Time series of natural-origin
coho smolts above the Puyallup River
smolt trap (upstream of confluence
with White River), ocean entry years
2005 to 2020. Blue point represents
cohort included in this forecast.
Horizontal line is the geometric mean of
the time series. Data provided by A.
Berger (Puyallup Tribe).
A total of 325,905 coho smolts are estimated to have emigrated from the White River, including
production upstream of Mud Mountain Dam, in 2020. This estimate was derived from catch in a rotary
screw trap (n = 6,973) operated in the White River above the confluence with the Puyallup River and an
assumed 2.1% trap efficiency for coho smolts (A. Berger, Puyallup Tribe, personal communication). Trap
efficiency was not directly measured for coho smolts. Instead a value for steelhead smolts was used
(1.6% with an additional 0.5% added because coho are presumably easier to catch than steelhead due
to differences in size.
An additional 6,694 coho smolts were estimated to rear below the Puyallup and White confluence,
based on a rate of 10% of potential production applied to the 66,943 potential production of the lower
Puyallup (Zillges 1977). The total watershed production of 435,119 was the sum of coho smolt
production from the Puyallup River (102,520 above White River confluence), White River (325,905)
above confluence with Puyallup River), and Puyallup River (6,694 below White River confluence).
Nisqually River
A total of 79,000 coho smolts (rounded from 79,173) are estimated to have emigrated from the
Nisqually River in 2020 (Table 1). Smolt abundance was estimated above a main-stem trap (river mile
12) and expanded for non-trapped portions of the watershed. The main-stem trap was calibrated using
2021 Wild Coho Forecasts for Puget Sound, Washington Coast, and Lower Columbia
WDFW Fish Science Division
18recaptures of marked wild coho that are released upstream of the trap; a smolt abundance estimate was
based on a time-stratified Petersen estimator (Carlson et al. 1998; Volkhardt et al. 2007).
Smolt production above the trap (river mile 12) was estimated to be 62,153 (±8,490 95% C.I.) smolts.
This production represented a 46% decrease from the geometric mean of 115,683 smolts between the
2009 and 2020 ocean entry years (Figure 13). This estimate was 53.8% of the 115,554 smolt potential
predicted by Zillges (1977). Total smolts above and below the trap were estimated to be 79,173 assuming
that smolt production below the trap was also 53.8% of the 31,643 smolt potential predicted by Zillges
(1977) below the trap (= 62,153 + (31,643 * 0.538)).
Figure 13. Time series of natural-origin
coho smolts from the Nisqually River
above the smolt trap (rm 12), ocean
entry years 2009 to 2020. Blue point
represents outmigration of the cohort
included in this forecast. Horizontal
line is the geometric mean for the time
series.
Deschutes River
A total of 15,000 natural-origin coho smolts (rounded from 15,201) are estimated to have emigrated
from the Deschutes River in 2020 (Table 1). The 2020 production estimate was the second year since
1979 not based on smolts captured at a trap below Tumwater Falls. Instead, the estimate was calculated
by multiplying the number of adult females that returned to the trap in 2018 by an average (brood years
1983 through 2016) smolt-per-female production rate of 61.3 (248 * 61.3 = 15,201).
The 2020 production represents a decrease of 18% from the geometric mean of 18,521 smolts
between the 1979 and 2020 ocean entry years (Figure 14) and was just 6.9% (15,201/219,574) of the
smolt potential estimated by Zillges (1977). Production of coho smolts in the Deschutes River is
primarily limited by spawner escapement (Figure 15), which has been severely depressed over the past
two decades. Two of the three brood lines have been virtually extinct during this time frame. Efforts to
increase production in the Deschutes River watershed were initiated in 2013 by releasing hatchery
adults upstream in the fall and hatchery fry in the spring. For the 2016 brood, 697 females
(combination of natural-origin and hatchery-origin) were released upstream of Tumwater Falls to
spawn. Freshwater productivity from this spawner escapement was 23 smolts-per-female, much lower
than productivity expected from typical density-dependent freshwater relationships for coho salmon
(Figure 2).
2021 Wild Coho Forecasts for Puget Sound, Washington Coast, and Lower Columbia
WDFW Fish Science Division
19Figure 14. Time series of natural-origin coho
smolts from the Deschutes River, ocean
entry years 1979 to 2020. There was no
trapping in 2019 and 2020. Blue point
represents outmigration of cohort included
in this forecast. Horizontal line is the
geometric mean of the time series.
Figure 15. Coho smolt production as
a function of female spawners in
the Deschutes River, Washington,
brood year 1978-2016.
2021 Wild Coho Forecasts for Puget Sound, Washington Coast, and Lower Columbia
WDFW Fish Science Division
20South Sound
A total of 180,000 coho smolts (rounded from 180,348) are estimated to have emigrated from South
Sound tributaries in 2020 (Table 1). This estimate was based on results of smolt monitoring in Mill,
Skookum, Goldsborough, and Gosnell creeks conducted by the Squaxin Island Tribe (data provided by
Daniel Kuntz, Natural Resources Department, Squaxin Island Tribe). The wild coho smolt estimate for
Mill Creek was 1,536 smolts (0.3%). The smolt estimate for Skookum Creek was 519 (1.8%) and
Goldsborough Creek was 131,138 smolts (183.1%). Numbers in parentheses show the variable
proportion of the smolt potential observed in these tributaries (Zillges 1977). Gosnell Creek is the upper
extent of Mill Creek above Lake Isabella and produced 3,781 smolts or 26.0% of the production potential
for this portion of the Mill Creek watershed. Localized conditions among small creeks, such as the Sound
Sound tributaries, can lead to among-watershed variability that is dampened in large river systems. This
variability makes extrapolation monitoring results from a few small creeks to a management unit more
uncertain, especially because the creeks are not selected randomly for monitoring.
In general, South Sound tributaries are influenced by a combination of factors including low spawner
returns to South Sound (as observed in the Deschutes River) and degraded habitat conditions in this
region. Throughout the time series of smolt data collected by the Squaxin Tribe, Goldsborough Creek
has consistently produced a higher proportion of its production potential than the other six monitored
tributaries and is unlikely to represent current conditions in many of the small creeks in this management
unit. Therefore, the 2020 coho production for the South Sound management unit was estimated in two
steps – smolt estimate for Goldsborough Creek (131,138) was added to an extrapolated estimate for all
other tributaries in this management unit. The extrapolated estimate for other tributaries (not including
Goldsborough Creek) was 49,210, which was 9.8% applied to the Zillges production potential of 502,142
smolts for these watersheds. The rate of 9.8% represents the 2020 proportion of the overall production
potential observed in Skookum Creek and Gosnell Creek (used instead of Mill Creek). Coho production
for the entire South Sound management unit was estimated to be 180,348 smolts (= 49,210 + 131,138),
which is 31.4% of the 573,770 smolt potential for all watersheds in this management unit (including
production above Minter hatchery rack) predicted by Zillges (1977).
2021 Wild Coho Forecasts for Puget Sound, Washington Coast, and Lower Columbia
WDFW Fish Science Division
21Coastal Systems Smolt Abundance
Approach
Major coho producing basins in Coastal Washington range in watershed characteristics and
hydrology. On the north coast, the rivers drain westward from the Olympic Mountains and are higher
gradient with a transitional hydrology influenced by both winter rains and spring snow melt. In the
southwest coast, rivers are low gradient with rain-fed rivers that drain into Grays Harbor and Willapa
Bay. Additional independent tributaries lack the complexity of the larger watersheds and have primarily
rain-driven hydrology. Where juvenile trapping studies have been conducted, smolt production has
averaged 400 to 1,000 smolts per unit (mi2) of drainage area (Table 3). Smolt densities in low-gradient
watersheds, such as the Chehalis (Grays Harbor) or Dickey (tributary to the Quillayute) rivers, are
typically higher than high-gradient watersheds, such as the Clearwater (Queets tributary) or Bogachiel
(Quillayute tributary) rivers.
In 2020, WDFW estimated wild coho smolt abundance in the Chehalis River using a predictive
relationship between stream flows and smolts (Grays Harbor management unit). Smolt abundance in
the Queets River management unit was available due to a juvenile monitoring program conducted by
the Quinault Division of Natural Resources. Historical smolt abundance data is also available from the
Dickey and Bogachiel rivers in the Quillayute watershed. In coastal watersheds where smolt monitoring
did not occur in 2020, wild coho smolt abundance was estimated by applying a smolt density (smolts/mi2)
from monitored watersheds to the non-monitored watersheds (drainage areas provided in Appendix B).
Among the factors considered when applying a smolt density to each watershed were baseline data
(historical smolt estimates), watershed geomorphology (i.e., gradient), harvest impacts, and habitat
condition.
Table 3. Wild coho smolt production and production per unit drainage area (smolts/mi2) measured for coastal
Washington watersheds. Clearwater and Queets river data were provided by the Quinault Nation (T. Jurasin).
Average values are arithmetic means.
Coho smolt production Production/mi2
Number
Watershed of years Average Low High Average Low High
Dickey (Quillayute) 3 71,189 61,717 77,554 818 709 891
Bogachiel (Quillayute) 3 53,751 48,962 61,580 417 380 477
Clearwater (Queets) 39 69,217 27,314 134,052 494 195 958
Queets (no Clearwater) 37 191,431 53,473 352,694 618 172 1,138
Chehalis (Grays Harbor)a 36 2,151,113 502,918 3,769,789 1,018 238 1,783
a
Data summary excludes 1993 and 2015 outmigration when tag recoveries were too few to provide a reliable estimate.
2021 Wild Coho Forecasts for Puget Sound, Washington Coast, and Lower Columbia
WDFW Fish Science Division
22Queets River
A total of 162,000 (rounded from 161,650) wild coho smolts are estimated to have emigrated from
the entire Queets River watershed in 2020 (Table 1). This estimate was based on coho smolt data
collected and analyzed by the Quinault Tribe (Tyler Jurasin, Quinault Division of Natural Resources,
personal communication) and includes smolts from the Clearwater River. Smolt abundance from the
Clearwater River alone was estimated to be 44,092 wild coho smolts (315 smolts/mi2). Smolt
abundance from the Queets River (without the Clearwater) was estimated to be 117,558 wild coho
smolts (379 smolts/mi2).
Quillayute River
A total of 221,000 coho smolts (rounded from 220,894) are estimated to have emigrated from the
Quillayute River system in 2020 (Table 1). This estimate is based on historical measures of smolt
abundance in two sub-basins of the Quillayute River and a current year-to-historical smolt abundance
ratio in the Clearwater River (Queets management unit), where smolt abundance was measured in 2020.
In the Quillayute watershed, smolt production was measured historically in the Bogachiel and Dickey
rivers. Coho smolt abundance above the Dickey River trap averaged 71,189 coho (818 smolts/mi2)
between 1992 and 1994. Coho smolt abundance in the Bogachiel River averaged 53,751 smolts (417
smolts/mi2) over three years (1987, 1988, and 1990). The difference in smolt densities between
watersheds was hypothesized to result from additional rearing habitat in the lower gradient Dickey River
when compared to the Bogachiel River (Seiler 1996). This interpretation is further supported by the
relatively high smolt densities observed in other low-gradient systems such as the Chehalis River (Table
3) and Cedar Creek (NF Lewis River, Figure 16). Lower gradient topography may increase access to and
availability of summer and winter rearing habitats (Sharma and Hilborn 2001).
During the period of historical monitoring in the Dickey and Bogachiel rivers, average wild coho smolt
abundance was estimated to be 306,000 smolts for the entire Quillayute watershed (Seiler 1996). The
watershed average was based on estimated production above and below the Dickey River smolt trap
summed with coho smolts in the remainder of the basin. Average production for the entire Dickey River
sub-basin was estimated by applying smolt densities above the trap (818 smolts/mi2) to the total
drainage area (108 mi2), resulting in 88,344 smolts. Average smolt abundance for the Quillayute system
outside the Dickey River was estimated by applying the smolt densities above the Bogachiel trap (417
smolts/mi2) to the 521 mi2 of the Quillayute watershed (excluding the Dickey River sub-basin), resulting
in 217,257 smolts. The sum of these estimates is 306,000 smolts.
The 2020 Quillayute coho production was based on previously measured smolt abundance adjusted
by the ratio of current year to previously measured smolt abundance in the Clearwater River. An
expansion factor of 0.72 was the ratio of Clearwater River production in 2020 (44,092) to average
Clearwater River production in 1992-1994 (44,092/61,000 = 0.72). Because historical smolt densities
differed between the Dickey and Bogachiel rivers, separate estimates were developed for two portions
of the Quillayute River watershed. The 2020 coho smolt abundance in the Dickey River was estimated to
be 63,857 smolts (0.72*88,344 smolts). The 2020 coho smolt abundance in the Quillayute (excluding the
2021 Wild Coho Forecasts for Puget Sound, Washington Coast, and Lower Columbia
WDFW Fish Science Division
23Dickey) was estimated to be 157,038 smolts (0.72*217,257 smolts). The total 2020 coho production of
221,000 smolts was the rounded sum of these estimates (63,857 + 157,038 = 220,894).
Hoh River
A total of 94,000 wild coho smolts are estimated to have emigrated from the Hoh River in 2020 (Table
1). Smolt abundance was not directly measured in the Hoh River watershed; therefore, the estimate was
based on smolt densities in the Clearwater River. The Hoh and Clearwater rivers have similar watershed
characteristics as well as regional proximity. The smolt density of 315 smolts/mi2 from the Clearwater
River was applied to the 299-mi2 of the Hoh watershed and resulted in an estimated 94,000 smolts
(rounded from 94,185) from the Hoh River system.
Quinault River
A total of 164,000 wild coho smolts are estimated to have emigrated from the Quinault River in 2020
(Table 1). Smolt abundance was not directly measured in this watershed; therefore, the estimate was
based on smolt densities in the Queets River system. For 2020, a production rate of 379 smolts/mi2 was
applied to the 434-mi2 Quinault River system, resulting in an estimated 164,000 smolts (rounded from
164,486).
Independent Tributaries
A total of 148,000 wild coho smolts are estimated to have emigrated from the independent
tributaries of Coastal Washington in 2020 (Table 1). Coho smolt production has not been directly
measured in any of the coastal tributaries. For 2020, an average production rate of 350 smolts/mi2 was
applied to the total area of these watersheds (424 mi2; Appendix B), resulting in an estimated 148,000
smolts (rounded from 148,400).
Grays Harbor
A total of 2,583,000 (rounded from 2,582,733) wild coho smolts are predicted to have emigrated
from the Grays Harbor system in 2020 (Table 1). This estimate was derived in two steps. Wild coho
production was first estimated for the Chehalis River (n = 2,141,065). Smolt abundance per unit
watershed area of the Chehalis River system was then applied to the Grays Harbor tributaries (n =
188,418, Hoquaim, Johns, and Elk rivers) and the Humptulips River (n = 253,250).
Coho smolt abundance in the Chehalis River is estimated using a mark-recapture method. Smolts are
coded-wire tagged and released from a juvenile trap on the Chehalis main stem (RM 52) and Bingham
Creek (right bank tributary to the East Fork Satsop River at RM 17.4). These tag groups are expanded to
a basin-wide smolt abundance based on the recaptures of tagged and untagged wild coho in the Grays
Harbor terminal net fishery. Coded-wire tag recoveries in this fishery are processed and reported by the
Quinault Tribe (Jim Jorgenson, Quinault Division of Natural Resources, personal communication). Smolt
abundance is estimated after adults have passed through the fishery and returned to the river.
Smolt abundance estimates from the mark-recapture method are not available in the year that coho
recruit into the fishery; therefore, the run size forecasts are based on a modeled smolt estimate. In
2021 Wild Coho Forecasts for Puget Sound, Washington Coast, and Lower Columbia
WDFW Fish Science Division
24previous forecasts, predictive models have been explored flow metrics associated with spawning,
incubation, and rearing flows (Seiler 2005; Zimmerman 2015). These relationships are biologically
relevant, but their stability has depended on the time period used for analysis. The current predictive
model includes metrics of summer and overwinter rearing flows (Figure 16). Although incubation flows
are also correlated with smolt production, including this variable does not improve model fit and
therefore incubation flows were not used in the predictive model. For the 2019 ocean entry year (2020
return), this model predicted a smolt abundance of 2,053,869 (1,807,605 – 2,333,683, 95% C.I.) which
was higher than the mark-recapture estimate of 1,516,207 (1,178,576 – 1,853,837, 95% C.I.).
In the 2020 ocean entry year, coho smolts were associated with average incubation flows, lower than
average summer flows, and average overwinter flows as measured at USGS gage #12027500, Grand
Mound (Figure 16). The 2020 smolt production was predicted to be 2,141,065 (1,932,132 – 2,372,592,
95% C.I.) based on the multiple regression model including summer and overwinter flows. This prediction
is 0.5% lower than the time series average of 2,151,113 wild coho smolts.
Figure 16. Chehalis River wild coho smolt production as a function of incubation flows (a), summer rearing
flows (b), and overwinter rearing flows (c) for ocean entry year 2001-2020 as measured at USGS gage
#12027500 in Grand Mound. Incubation flows are the cumulative daily mean flow between December 1 and
March 1. Summer rearing flows are maximum daily flows in the month of August. Overwinter rearing flows are
minimum daily flows between November 1 and February 28. Three data points were removed (OEY 2004, 2006,
and 2015) because of high leverage on the regressions. Vertical blue dashed line indicates the conditions
associated with the 2020 ocean entry year.
Coho smolt abundances in other portions of the Grays Harbor management unit were estimated
from the smolt densities for the Chehalis River basin. Abundance per unit area for the Chehalis basin
including the Wishkah River was 1,013 smolts/mi2 (2,141,065 smolts per 2,114 mi2). A total of 188,418
coho smolts are estimated for the tributaries of Grays Harbor (1,013 smolts/mi2*186 mi2, including the
Hoquiam, Johns, and Elk Rivers and other south side tributaries downstream of the terminal treaty net
fishery). Coho smolt abundance from the Humptulips River was estimated to be 253,250 smolts (1,013
smolts/mi2*250 mi2). After summing smolt abundance estimates for all watersheds in the Grays Harbor
2021 Wild Coho Forecasts for Puget Sound, Washington Coast, and Lower Columbia
WDFW Fish Science Division
25You can also read