Supply and Demand of Lithium and Gallium - Information Center of Ministry of Land and Resources - Bund.de
←
→
Page content transcription
If your browser does not render page correctly, please read the page content below
Information Center
            of Ministry of Land
            and Resources

Supply and Demand of
Lithium and Gallium
Imprint
Authors:         Cui Rongguo, Guo Juan, Yin Liwen (ICMLR)
                 Dieter Huy, Maren Liedtke (BGR)

Contact:         Information Center of Ministry of Land and Resources (ICMLR)
                 No. 64, Funeidajie Street
                 100812 Bejing
                 rgcui@infomail.mlr.gov.cn

                 Federal Institute for Geosciences and Natural Resources
                 Stilleweg 2
                 30655 Hannover
                 dieter.huy@bgr.de

Layout:          Jolante Duba

Edition dated:   May 2016

ISBN:            978-3-943566-33-8

Titelbild:       BGR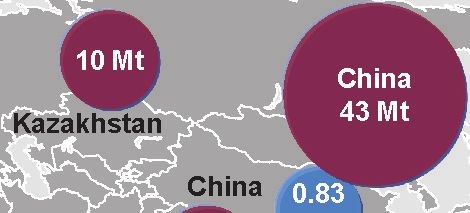
Supply and Demand of
Lithium and Gallium
May 2016

Supply and Demand of Lithium and Gallium
                                                                                               5

Content
Supply and Demand of Lithium                                                              9

1 Introduction                                                                            10

2 Distribution of lithium reserves and resources                                         10
  2.1 Reserves and resources                                                              10

  2.2 Changes of reserves and resources                                                   12
  2.3 Regional distribution of reserves and resources                                     13

  2.4 Reserves and resources in China                                                     14

3 Lithium production                                                                      14
  3.1 Changes of lithium production                                                       14
  3.2 Regional distribution of lithium production                                         14
  3.3 Major lithium producers                                                             15
  3.4 Lithium production in China                                                         16

4 Lithium supply and consumption                                                          17

  4.1 Lithium consumption                                                                 17
  4.2 Lithium consumption markets                                                         17

  4.3 Trade                                                                               18
  4.4 Lithium consumption in China                                                        19
  4.5 Lithium price                                                                       21

5 Outlook for lithium supply and demand                                                  21
  5.1 Outlook for lithium demand                                                          21
  5.2 Outlook for lithium supply capacity                                                 24
  5.3 China lithium supply capacity                                                       25

6 Conclusions                                                                            25
  6.1 Lithium reserves and resources abundant across the world                            25
  6.2 The supply of global lithium highly concentrated                                    25
  6.3 The demand for global lithium strongly in future                                    25
  6.4 The potential of China’s lithium resources                                          26
  6.5 Outlook                                                                             26

7 References                                                                             26
Supply and Demand of Lithium and Gallium
6
Supply and Demand of Gallium 27
8 Introduction 28
9 Uses 28
10 Occurrence and resources 29
11 Production 30
11.1 Primary production 30
11.2 Secondary production 33
11.3 Refinery production 33
12 Gallium producers by country 33
13 Demand 39
14 Prices 42
15 Trade 43
16 Outlook for gallium supply and demand 45
17 Summary and conclusions 46
18 References 45Lithium and Gallium Supply and Demand
7
Preface
On 19 June 1979, the former State Bureau of Geology, now Ministry of Land and Resources of the People’s
Republic of China and the Federal Ministry of Economics, now Federal Ministry for Economic Affairs and
Energy of the Federal Republic of Germany signed an agreement on a scientific cooperation on geological
sciences and techniques.
Main objectives are:
• to cooperate in geoscientific exchange and research in fields of common interest,
• to develop geoscientific knowledge and techniques,
• to strengthen the basis of economic, technical and industrial cooperation among the two economies.
Topics of interest:
• coal (deposits, exploration, coal fires)
• hydrocarbons (geology, laboratory)
• ore deposits of metals and industrial minerals
• engineering and environmental geology
• marine geology
• hydrogeology
• tectonics, geophysics
• geological data bases
• mineral commodities and statistics.
This study on Lithium and Gallium supply and demand falls into the last category and was compiled by
the Information Center of the Ministry of Land and Resources of the People’s Republic of China (ICMLR)
and the Federal Institute for Geosciences and Natural Resources (BGR) of Germany.
The study was presented in October 2015 on the China Mining Congress and Expo 2015 in Tianjin.Supply and Demand of Lithium and Gallium 8
Supply and Demand of Lithium

Cui Rongguo, Guo Juan,Yin Liwen
Supply and Demand of Lithium and Gallium
10

     1 Introduction
     Throughout the last five decades, the application of lithium can be seen in many traditional industries such
     as glass and ceramics, metallurgy of non-ferrous metals, air treatment, medicine and organic synthesis,
     making lithium to the traditional industries as what seasoning is to cuisines. The rapid development of
     information technology and the electric automobiles in recent years has made lithium battery one of the
     most robustly growing industries. Consequently, lithium has become an ideal material for light alloy and
     energy resource of 21th century.

     Statistics from the United States Geological Survey (USGS) , the lithium consumption end-use markets
     in 2013 as follows: glass and ceramics industries, 35 %; battery production, 31 %; lubricating greases,
     8 %; continuous casting mold flux powders, 6 %; air treatment, 5 %; polymer production, 5 %; primary
     aluminum production, 1 %; disposable battery production, 2 % and other uses, 9 %. From 2007 to 2013,
     lithium consumption experienced a somewhat rapid growth in glass and ceramics industry and battery
     industry (Table 1).

     Table 1: World: Lithium Consumption End-use markets

      Consumption                  2007        2008       2009        2010        2011       2012        2013

      Glass and ceramics           20 %        18 %       31 %        31 %        29 %       26 %        35 %
      Batteries                    20 %        25 %       23 %        23 %        29 %       35 %        31 %
      Lubricating greases          16 %        12 %       10 %         9%         14 %       13 %         8%
      Continuous casting                       3%          4%          4%         5%          8%          6%
      Air treatment                8%          6%          5%          6%         4%          4%          5%
      Primary aluminum pro-        6%          4%          3%          6%         4%                      1%
      duction
      Polymers, rubber, etc.                                           4%         3%          3%          5%
                                   9%          7%
      Pharmaceuticals                                                  2%         3%          3%
      Others                       21 %        25 %       24 %        15 %        9%          8%          9%
     Source: USGS (2015)

     2 Distribution of lithium reserves and resources
     2.1 Reserves and resources
     Across the globe, lithium can be found mainly in pegmatite type deposit and brine deposit, with lithium-bea-
     ring brine resources accounting for a large part of the resources. The pegmatite type deposits are mainly in
     Australia, Canada, Finland, China, Zimbabwe, South Africa and Congo. Meanwhile, lithium-bearing saline
     lakes mainly are located in the following countries: Bolivia, Chile, Argentina, China, and the United States.

     Statistics from USGS shows that in 2014, worldwide lithium reserves total 13.5 million tons which allow
     the global lithium production to last for more than 360 years with an annual lithium output of 37,000 tons.
     Among all the countries, Chile tops the list with a reserve volume of 7.5 million tons, followed by China
     (3.5 million tons), Australia (1.5 million tons) and Argentina (850,000 tons) (Table 2). Statistics vary by
Supply and Demand of Lithium and Gallium
11
different organizations. SNL MEG in 2013 reported that the total lithium reserves on earth added up to
around 23.4 million tons, with which the lithium production can last 640 years with an annual production
output of 37,000 tons. Meanwhile, in the same year, Roskill reported the total lithium reserved to be on
the order of 20.8 million tons.
Table 2: World: Lithium reserves (thousand tons, lithium content)
SNL,2013
Lithium Lithium Ex- Total
Country Extracted tracted From Roskill, 2013 USGS, 2014
From saline-lake
minerals
Chile 7,500 7,500 7,300 7,500
Bolivia 5,500 5,500 5,500
China 750 2,750 2,750 3,900 3,500
Argentina 2,550 2,550 2,700 850
Australia 970 970 505 1,500
Serbia 850 850
Congo (DR) 1,000* 1,000* 310
Russia 1,000* 1,000*
Canada 256 108 364 204
Austria 100 100
Brazil 46 46 50 48
United States 38 38 169 38
Zimbabwe 23 23 25 23
Finland 14 14 6
Portugal 10 10 10 60
Afghanistan 150
World Total 5,069 18,338 23,407 20,080* 13,500
* estimate
Source: SNL (2014), ROSKILL (2013), USGS (2015)
In 2014, USGS estimated that the global lithium resources totaled 39.5 million tons. Bolivia ranks the first
with 9 million tons of resources, followed by Chile (7.5 million tons), Argentina (6.5 million tons), United
States (5.5 million tons), China (5.4 million tons) and Australia (1.7 million tons) (Table 3). SNL MEG (2013)
reported similar result estimating the lithium resources add up to 39.15 million tons.Supply and Demand of Lithium and Gallium
12
Table 3: World: Lithium resources (thousand tons, lithium content)
Country USGS, 2014 SNL, 2013
Chile 7,500 7,500
Bolivia 9,000 9,000
China 5,400 5,400
Argentina 6,500 6,500
Australia 1,700 1,700
Serbia 1,000 1,000*
Congo (DR) 1,000 1,000*
Russia 1,000 1,000*
Canada 1,000 364
Austria 100
Brazil 180 64
United States 5,500 5,500
Zimbabwe 57
Finland 14
Portugal 60
World Total 39,500 39,151
* estimate
Source: USGS (2015), SNL (2014)
2.2 Changes of reserves and resources
In recent years, an increasing number of projects prospecting and developing lithium resources have
been carried out across the world, leading to the discoveries of lithium deposits and an increase of lithi-
um reserves and resources. According to USGS, the global lithium resources have increased 14 million
tons from 25.5 million tons in 2009 to 39.5 million tons in 2014, a 54.9 % increase in five years. During
the five years, the global lithium reserves climbed from 9.9 million tons to 13.5 million tons, 36.4 % up.
China and Australia are front runners in the growth of reserves with a 1.6 fold growth and 5.5 fold growth
respectively (Table 4).
Table 4: World: Changes in lithium reserves (thousand tons, lithium content)
Country
2009 2010 2011 2012 2013 2014
or region
Argentina 800 850 850 850 850 850
Australia 580 580 970 1,000 1,000 1,500
Brazil 190 64 640 46 46 48
Chile 7,500 7,500 7,500 7,500 7,500 7,500
United States 38 38 38 38 38 38Supply and Demand of Lithium and Gallium
13
Country
2009 2010 2011 2012 2013 2014
or region
Canada 180
China 540 3,500 3,500 3,500 3,500 3,500
Portugal 10 10 10 10 60 60
Zimbabwe 23 23 23 23 23 23
World total 9,900 13,000 13,000 13,000 13,000 13,500
Source: USGS (2015)
2.3 Regional distribution of reserves and resources
Around 70 % of lithium is consentrated in “the lithium triangle”. In terms of lithium reserves, Chile, rich
in saline lake lithium reserves that accounts for almost one third of the global volume, ranking the first.
Bolivia, making up 24 % of the total, comes next, followed by China with 3.5 million tons of lithium reser-
ves. Argentina, whose saline lake lithium reserves make up 11 %, ranking the fourth. As for the lithium
resources, 59 % of the reserves located in “the lithium triangle” countries (Chile, Bolivia and Argentina)
with 14 % in China, and another 14 % in the United States (Figure 1).
Serbia 4 % Canada 1 % Russia 3 % Serbia 3 %
Others 1 % Others 1 %
Australia 4 % Congo (DR)
Russia 4 % 2%
Australia 4%
Congo (DR)
4% Bolivia
Chile 23 %
32 % China
Argentina 14 %
11 %
Chile
USA 19 %
China 14 %
15 % Bolivia Argentina
24 % 17 %
Reserves Resources
Figure 1: Regional distribution of lithium reserves and resources, 2013Supply and Demand of Lithium and Gallium
14
2.4 Reserves and resources in China
According to Ministry of Land and Resources, P.R.C., in 2014, Li2O reserves in China added up to 420,000
tons, and the reserves and resources totaled 2.94 million tons, mainly located in Sichuan, Jiangxi, Hunan
and Xinjiang. LiCl reserves totaled 3.75 million tons, and the reserves and resources reached 19.07 million
tons, which are concentrated in Qinghai, Hubei, Sichuan, Xinjiang and Tibet. Spodumene reserves in
China totaled 27,000 tons, and the reserves and resources totaled 87,000 tons, located in Jiangxi, Xinjiang
and Sichuan. Lepidolite reserves amounted to 10,000 tons, and the reserves and resources amounted to
10,000 tons, which are mainly located in Jiangxi.
3 Lithium production
3.1 Changes of lithium production
The lithium production around the world has been on the increase from 2004 to 2013, discounting a fall in
2009. In 2013, the global mine production reached 37,000 tons (Li), or 197,000 tons of lithium carbonate,
a 3.5 % year-on-year increase (see Figure 2).
40,000
35,000
30,000
25,000
Lithium [t]
20,000
15,000
10,000
5,000
0
2004 2005 2006 2007 2008 2009 2010 2011 2012 2013
Source: USGS (2015)
Figure 2: Global lithium production
3.2 Regional distribution of lithium production
Global lithium productions are mainly concentrated in Chile, Argentina, Australia and China. In 2013,
the lithium production of the four countries totaled 27,000 tons (Li), accounting for 76.9 % of the global
production (Table 5).Supply and Demand of Lithium and Gallium
15
Table 5: World: Lithium minerals and brines production
Lithium mine-
Country 2008 2009 2010 2011 2012 2013
ral products
Argentina Lithium 10,000 8,574 11,178 10,000 9,700 9,500
carbonate
Lithium 7,800 4,279 6,644 4,480 4,350 4,200
chloride
Total (lithium) 3,170 2,309 3,184 2,610 2,533 2,471
Australia Spodumene 239,528 197,482 295,000 421,396 456,921 421,000
Total (lithium) 6,280 4,400 9,260 12,500 12,800 12,700
Brazil Concentrate 14,460 15,929 15,733 7,820 7,084 8,000
Lithium 160 160 160 320 150 400
Canada Spodumene* 22,000 10,000 – – – –
Total (lithium) 690 480 20,00*
Chile Lithium 48,469 25,154 44,025 59,933 62,002 52,358
carbonate
Lithium 4,362 2,397 3,725 3,864 4,145 4,091
chloride
Lithium 4,050 2,987 5,101 5,800 5,447 4,197
hydroxide
Total (lithium) 10,600 5,620 10,510 12,900 13,200 11,200
China Lithium 17,500 20,000 21,000 22,000 24,000 25,000
carbonate
Total (lithium) 3,290 3,760 3,950 4,140 4,500 4,700
Portugal Lepidolite 34,888 37,359 40,109 37,534 20,698 38,000
Total (lithium) 570 – 800 820 560 570
Zimbabwe Petalite, 50,000 50,000 47,000 48,000 53,000 50,000
spodumene
Total (lithium) 400 400 470 470 1,060 1,000
World Lithium 25,160 17,809 28,334 33,760 34,803 35,041
* estimate
Source: USGS (2015), USGS (2013), Jaskula (2015)
3.3 Major lithium producers
In terms to the global lithium carbonate distribution and production capacity, SQM, Talison Inc.(51 % of
whose share is held by Tianqi Lithium Inc.), Rockwood Corp. and FMC are major producers, contributing
to over 80 % of the global volume. The next two years will witness a steady growth of lithium production
capacity of the world’s lithium as they start new projects and continue to work on the projects in progress.
As for the production of lithium carbonate, SQM and FMC have an annual growth rate of nearly 10 %.
Rockwood, 25 %. The two-stage capacity expansion of Greenbush’s chemical plants made it possible for
Talison to achieve a capacity of around 740,000 tons of lithium concentrate (equivalent to 110,000 tons of
lithium carbonate equivalent) in 2012.Supply and Demand of Lithium and Gallium
16
Nearly 70 % of the global lithium mineralss in 2013 is supplied by Galaxy Resources and Talison, which
accounted for 65 % of the global volume. Meanwhile, as high as 92 % of the supply of saline lake lithium
is provide by SQM, Rockwood and FMC. As a result, lithium giants across the world have a monopoly on
the supply of lithium (Figure 3).
Zimbabwe Canada
4% 4%
Galaxy Resource China
4% 8%
FMC SQM
China 22 % 42%
23 %
Talison
65 %
Rockwood
28%
Lithium Minerals Lithium brines
Source: Summary of reports of companies in 2013
Figure 3: Global supply of lithium minerals and brines, 2013
3.4 Lithium production in China
Despite the fact that China is the third lithium-richest country, China lithium production accounts for mere
5 % of the global. However, the production of both lithium brines and minerals has been on the growth in
recent years (Table 6). 80 % of lithium is from minerals.
Table 6: China: Production of lithium (Gross weight, metric tons)
Brines (Li2CO3) Minerals Total Prod. (LCE)*
2003 – 35,000 4,328
2004 100 36,000 4,551
2005 200 37,000 4,775
2006 300 37,000 4,875
2007 500 38,000 5,199
2008 2,500 40,000 7,446
2009 7,000 62,000 14,666
2010 5,500 81,000 15,516
2011 5,000 91,000 16,252
2012 4,000 100,000 16,365
* Based on an average Li2O content of 5.0 % in lithium minerals produced
Source: BGS, ROSKILL (2013)Supply and Demand of Lithium and Gallium
17
4 Lithium supply and consumption
4.1 Lithium consumption
Lithium consumption across the world totaled 132,000 tons LCE in 2011. In 2012, driven by the develop-
ment in lithium-ion battery industry, the demand for lithium increased significantly to 147,000 tons, a year-
on-year increase of 11.4 %. In 2013, the growth of global lithium consumption continued, with the global
consumption reaching 160,000 tons, a year-on-year increase of 8.8 % (Table 7).
Table 7: World: Lithium consumption
– 2010 2011 2012 2013 2014*
Consumption 113,000 132,000 147,000 160,000 162,000
* estimate
Source: Antaike
4.2 Lithium consumption markets
The battery industry is the biggest driver for the global lithium consumption, accounting for 31 % of the
total consumption in 2013, followed by glass and ceramics and lubricating greases (Figure 4). Lithium
consumption maintained a 6 % annual growth rate from 2000 to 2013.
Others
20 %
Batteries
Lithium alloy 31 %
3%
Air treatment
4%
Pharmaceuticals
5%
Primary aluminum production Lubricating greases
6% 12 %
Polymer production Ceramics and glass
9% 10 %
Figure 4: Global lithium consumption in 2013Supply and Demand of Lithium and Gallium
18
4.3 Trade
The international lithium trade dominates in lithium carbonate. In 2012, global lithium export reached
79,064 tons LCE. Chile and Argentina have limited demand for lithium carbonate but they have been
major exporters of lithium carbonate. Lithium carbonate export from these two countries accounted for
over 80 % of the world (Table 8).
Table 8: World: Total exports of lithium carbonate (Gross weight, metric tons)
2005 2006 2007 2008 2009 2010 2011 2012
Chile 41,832 38,682 41,125 42,586 22,443 40,896 48,248 55,899
Argentina 7,300 8,028 7,794 10,755 8,578 11,296 9,898 9,399
Belgium 5,017 4,962 4,873 3,531 3,028 4,455 4,467 5,022
China 1,366 3,174 3,,107 2,,490 2,000 2,655 5,362 2,973
United
5,282 4,336 4,211 4,592 1,915 2,277 2,120 2,073
States
Germany 2,991 2907 2,705 2,290 1,881 2,556 2,921 2,258
Other 3,426 6,534 1,646 1,905 1,531 1,762 1,994 1,440
Total 67,214 68,623 65,461 68,149 41,377 65,898 75,010 79,064
Source: GTIS (2015)
Global imports of lithium carbonate reached 80,623 tons in 2012. There are more than 9 countries impor-
ted more than 2000 tons (Table 9).
Table 9: World: Total imports of lithium carbonate (Gross weight, metric tons)
2005 2006 2007 2008 2009 2010 2011 2012
Japan 10,001 14,521 13,553 13,194 8,023 14,029 15,089 12,753
United
19,340 16,068 15,547 15,775 9,263 9,495 14,465 13,232
States
Korea 2,335 2,540 3,855 5,247 5,142 7,987 11,425 13,762
China 8,572 6,365 3,832 4,306 2,389 6,398 8,250 13,622
Belgium 6,320 5,342 5,891 4,410 3,410 4,181 7,768 7,204
Germany 8,097 7,908 8,131 7,142 4,493 6,795 5,738 6,058
Spain 1,553 828 1,819 3,994 2,825 3,239 3,338 2,476
France 1,439 1,227 1,290 1,251 1,172 1,137 2,792 1,756
Russia 2,955 938 873 891 545 696 2,110 2,200
Other 8,732 9,239 10,243 10,150 7,030 8,182 9,287 7,560
Total 69,344 64,976 65,034 66,360 44,292 62,139 80,262 80,623
Source: GTIS (2015)
Spodumene concentrate is predominantly exported from Australian to China, Belgium, Germany and
the United States. Meanwhile, petalite concentrate produced in Zimbabwe is exported mainly to South
Africa, and the products are sold mainly to Asia and Europe. Lithium minerals from Protugal and BrazilSupply and Demand of Lithium and Gallium
19
is mainly exported to China and Spain, respectively (Table 10). Trade in lithium brine is much less, and
SQM, the main exporter in Chile, exprots lithium chloride brine to Ganfeng Lithium of China with limited
quantity (Table 11).
Table 10: World: Lithium minerals export (Gross weight, metric tons)
2005 2006 2007 2008 2009 2010 2011 2012
Australia 14,5472 435,689 243,662 236,441 225,761 324,115 402,688 514,620
Zimbabwe 17,805 236,80 26,769 26,424 35,783 41,015 35,453 38,398
Portugal 120 625 612 372 82 1,401 712 600
Brazil 211 150 30 28 7
Source: GTIS (2015)
Table 11: Chile: Exports of lithium chloride brine from SQM to China (Gross weight, metric tons)
2005 2006 2007 2008 2009 2010 2011 2012
Net weight – – 2,260 6,638 8,129 9,220 16,534 16,800
LiCl/ % – – 33 33 33 33 33 33
Lithium
– – 746 2,190 2,683 3,043 4,752 4,828
chloride
Source: GTIS (2015)
4.4 Lithium consumption in China
China Lithium Association estimates that China has consumed 35,800 tons of LCE in 2010, a year-on-year
growth of 44 %. In 2012, the rapid development of small lithium ion battery industry drove the total lithium
consumption to 55,000 tons of LCE, a 49.4 % year-on-year increase. In 2013, lithium consumption goes
up to 63,000 tons of LCE, accounting for 39 % of the global (Table 12).
Table 12: China: Lithium consumption (metric tons, LCE)
2010 2011 2012 2013
Consumption 35,800 36,800 55,000 63,000
Source: China Lithium Association
The battery industry plays a significant role in China’s consumption of lithium. In 2013, end-use markets
are estimated as follows: batteries, 42 %; lubricating grease, 18 %; glass and ceramics, 15 %; medicine,
10 %; dyes and adsorbent, 6 %; catalyst 5 %; and other uses, 4 % (Table 13, Figure 5).Supply and Demand of Lithium and Gallium
20
Catalyst Others
5% 4%
Dye, absorbent
6%
Medicine Batteries
10 % 42 %
Glass ceramics
15 %
Lubrication greases
18 %
Figure 5: 2013 Lithium consumption end-use markets in China
Table 13: China: Lithium consumption end-use markets (metric tons, LCE)
End-use market 2010 2011 2012 2013
Batteries 9,670 12,140 18,150 27,090
Lubricating greases 4,300 40,50 8,800 11,340
Glass and ceramics 6,090 6,620 5,500 9,450
Pharmaceutics 1,430 740 2,200 6,300
Dye, adsorbent 1,070 370 3,850 3,780
Catalyst 1,430 3,500 3,850 3,150
Other 11,810 9,750 12,650 2,520
Source: China Lithium Association
China is a major player in the trade of lithium products, along with Japan and South Korea is the world's
leading producer of lithium-ion batteries, and that Japan, South Korea have set up plants in China, giving
a further boost to China demand for lithium. The trading of lithium carbonates assumes a prominent role
in the global lithium trade, and China is of no exception (Table 14, 15). Imports from Chile over 95 %; from
Argentina accounting for 3 % to 5 %. Each year, China imports 250,000 tons to 300,000 tons of spodu-
mene concentrate from Australia.
Table 14: China: Lithium export (Gross weight, metric tons)
Products 2010 2011 2012 2013 2014
Lithium hydroxide 2,455 4,381 3,460 4,215 6,167
Lithium chloride 245 260 353 404 404
Lithium carbonate 2,655 5,362 2,973 1,250 2,463
Source: China CustomsSupply and Demand of Lithium and Gallium
21
Table 15: China: Lithium import (Gross weight, metric tons)
Products 2010 2011 2012 2013 2014
Lithium hydroxide 49 76 488 239 149
Lithium chloride 4,241 2,561 2,753 2,557 6,090
Lithium carbonate 6,398 8,250 13,622 13,681 13,601
Source: China Customs
4.5 Lithium price
The price of lithium carbonate rises year after year due to the more and more demand of lithium (Figure 6).
5,000
4,000
3,000
[$/t]
2,000
1,000
0
2001 2002 2003 2004 2005 2006 2007 2008 2009 2010 2011 2012 2013 2014
Figure 6: Price of lithium carbonate in USA
5 Outlook for lithium supply and demand
To cope with global issues such as shortage of fossil energy and climate change, our society must develop
clean energy. To this goal, governments across the globe are striving to the development of renewable
energy generation and emerging industries such as electric automobile. It is projected that the next ten
years will witness a growth in the demand for lithium around the world.
5.1 Outlook for lithium demand
The global demand for lithium will increase at an average annual growth rate of more than 10 % in the
following ten years. Currently, battery industry is the most lithium-demanding, followed by glass, ceramics
and lubricating greases. The demand of battery industry, increasing by over 10 % each year, is climbing up
at the fastest compared to others. The demand for lithium of lubricating greases industry grows by 3.5 %,
and the glass and ceramics, 3 % to 5 %.Supply and Demand of Lithium and Gallium
22
The Chilean company signum Box predicts that the demand for lithium-ion battery industry will experience
a robust growth. In 2020, the global lithium demand will be about 285,000 tons (LCE, unless otherwise
noted). The lithium-ion battery industry will need about 150,000 tons, or 52.6 % of total demand. In 2025,
the global demand will be around 405,000 tons, 61.2 % of which (around 250,000 tons) will be consumed
by the battery industry (Figure 6, 7).
500
Lithium Carbonates [1.000 t]
Battery Glass and glass-ceramics Other
400 Ceramics Lubricating greases
300
200
100
0
2017 2020 2025
Figure 7: Outlook for lithium demand
Battery Glass and glass-ceramics Other
Ceramics Lubricating greases
100 %
80 %
60 %
40 %
20 %
0%
2012 2017 2020 2025
Figure 8: Outlook for lithium consumption by end-useSupply and Demand of Lithium and Gallium
23
China’s economy will be developing at medium-to-high growth rate in future. The government is actively
promoting the development of clean energy economy, energy production and consumption revolution. China
is the biggest market with the fastest-growing potential demand. In the next ten years, industries including
new energy vehicles, energy-storing battery, electronic products and electric tools will have an increase of
demand, which will further boost the demand for lithium. It is estimated that in 2017, China’s lithium demand
will reach 104,800 tons. In 2020 and 2025, the number will be 131,800 tons and 187,770 tons respectively
(Figure 8, 9).
250
Battery Glass ceramics
Lithium carbonates [1.000 t]
200 Lubricating greases Other
150
100
50
0
2017 2020 2025
Figure 9: Outlook for China lithium consumption
Battery Glass ceramics
Lubricating greases Other
100 %
80 %
60 %
40 %
20 %
0%
2017 2020 2025
Figure 10: Outlook for China lithium consumption by end-useSupply and Demand of Lithium and Gallium
24
5.2 Outlook for lithium supply capacity
With the strong growth in the global demand for lithium, there are more than 20 projects which are expan-
ding or in progress. It is predicted that by 2017, global production capacity for lithium brines will reach
271,000 t/a and that of lithium minerals will be 280,000 t/a, adding up to a total of 551,000 t/a. It is estimated
that global lithium production capacity will reach 730,000 t/a by 2025.
Table 16: World: Production capacity of lithium (LCE, t/a)
Pro- Pro-
Expan- Newly Newly
Current New duction duction
Products ded expanded expanded
capacity projects capacity capacity
capacity capacity capacity
in 2017 in 2025
Lithium
127,000 88,050 4 56,000 271,000 76,000 347,500
brine
Lithium
183,000 22,500 4 75,000 280,000 100,500 380,500
minerals
Total 31,000 110,550 8 131,000 551,000 176,500 728,000
Lithium
199,000 136,000 128,000 463,000
compound
Lithium
concen- 72,000 48,000 8 72,000 192,000
trate
It is predicted that by 2017 the production capacity for lithium compounds will reach 463,000 t/a. There
are 271,000 tons lithium compounds made from saline lake with a cost of US$1,500/t to US$3,000/t,
and 192,000 tons from concentrate with a cost of US$3,200/a to US$4,500/a. Provided that the price of
lithium carbonate is higher than US$4,500/t, the lithium brine will reach 240,000 tons with 130,000 tons
produced by producing companies and 110,000 tons produced by the projects which are expanding or in
progres. If the price of lithium carbonate is higher than US$5,000/a, then the production capacity of lithium
compounds from concentrate is expected to be 130,000 t/a; while if the price is lower than US$5,000/t,
the production capacity is expected to be less than 70,000 t/a (Figure 10).
Lithium Industries
mines in China
Saline lake in Qinghai
Canada lithium mines
Sichuan Tianqi
Other lithium
6000
Argentina ADY
Saline lake in Qinghai
Chile Albemarle
Argentina Orocobre
5000
4000
FMC
[US$ / t]
Chile SQM
3000
2000
1000
0
10 28 88 148 178 188 235 307 367 427
[1.000 t p.a]
Figure 11: Production capacity and cost of lithium carbonateSupply and Demand of Lithium and Gallium
25
5.3 China lithium supply capacity
It is estimated that in 2017, the capacity of lithium will total 228,000 t/a, with 72,000 t/a form brines and
156,000 t/a from lithium minerals. The capacity of lithium compounds is estimated to be 192,000 t/a,
62.5 % of which (or 120,000 tons) is from lithium concentrate. In China, lithium compounds from concen-
trate will cost over US$4,200/t. If the price of lithium carbonate is higher than US$5,000/t, then the capacity
of lithium compounds from minerals is estimated to 80,000 to 90,000 t/a. However, if the price of lithium
carbonate is lower than US$4,800/t, then that is estimate to lower than 50,000 t/a.
6 Conclusions
6.1 Lithium reserves and resources abundant across the world
As one of the most important minerals for emerging industries, lithium will assume an increasingly import-
ant role in the economic development. However, the lithium consumption is relatively low. According to
the minimum statistics provided by USGS, global lithium reserves could last 360 years; and the statistics
from SNL MEG suggests that it could last over 640 years. Thus the lithium supply will be able to meet the
global demand for a long term.
6.2 The supply of global lithium highly concentrated
The lithium production is unbalanced and concentrated. Geographically speaking, more than 70 % of
lithium production is in Chile, Argentina, Australia and China. Meanwhile, more than 80 % of lithium
suppliers are from SQM, Talison (51 % of Talison’s share is held by Sichuan Tianqi Lithium Industries),
Rockwood and FMC. Over 90 % of the saline lake lithium is provided by SQM, Rockwood and FMC. It can
be concluded that the supply of lithium is in monopoly. In the coming ten years, the global lithium supply
may exceed the demand for lithium as the lithium production capacity is 1.5 fold of the demand for lithium.
6.3 The demand for global lithium strongly in future
Global lithium demand will grow at an annual rate of 10% in the next ten years. Currently, the top four
lithium-demanding markets are battery, glass, ceramics and lubricating greases. Battery industry, cur-
rently the biggest lithium-demanding market, will experience the fastest growth, with an annual growth
rate of over 10 %. Following the battery industry is lubricating greases industry, with an annual growth
rate of 3.5 %. Glass and ceramics industry will have an annual growth rate of 3 % to 5 %. The increasing
demand for new energy vehicles, grid storage applications, electronics and electric tools gives a boost to
the demand for lithium. It is estimated that the demand for lithium in China will reach 104,800 tons (LCE) in
2017. By the year of 2020 and 2025, China’s lithium demand will be 131,800 tons (LCE) and 187,700 tons
(LCE), respectively.Supply and Demand of Lithium and Gallium
26
6.4 The potential of China’s lithium resources
China, with around 3,500,000 tons of lithium resources, ranks the third. It is estimated that there are
more than 10,000,000 tons of lithium brines resources in Tibet, Qinghai, and Xinjiang. One of the biggest
difficulties facing the development of lithium brines is the high proportion of Mg/Li, which makes it less
economically feasible to extract lithium from the saline lakes.
6.5 Outlook
Despite the rich lithium resources China has, the lithium supply cannot meet its demand for lithium in
short term due to the lack of technology. Thus China will remain a lithium importer in a few years. The total
lithium export from Chile, Argentina, Australia and United States reaches is over 150,000 tons, creating
an abundant global lithium supply market that allows China to acquire sufficient lithium from international
market, without causing others countries acquiring insufficient lithium from the global market.
7 References
BGS – BRITISH GEOLOGICAL SURVEY: LITHIUM BRINES. – URL: http://www.bgs.ac.uk/sciencefacilities/GeoEn-
vironmental/lithiumbrines.html
CHINA CUSTOMS: General Administration of Customs - People’s Republic of China. – URL: http://english.
customs.gov.cn [24.04.2016]
GTIS – GLOBAL TRADE INFORMATION SERVICES INC. (2015): Global Trade Atlas. – URL: https://www.gtis.com/
gta, [20.04.2016].
JASKULA, B. W. (2015): Lithium. – U. S. Geological Survey, Minerals Yearbook 2013, 44.1-44.11; Reston.
LI, B. (2013): Development Status of Global Lithium in 2013. – Advanced Materials Industry, 2013(7):
32 – 36.
LITHIUM SUB-ASSOCIATION OF CHINA NONFERROUS METALS INDUSTRY ASSOCIATION (2013): China Lithium Industry
Report in 2012.
ROSKILL – ROSKILL INFORMATION SERVICES LTD (2013): Lithium: Market outlook to 2017. – 12th Edition, 426 p.;
London.
SNL – SNL FINANCIAL LC (2014): Online Database (with costs). – Charlottesville, Virginia.
USGS – UNITED STATES GEOLOGICAL SURVEY (2015): Mineral Commodity Summaries 2015. – 196 p.; Reston.
– http://minerals.usgs.gov/minerals/pubs/mcs/2015/mcs2015.pdf [20.04.2016].
WANG, Q., YUAN, C. & XU, H. (2015): Analysis of the global lithium resource distribution and potential. –
China Mining Magazine, 2015(2): 10 – 17.
ZHOU, P., TANG, J. & ZHANG, T. (2014): Supply and demand prospect of global lithium resources. – Geological
Bulletin of China, 2014(10): 1.532 – 1.538.Supply and Demand of Gallium Dieter Huy, Maren Liedtke
Supply and Demand of Lithium and Gallium
28
8 Introduction
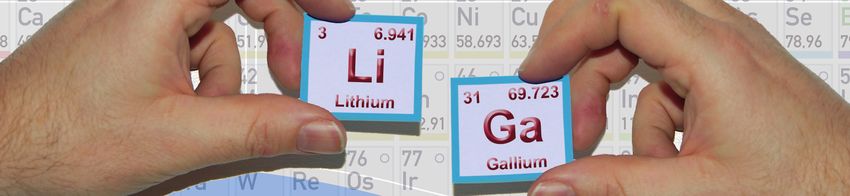
Gallium (chemical symbol Ga, atomic number 31) is a blue-gray to silvery-white metal with orthorhombic
crystalline structure. It was discovered in 1875 by the French chemist Paul Émile Lecoq de Boisbaudran.
It ranks third in the boron group (group 13 according to IUPAC1). Besides mercury, caesium and rubidi-
um, gallium is one of the few elements with a melting point near room temperature (29.78 °C). The metal
remains in a melted state up to 2,204 °C, giving it the largest liquid range of all metal elements. Like water,
gallium expands during solidification. The density of gallium in solid phase is 5.91 g/cm³ and in liquid phase
6.1 g/cm³. For further properties see table 17.
Table 17: Properties of gallium
Atomic number 31
Atomic weight 69.723
Boiling point 2.204°C
Density 5.91 g/cm³ near r.t / 6.095 g/cm³ when liquid
Hardness (Mohs scale) 1.5
Isotopes 69 Ga (60.11 %), 71Ga (39.89 %)
Electron configuration [Ar] 3d10 4s2 4p1
Oxidation states 3, 2, 1, -2, -4
Electronegativity (Pauling scale) 1.81
Thermal conductivity 40.6 (W/m)/K
9 Uses
The use of gallium compound based group III/V semiconductors has made gallium a high-tech metal in
the past decades. The two main application fields are integrated circuits (ICs) and optoelectronic devices.
The most common compounds are gallium arsenide (GaAs) and gallium nitride (GaN), in much smaller
amounts gallium antimonide (GaSb) and gallium phosphide (GaP), representing about 94 % of current
consumption (ROSKILL 2014).
Currently, the greatest use of gallium is in GaAs. GaAs is used as a substrate material (wafer) for the
epitaxial growth of III/V semiconductors including indium gallium arsenide, aluminum gallium arsenide
and others, as well as for the production of high-efficiency (> 20 %) copper-indium-gallium-selenium
thin-film solar cells (CIGS). The largest use is in GaAs compound semiconductors in optoelectronic and
microelectronic industries including integrated circuits (ICs) used in cell phones, infrared emitting diodes
(IREDs), laser diodes (LDs), laser emitting diodes (LEDs), wireless communications, and high-end military
applications.
The predominant use of GaN is in optoelectronics. It can be used to emit brilliant light in the form of light
emitting diodes (LEDs) and laser diodes (LDs). It is also used in electronic devices for next generation high
frequency, high power transistors capable of operating at high temperatures. GaP is used – standalone
or compounded with other gallium components – in the manufacture of LEDs of different colours and
in electronic devices like power amplifiers for WiFi and WiMAX applications. GaSb is used for infrared
detectors, infrared LEDs and thermophotovoltaic systems.
Secondarily, gallium is used in neodymium-iron-boron magnets and batteries, high temperature thermo-
meters, and in low melting alloys. An eutectic alloy of gallium, indium and tin (“Galinstan”) replaces mer-
1) International Union of Pure and Applied ChemistrySupply and Demand of Lithium and Gallium
29
cury in fever thermometers. Gallium oxide is used as a constituent in plasma and fiber optic applications.
Gallium citrate is used in medical imaging for cancer diagnostics (“gallium imaging”).
10 Occurrence and resources
Gallium is present in the Earth’s crust at about 18 ppm (GAO et al. 1998). It is not found in its elemental
form and does not form economically recoverable concentrations. It mainly occurs as a trace element in
aluminium, zinc and germanium minerals like bauxite, sphalerite and germanite, and in hard coal.
At present, gallium is only produced as by-product of the refining process of other metals during alumina
production from bauxite or during zinc residue processing. The most important primary source for gallium
is bauxite. Gallium can be also found in the fly ash produced by the coal and phosphates industries.
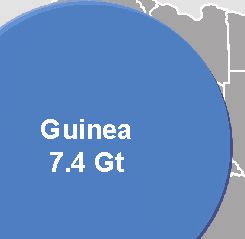
The United States Geological Survey (USGS) reports bauxite reserves of 28 bn t and zinc reserves of
230 Mt (USGS 2014). The leading countries are Guinea, Australia, Brazil, Vietnam and Jamaica for bau-
xite, Australia, China, Peru, Mexico, India, Kazakhstan and the USA for zinc (Figure 12).
Based on an average gallium content of 50 ppm (JASKULA 2014) and a recovery rate of 40 %
(ELSNER et al. 2010) contained gallium in bauxite amounts to 560,000 t. The gallium content of zinc ores
ranges between 10 to 320 ppm (BUTCHER & BROWN 2014). This some additional hundred tons could
be contained in the world zinc resources. The current primary production of gallium is about 300 to
400 t/a (ROSKILL 2014), so primary gallium supply is secured for many hundreds of years (Figure 13).
Bauxite reserves 2014: 28 billion tons (Gt) Zinc reserves 2014: 230 million tons (Mt)
5.9 Mt 10 Mt
China
Canada
Kazakhstan 43 Mt
USA
10 Mt China .
India Gt
amaica 11 Mt
Mexico 2.0 Gt 0.5
16 Mt uyana
u Gt
Guinea 2.1 Gt
0.85 7.4 Gt India
Gt ietnam
1.0 Gt
Peru Brazil
29 Mt 2.6 Gt Indonesia
Greece 0.60 Gt ustralia
Suriname 0.58 Gt 6.5 Gt
Bolivia 4.5 Mt Venezuela 0.32 Gt
Australia
Ireland 1.1 Mt Russia 0.20 Gt
62 Mt
Other 57.0 Mt Kazakhstan 0.16 Gt
Countries USA 0.02 Gt
Other 2.40 Gt
Countries
Figure 12: World distribution of bauxite and zinc reserves (data: USGS)Supply and Demand of Lithium and Gallium
30
6,000
Potential for primary gallium production from bauxite [t]
5,000
Primary gallium production[t]
4,000
3,000
[t]
2,000
1,000
0
1960 1964 1968 1972 1976 1980 1984 1988 1992 1996 2000 2004 2008 2012
Figure 13: Potential for primary gallium production from bauxite
Globally, there are only a few deposits with gallium concentrations in the ore that are high enough to con-
sider a recovery of gallium as main element. The most popular example is the Apex mine in Utah, USA,
where St. George Mining Company brought into production the world’s first mine with gallium and germa-
nium as main elements in 1985 (BAUTISTA 2003). The Apex Mine Mill processed dump and underground
mined ore at 0.03 to 0.045 % gallium for only a few months. In 1987 the company went into liquidation as
the gallium production did not prove to be economic. Currently there are no mines working primarily for
gallium.
11 Production
Gallium is recovered both as primary production, and secondary from recycled gallium-bearing scrap,
mainly compounds. Primary gallium is typically recovered at 99.9 to 99.99 % (3N, 4N), and then refined to
higher purities depending on the further use. 4N gallium is used for metallurgical, chemical and solar appli-
cations. For electronic and compound semiconductor applications 6N (99.9999 %) to 7N (99.99999 %)
purity is required. Very high purity gallium (8N) is used for molecular beam epitaxy (MBE) applications.
11.1 Primary production
About 90 % of current primary gallium production is extracted from bauxite during the refining of alumina.
The most commonly used process for the production of alumina from bauxite, and thus gallium is the Bayer
process, named after the Austrian chemist Karl Joseph Bayer, who developed a method for supplying alu-
mina to the textile industry in 1888 (SEECHARRAN 2010). During the process the aluminium bearing minerals
in bauxite – gibbsite, boehmite and diaspore – are selectively extracted from the insoluble componentsSupply and Demand of Lithium and Gallium
31
by dissolving them in a solution of sodium hydroxide (caustic soda) at high temperatures and high pres-
sure. The solution contains sodium aluminate and non-dissolved bauxite residue containing iron, silicon,
titanium, aluminium, and other elements in small quantities, including gallium.
There are various options to recover gallium from sodium aluminate solutions such as fractional precipi-
tation, electrochemical deposition, solvent extraction, and ion exchange. Solvent extraction is an efficient
method. By using the Kelex 100 system, about 80 % of the gallium in Bayer liquor can be extracted.
However, the kinetics of the extraction process has been proved to be very slow, generally requiring
several hours. Ion exchange is the main method applied in industry for gallium recovery from Bayer liquor.
Duolite ES-346 and DHG586 exhibit good extracting properties for gallium, and are used as industrial
resins (ZHAO et al. 2012).
A small amount of gallium is produced as by-product of zinc extraction from sphalerite ore (ZnS). During
this process the sphalerite is first roasted to zinc oxide (ZnO) and then leached with sulphuric acid. Galli-
um is contained in impurities which are separated from the leach solution. Using Duolite ES 467 or HDP
ion exchange resins the gallium is recovered from these residues by ion exchange (JACQUIN et al. 1987).
Finally, during production of alumina as well as during refining of zinc, electrowinning is used to create a
crude gallium metal at purities of 99.9 to 99.99 % (3N/4N gallium) (Figure 14).
Gallium-bearing Gallium-bearing
bauxite ores zinc ores
Bayer process Acid leach
Gallium-bearing Gallium-bearing
Bayer liquor zinc sulphate solution
Proprietary techniques using Antimony trioxide,
Precipitation to remove zinc dust
ion exchange resins or
impurities or proprietary reagents
non-proprietary processes
Gallium-bearing
cement residue
Separation
‚New‘ scrap recycled from
manufacturing processes
3N Gallium
primary gallium
Electrolytic refining
or
washing with hydrochloric acid
4N Gallium
Zone refining
6N / 7N / 8N Gallium
Figure 14: Processes of extracting gallium from bauxite or zinc ores (after BUTCHER & BROWN 2014)Supply and Demand of Lithium and Gallium
32
World primary production
The USGS estimates the world primary gallium production to be 440 t in 2014, a plus of 26 % compared
to the previous year before (350 t). China, Germany, and the Ukraine were the leading producers. Lesser
output came from Japan, South Korea, and Russia (JASKULA 2015a).
From the beginning of the 1970th to the end of the 1990th production of primary gallium rose continuously
at a compound annual growth rate (CAGR) of 7.3 %. Between 2001 and 2004 production fell owing to
lower demand for gallium in the electronics industry. Since 2005 production is rising sharply with growth
rates of nearly 20 %, only briefly interrupted by the financial crisis in 2009 (Figure 15). Overall, the CAGR
from the beginning of the 1970th to 2014 is 8.4 %.
World primary production capacity
Global estimated capacities for the production of crude gallium amounted to 680 t (JASKULA 2015a). China
has available capacities of about 550 t. Outside China the production capacities add up to about 123 t
(JASKULA 2014b; NAUMOV 2014): Germany accounting for 40 t, followed by Kazakhstan (22 t), South Korea
(16 t), Ukraine (15 t), Russia (12 ), Japan (10 t), and Hungary (8 t). In the past, further production capa-
cities were indicated for Australia, the USA, and Slovakia. Between 1994 and 2014 global capacity has
been increasing by 8 % annually. Since the end of the 1990s, especially China has ramped up production
capacities massively and is currently disposing of more than 80 % of the global crude gallium capacities.
During the past years, the production was usually below 50 % of the capacities, rarely above. Merely during
the short period of 2010 to 2012 there was an increase in capacity utilization between 70 and 80 % (Figure 15).
700 100
Primary Production and ProductionCapacity [t]
utilised capacity
600
primary production capacity
80
primary production
500
Utilised Capacity [%]
60
400
300
40
200
20
100
0 0
1970 1975 1980 1985 1990 1995 2000 2005 2010 2015
Figure 15: Production, production capacity and capacity utilization of primary galliumSupply and Demand of Lithium and Gallium
33
11.2 Secondary production
Recycling of gallium is another significant source for the market. At present, no gallium is recovered from
post-consumers scrap, so the wastes from the production of GaAs and GaN wafers are the most important
source for secondary gallium. The fabrication of these semiconductor wafers generates about 60 % new
scrap, with a gallium content ranging from 1 to 99.99 % (BUTCHER & BROWN 2014).
Worldwide secondary capaciƟes are esƟmated at 200 t.
11.3 Refinery production
Gallium at 3N/4N purities (99.9 to 99.99 %) obtained from primary and secondary production must be
refined to higher purities, typically by fractional crystallization and zone refining up to 7N/8N dependent
on the further use.
Reliable data for production and capacity of refined gallium are very difficult to obtain and in many cases,
it is impossible to differentiate wether production is derivet from secondary gallium or upgraded 3N/4N
gallium.
According to estimates of the USGS refined gallium production in 2014 was about 170 t, 15 % less than
2013. Refinery capacity was 230 t in 2014. Only 39 % of the primary gallium production of 440 t was
refined, compared to 70 % in the year before.
Principal producers of refined gallium from primary material were China, Japan, the United Kingdom, the
United States, and Canada. Principal producers of refined gallium from secondary material were Japan,
China, the United Kingdom, the United States, Slovakia, and Germany.
12 Gallium producers by country
Australia
Currently there is no gallium production in Australia. In the first half of the 1990s, Australia was a major
producer of primary gallium from Rhône-Poulenc’s 50 t/a facility which was established in 1989 near
Alcoa’s Pinjarra alumina refinery. The plant produced gallium chloride which was exported to France,
where Rhône-Poulenc refined gallium at its Salindres plant. Oversupply of gallium resulted in the shut-
down of several gallium recovery facilities worldwide, including Pinjarra which was mothballed after only
one year in operation. Rhône-Poulenc stated, that it had sufficient gallium stockpiled at the plant to meet
current demand levels and would not reopen the plant until market conditions improved (Kramer 1992). In
1998, Rhodia Chimie S.A. founded following the spin-off of the chemicals, fibres and polymers activities of
Rhône-Poulenc, took over the gallium business and operated Pinjarra by its Australian subsidiary Rhodia
Pinjarra Pty Ltd. In 1999 the US company GEO speciality chemicals acquired Rhodia. GEO Gallium S.A.
a subsidiary of GEO speciality chemicals announced to double the capacity of Pinjarra to 100 t/a in 2002
(CS 2001) but the plan was never realized.Supply and Demand of Lithium and Gallium
34
Canada
Although Canada is one of the top five producers of zinc there is no production of primary gallium.
Molycorp Minerals Canada ULC is the Canada division of Molycorp Inc. (see section USA). Molycorp
Canada recovers gallium and indium from low grade manufacturers waste and residue at its Peterboro-
ugh, Ontario hydrometallurgical plant. The plant was owned by Recapture Metals Ltd. and acquired by
Toronto-based Neo Material Technologies Inc. in 2009 (SEMICONDUCTORTODAY 2009). Neo Material itself
was acquired by Molycorp in 2012 (MOLYCORP 2012). Molycorp (2015b) reports a gallium production from
scrap feedstock of 13 t for 2013 and 2014 respectively; this includes gallium production at Molycorps US
plant at Blanding, Utah. ROSKILL (2014) reports an upgrading capacity of 30 t/a at Peterborough.
China
China is by far the major producer of both, primary and refined gallium. The primary gallium production
capacity of China is estimated at 450 – 470 t for 2013 (JASKULA 2015b, ROSKILL 2014) and 550 t for 2014
(JASKULA 2015a). Most of the gallium is produced as a by-product from Bayer liquor during alumina pro-
duction, only small amounts originated from zinc production. According to ROSKILL (2014), China has
capacities of at least 170 t for upgrading and recycling of gallium. In 2013 China produced 327 t of gallium
(INFORMATION CENTER OF MINISTRY OF L AND AND RESOURCES (ICMLR), personal communication, October 22,
2014). The Fanya Metal Exange reported stocks of 197.46 t in August, 2015, and nearly reached its total
storage capacity of 200 t for gallium (FANYA EXCHANGE 2015), in addition to at least 50 t at the State Reserve
Bureau of China (SRB) (METALBULLETIN 2013).
Major Chinese producers of primary gallium are
• Zhuhai SEZ Fangyuan Inc. is China’s and the world’s largest producer of primary gallium. It accounts
with a capacity of 140 t per year at six locations for more than 30 % of total world output. The compa-
ny produces 4N and 6N gallium and is owner of a patent of a chelating resign for adsorbing gallium
(“GaXW-7”, State invention patent no. ZL03112341) (ZHUHAI FANYUAN 2015).
• Aluminium Corporation of China Ltd. (CHALCO) produces gallium metal and gallium oxide at four
sites at Shandong, Henan, Guizhou and Shanxi province (CHALCO 2015a). In 2014 the company
produced 81.2 t of gallium, after 127.8 t in 2013 and 39.2 t in 2012 (CHALCO 2015b).
• East Hope Mianchi Gallium Industry at Mianchi County, Henan Province ranks third with a capacity
of 80 t/a and a production of 40 t/a (ROSKILL 2014).
• Shanxi Jiahua Tianhe Electronic Materials is a joint venture of Molycorp, Shanxi Aluminium Plant
and Beijing JiYa Semiconductor Material. Its capacity is estimated at 50 t/a (ROSKILL 2014).
• Xiaoyi Xingan Gallium Co., Ltd was founded 2011 by Xiaoyi Xingan Chemials Co. Ltd, a subsidiary of
Hangzhou Jinjiang Group, one of the major alumina and aluminium producers in China. (50 t/a). The
company reports a capacity for the production of 4N gallium of 50 t/a and has the world’s largest single
production line (XINGAN 2015).
• Beijing JiYa Semiconductor Material Co. is a joint venture of the US company AXT Inc., Consco
Group, Hong Kong and Shanxi Aluminum Plant and has a capacity of 45 t/a (ROSKILL 2014).
• Shanxi Zhaofeng Gallium Industry Co. is a joint venture of Shanxi Zhaofeng Aluminum Co., Ltd of
Yangmei Group, Beijing JiYa Semiconductor Material Co., and Chalco Jinlv Refr Co. It has a capacity
of 20 – 40 t/a (ROSKILL 2014).Supply and Demand of Lithium and Gallium
35
Secondary and refined gallium is provided by
• Nanjing Jinmei Gallium Co., Ltd., a joint venture between the US company AXT Inc. (83 %) and
Nanjing Germanium Factory (17 %) (AXT 2015, CNGE 2015). On its website the company reports
capacities for the production of 100 t of high-pure gallium of 5N to 8N, including MBE gallium, of 50 t
for crude gallium from recycling, of 6 t for 4N/5N gallium oxide, and of 2 t for 4N/5N gallium nitride
(NANJING 2015).
• MCP Metals (Shenzen), owned by 5N Plus, Canada has upgrading capacities of 20 t/a (Roskill 2014).
A joint venture called MCP Crystal was formed in 2009 between the MCP Group and the Chinese com-
pany Golden Harvest Ltd. to create an integrated gallium operation capable of producing both low-puri-
ty and high-purity gallium. The joint venture consisted of four operations, three 99.99 % (4N) plants and
one 6N and 7N plant. The 4N plants were expected to collectively produce between 70 t/a and 80 t/a
of gallium. The plants were located in Henan, Shangxi, and Sichuan Province (JASKULA 2011).
• Vital Materials Co. produces high purity gallium (5N – 7N). In 2013 Vital Materials entered into an
agreement with Hangzhou Jinjiang Group to form a joint venture for the production of gallium. The joint
venture operation will produce 60 t/a (VITAL 2013). Crude gallium is supplied by Jinjiang’s subsidiary
Xingan Gallium. In addition to gallium metal, Vital produces gallium compounds like gallium oxide,
chloride, sulfate, nitrate, phosphide, antimonide and trimethyl gallium and recycles gallium from galli-
um-bearing scrap.
• Emei Semiconductor Material Factory & Institute is according to its company profile the biggest
producing center for high pure elements and compound materials in China (EMEI 2012). The company
was founded in 1964 and is situated in Leshan, Sichuan province. The company produces and sells a
wide range of high purity elements including gallium of 5N – 7N.
• Sichuan Western Minmetals Co., Ltd. is a supplier providing a wide range of high purity metals and
oxides including gallium metal of 5N – >7N and gallium oxide and gallium trioxide of 4N – 5N. The
company is headquartered at Chengdu, Sichuan province (SWM 2015).
• Sumika Electronic Materials (Shanghai) was established as a 70/30 joint venture named Shanghai
Sumika High Purity Metal Ltd. in 2001 by Sumitomo Chemicals Co. Ltd and Inabata & Co., Ltd, Japan.
The refining facility has a capacity of 40 t/a of 6N – 7N gallium metal, which will be supplied to Sumito-
mo (KRAMER 2001)
• Zhuzhou Keneng New Material Co., Ltd. was established in 2001 at Zhuzhou, Henan privince. The
main products include indium, bismuth, tellurium, and 4N and 6N gallium (ZZK 2015).
France
Currently there is no production of gallium in France. Until 2006 GEO Gallium S.A. a subsidiary of US
Geo Speciality Metals Inc., was the leading producer of refined gallium at its Salindres plant (formerly
owned by Rhône-Poulenc and Rhodia Chimie S.A.) using primary gallium produced at its Ingal Stade plant,
Germany as feed material. After GEO Gallium had sold Ingal Stade to MCP, Great Britain and recapture
Metals, USA, the Salindres facility was subsequently closed and at yearend Geo Speciality Metals Inc.
no longer operated its Geo Gallium subsidiary (K RAMER 2007).
Germany
Ingal Stade GmbH, based in Stade near Hamburg, is Germany’s sole producer of primary gallium and
the biggest outside China. The company is located on the premises of Aluminium Oxide Stade Gmbh
(AOS), an alumina refinery with a current production in excess of 900,000 t/a of aluminium oxide (Al2O3),
owned by Dadco Alumina & Chemicals Ltd. Ingal Stade was founded as International Gallium in 1989 and,
meanwhile, has since changed ownership several times. Presently, Ingal Stade is a 50:50 joint venture
between the Canadian 5N Plus and the US company Molycorp Inc.Supply and Demand of Lithium and Gallium
36
Ingal extracts annually about 30 t of primary gallium from Bayer process liquor of the alumina refinery.
For further treatment and refining up to 7N purity the gallium is shipped to the owners’ facilities in the UK
and the USA.
PPM Pure Metals GmbH at Langelsheim, Germany has a very long tradition in the production and refi-
ning of high purity metals and compounds. It started with a smelter for processing lead and zinc in 1575.
Later it was an operation site of the German Preussag AG. Since 1988 PPM is part of the French Recylex
S.A. PPM is engaged in the production of high purity minor metals and their compounds for mainly the
electronic, opto-electronic, and photovoltaic industries. This includes ultra pure metals (up to 7N5 quality)
and compounds of the elements antimony, arsenic, cadmium, copper, gallium, germanium, indium, lead,
tellurium, and tin. PPM produces gallium from 4N – 8N purity by recycling scraps, residues and slurries
from gallium arsenide pulling, wafer and epitaxial processing, and other gallium containing materials (PPM
2015). ROSKILL (2014) estimates a capacity of 10 t/a.
Hungary
Magyar Aluminium Zrt. (MAL) was established in 1995 when the Hungarian aluminium industry was pri-
vatized. In Ajka, situated about 150 km west of Budapest, MAL is operating an alumina facility processing
domestic ores. Since the acquisition of the bauxite operation Rudnici Boksita Jajce in 2004 Bosnian ores
have been shipped to Ajka, where Mal is extracting crude gallium from Bayer liquor with a purity of 4N to
7N (MAL 2014). There is an estimated capacity of 8 t per year. The last reported production was 3.9 t in
2009 (ROSKILL 2014). According to company reports gallium production stopped in 2013 (MAL, personal
communication, June 24, 2014).
Japan
Japan has a production capacity of primary gallium of about 10 tons per year. It is recovered from the
by-products of the zinc smelting process of Akita Zinc Co., Ltd, Iijima Smelting Plant, an 81 % subsidiary
of DOWA Metals and Mining Co., Ltd. Akita refines zinc from imported ore mainly from DOWA’s 39 %
share Tizapa mine in Central Mexico (DOWA 2015a), as Japan has no domestic zinc ore production. The
subsequent treatment to high-purity (7N) gallium is carried out by DOWA Electronics Co., Ltd.
Japan’s gallium supply in 2013 was about 140 t of which 71.5 t were sourced from recycled scrap (JASKULA
2015b). About 60 t of gallium are imports, the remainder is primary gallium from zinc refining. According
to ROSKILL (2014) Japan has capacities of about 210 t for upgrading and recycling of gallium. There are
five companies reporting refining, upgrading or recycling of the metal (RLJ 2007):
• Dowa Electronic Materials Co., Ltd refines gallium that is produced from by-products of the zinc
smelting process at Akita Zinc Co’s Iijima Smelting Plant and from recycled gallium scrap to purities up
to 7N (DOWA 2015b). Capacity is estimated at 90 t/a (ROSKILL 2014). By its own account the company
holds the no. 1 share in sales of high purity gallium in the world market. Dowa Electronics also supplies
gallium oxide, gallium arsenide and gallium nitride based epitaxial wafers and LEDs.
• Sumitomo Chemicals Co. is a major Japanese chemical company and a member of the Sumitomo
Group. The company has high purity gallium capacities of about 100 t/a of which 60 t are at Ehime
plant, Japan, and 40 t provided by Sumika Electronic Materials (Shanghai) (ICIS 2001). Sumitomo
Chemicals Co. is thus one of the world’s largest producer of the metal. Sumitomo Chemical’s gallium
products include high purity gallium, trimethy gallium, triethyl gallium, and gallium arsenide wafers. In
April, 2015 Sumitomo Chemicals acquired Hitachi Metals, Ltd’s compound semiconductor materials
business.
• Rasa Industries, Ltd. started as Rasa Island Phosphate Ore Co., Ltd. in 1911. The production of
high purity gallium from semiconductor wafer scrap began 1982 at Osaka factory. Rasa’s ElectronicYou can also read