HOUSING IN CANADA'S BIG CITIES - THE CITY OF CALGARY AFFORDABLE HOUSING DIVISION
←
→
Page content transcription
If your browser does not render page correctly, please read the page content below
HOUSING IN CANADA’S BIG CITIES
THE CITY OF CALGARY
AFFORDABLE HOUSING DIVISION
MAY 2018
TABLE OF CONTENTS

FOREWORD .............................................................................................................................................................................................................................................. 3
AT A GLANCE ............................................................................................................................................................................................................................................ 4
EXECUTIVE SUMMARY ............................................................................................................................................................................................................................. 6
INTRODUCTION ...................................................................................................................................................................................................................................... 14
HOUSING SUPPLY ................................................................................................................................................................................................................................... 19
HOUSING AFFORDABILITY ...................................................................................................................................................................................................................... 29
A CLOSER LOOK AT CALGARY ................................................................................................................................................................................................................. 33
CORRELATIONS ...................................................................................................................................................................................................................................... 37
HOUSING STRATEGIES AND PLANS ........................................................................................................................................................................................................ 38
CONCLUSION .......................................................................................................................................................................................................................................... 46
GLOSSARY............................................................................................................................................................................................................................................... 48
LIST OF FIGURES ..................................................................................................................................................................................................................................... 51
LIST OF TABLES ....................................................................................................................................................................................................................................... 52
REFERENCES ........................................................................................................................................................................................................................................... 53

                                                                                                                                                                                                                                         2|Page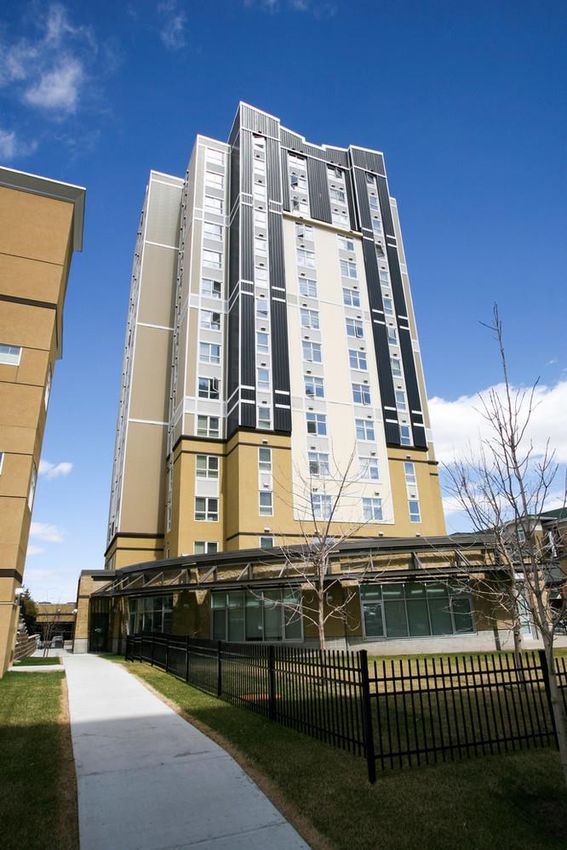
FOREWORD
Background
In March 2017, The City of Calgary published Housing in Calgary: An Inventory of Housing Supply, 2015/2016, providing comprehensive information on Calgary’s
housing supply, covering the entire spectrum of housing in Calgary, from emergency shelter spaces to market homeownership. Through this report, a more
complete picture of the entire housing system in Calgary became visible, enabling a broader understanding of housing supply trends, gaps and implications and
specifically, the current state of the affordable housing segment.
This report is intended to compliment the 2017 Housing in Calgary report by helping to understand in what ways Calgary’s housing supply and affordability
compare to other big cities, the possible reasons why it is different, and what municipal tools are currently being used to impact supply and affordability in
Canada’s largest cities.
In 2016, Calgary City Council unanimously adopted Foundations for Home: Calgary’s Corporate Affordable Housing Strategy 2016 – 2025, along with an
Implementation Plan for the period 2016-2022. This research may inform several initiatives in the Implementation Plan, as well as the prioritization of tactics by
Calgary’s Community Housing Affordability Collective (CHAC), and could be used to strategically plan future development in the city. Additionally, this research
could be used to inform discussions and advocacy with other orders of government.
Acknowledgements
This report would not have been possible without the valuable information provided by:
Canada Mortgage and Housing Corporation (CMHC) The City of Mississauga
Statistics Canada The City of Winnipeg
The City of Toronto The City of Vancouver
The City of Montréal Chartered Professional Accountants (CPA) Canada, Francis Fong,
The City of Calgary Chief Economist
The City of Ottawa The Co-operative Housing Federation of Canada, Cynthia Mitchell
The City of Edmonton
3|Page
AT A GLANCE
Calgary’s housing supply differs substantially from other Canadian cities. Among the major cities in Canada, Calgary has the highest rates of homeownership and
single-family housing, and the lowest supply of purpose-built rental, subsidized housing and co-operative housing. These differences appear to have been
influenced by:
1. Timing of Development: The bulk of housing in Calgary has been built during economic ‘booms’, when demand and incomes are high. Market response
has been to build an expensive, homogenous housing supply.
2. Income Inequality: Calgary has the highest income inequality among the big cities. The proportion of households earning higher incomes is very large, as
is the income gap. This has influenced market response, as well as public policy.
3. Incentive: There has been a lack of incentive to build some types of housing. This is a result of market demand, but also government funding and policy.
Calgary was a relatively small city when government incentives encouraged a wider variety of housing types, and so the city benefitted less from these
investments.
The result is a well-served higher-income population and an underserved lower-income population, and while this lower-income population is small, compared
to the rest of Calgary, their housing options are severely limited.
Given that:
Calgary has a capable building industry and a plan to get building,
It has been shown that simply increasing supply has not eased the affordability crisis in other major cities, and only continues to serve higher-income
buyers and drive up housing costs,
There is little risk of Calgarians becoming underserved if other types of housing are built, and
These conditions (wealth, income inequality, lack of incentives) persist, it is likely that the market will continue to provide the same response,
The recommendation of this research is that strategic initiatives are necessary to produce affordable housing in Calgary. Plans to address affordability concerns
through the addition of market housing stock are likely not sufficient to close the gap in housing choice for low-income Calgarians.
4|Page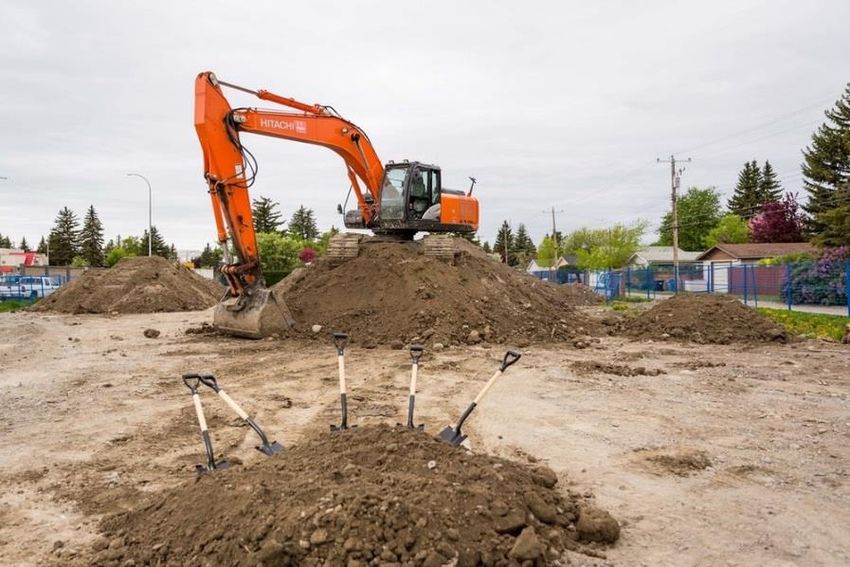
0.00   0.10   0.20   0.30   0.40   0.50

                                          5|Page
EXECUTIVE SUMMARY
Key Findings
Supply
Housing in Calgary is very different from housing in Canada’s other big cities, with the:
second-highest rate of homeownership at 71%, compared to the average of 59%,
second-lowest proportion of households living in rental housing at 29%, compared to the average of 41%,
lowest proportion of households living in subsidized housing, at 2.9%1, compared to the average of 5.3%,
second-highest per cent of households living in single-family housing, at 56.3%, compared to the average 36.5%,
lowest per cent of households living in high-rise apartment buildings, at 7%, compared to the average 20%,
lowest supply of purpose-built rental apartments, representing 7% of housing supply, compared to the average 16%, and the
lowest supply of co-operative housing, at 0.3%, compared to the average of 1%.
Table 1: Housing in Canada’s Big Cities, 2016
Single- “Other % Purpose- % Co-
Owner Renter Subsidized % High-Rise
Family Attached” Built Rental Operative
Households Households Households Apartments
Housing Housing2 Stock3 Housing
Toronto 53% 47% 7.1% 24% 31% 44% 14% 1.5%
Montréal 37% 63% 5.6% 7% 78% 14% 33% 0.9%
Calgary 71% 29% 2.9% 56% 36% 7% 7% 0.3%
Ottawa 66% 34% 5.5% 42% 39% 18% 15% 0.7%
Edmonton 64% 36% 3.8% 50% 42% 7% 13% 0.3%
Mississauga 72% 28% 4.1% 38% 36% 26% 14% 1.1%
Winnipeg 65% 35% 6.4% 59% 27% 13% 18% 0.8%
Vancouver 47% 53% 7.3% 15% 56% 29% 11% 2.0%
Average 59% 41% 5.3% 36% 43% 20% 16% 1.0%
1
In Housing in Calgary: An Inventory of Housing Supply, 2015/2016, non-market housing supply was found to be 3.6%. The difference is likely the result of how units were counted – whereas data
in the Housing in Calgary report was total dwelling units, the data here is occupied dwelling units, as reported in the 2016 Census of Canada. Some of the difference can also be explained by
different data collection periods, as well as Statistics Canada estimation methodology.
2 “Other Attached” is a subtotal of the following categories: semi-detached house, row house, apartment or flat in a duplex, apartment in a building that has fewer than five storeys and other
single-attached house. It is often referred to as “missing middle housing” – the type of housing between single-family/low density and high-rise apartments.
3 CMA data
6|Page
Affordability
Among Canada’s big cities, Calgary appears to be performing well when it comes to affordability. Calgary boasts the lowest rate of core housing need (11.8%)
and the lowest rate of overspending (22%) making it clear that the market is meeting the needs of many Calgarians. However, when housing costs and income
distribution are examined more closely, this research shows that Calgary is facing particular challenges:
Housing affordability challenges in Calgary are concentrated in the lower-income households. Sixty per cent of households with household incomes
below $60,000 are overspending (spending more than 30% of their household income on housing), while only eight per cent of households with
household incomes above $60,000 are overspending,
Rents in Calgary’s cheapest rental units are the most expensive among all the large metropolitan areas, and
Since 2006, core housing need has increased faster in Calgary than any of the other cities, at a rate of 25%.
While constrained housing supply is often blamed for declining housing affordability, recent research suggests that the relationship is not simple. Dr. John Rose
examined the supply and affordability of housing in Canada’s cities from 2001-2016, and found that even in the most expensive markets, housing supply has
kept pace with the growth in number of households. In fact, housing supply has been sufficient enough to add surplus stock. For the Calgary CMA, the
replacement rate was 1.08, meaning that for every 100 households added to the city, 108 housing units were built (Rose, 2017). This suggests that simply adding
more market housing supply, either through densification, or through building out via city growth, may not be an effective tactic on its own.
Why Calgary is Different
Fundamental Factors
It is understood that higher disposable income, positive population growth and low mortgage rates tend to increase the demand for homeownership (Canada
Mortgage and Housing Corporation, 2018). All of these factors have been present in Calgary over the past twenty years. While all of the cities examined have
had relatively equal access to low mortgage rates, Calgary and Edmonton have had much higher than average disposable incomes and population growth.
Self-Perpetuating Cycle
“Choices made by households over many generations affect, and are affected by, the stock of available housing. Calgary and Edmonton tend to have more
single-detached homes, whereas other cities tend to have denser housing. Toronto has more high rises, while Montreal has proportionately more low-rise
structures, with Vancouver in between. This pattern is in turn reflected in the dwelling and population densities of cities…” which in turn have impacts on
dwelling densities (Canada Mortgage and Housing Corporation, 2018).
Income Distribution
Income inequality is more exaggerated in Calgary than any of the other metropolitan areas studied, and has increased at four times the national average growth
rate since 1982. High income inequality excludes a segment of the population from community, as they are not able to afford the typical amenities enjoyed by
7|Page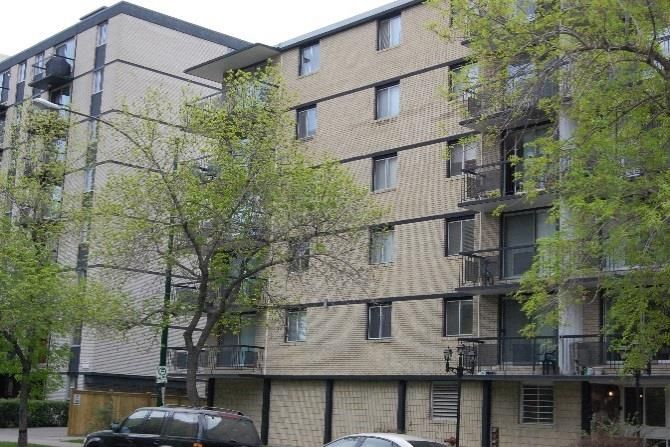
the average population, in this case, housing. The relatively small size of this lower-income group in Calgary has likely given them very little voice in the public
realm, to advocate for changes that could improve their housing situation.
Market Response
Given the rates of population increases, and the high incomes in Calgary over many years, the demand for higher-cost housing has been sufficient to stimulate a
market response. This, coupled with low incentive for rental housing construction, including affordable housing, has likely prevented private industry from
entering this segment of the market.
Recommendations
This research has found that Calgary’s housing supply is very different from other Canadian cities. Market response to demand during ‘boom’ cycles has meant
that significant housing stock has been added at a time when incomes were historically high. This, combined with significant income inequality, means that
Calgary’s housing has been largely shaped by the demand of a large, high-income cohort of households. The result is a housing supply that is both homogenous
and expensive, leaving a gap in housing choice for lower-income households in Calgary. These households are left to compete for a limited supply of housing that
they can afford. To fill the housing gap, the following three key recommendations are made:
1. Increase the supply of rental housing
Calgary has a severe shortage of purpose-built rental housing, non-market housing, and co-operative housing, with a supply well below the other big cities.
Strategic efforts to encourage these specific types of housing should be made, including continued support to non-profit organizations, and incentivizing
industry.
Some of the Municipal tools being used in the other big cities to increase rental supply include:
Improving the pro forma on rental development through incentives like expedited approval processes, waiving/deferring development charges,
waiving/deferring property taxes, reducing parking requirements, pre-zoning for rental only, cost offset programs, and grants.
Improving the pro forma on rental development through advocacy efforts to the Federal government for changes in income taxation on rentals and
condominiums, so that the economics of building rental would be improved.
Supporting the non-profit and co-operative housing sectors, via incentive programs (such as the Housing Incentive Program), and through the disposition
of City-owned surplus land.
Funding the development of City-owned non-market housing through revenues from development activities and the net proceeds from the sales of
surplus land.
Supporting the development of a Corporate Real Estate Strategy, with priority on allocating surplus lands for affordable housing, as well as acquiring and
dedicating new lands for affordable housing.
Simplifying the processes and regulations for second units (secondary suites, laneway suites).
8|Page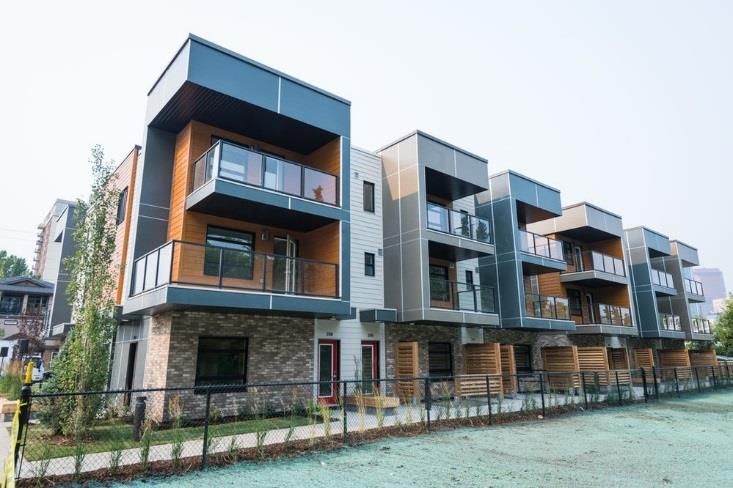
While it may seem counterintuitive to build more rental housing, given the current high vacancy rate, this recommendation is made with the following rationale:
Building rental supply will house those who work and live in Calgary. Fifty per cent of Calgary’s households do not earn sufficient income to afford
ownership housing in the market (without prior assets, savings, gifts or other mortgage helpers) (The City of Calgary, 2017). This may be impactful for
newcomers trying to find housing in the city, as well as for current Calgarians without these resources. Additionally, increasing the supply of non-market,
co-operative and purpose-built rental is a means of adding housing stock without the potential ramifications from investor speculation and non-resident
ownership driving up housing costs. This type of housing is also less vulnerable to being used for short-term rental accommodation, and therefore,
remains available to residents.
Calgary has a history of fluctuations in vacancy rates, and vacancy rates will likely come down again, especially given the shortage of supply.
Calgary is in the process of diversifying its economy by attracting a variety of industry and it will need housing for the employees in those industries,
many of which may be paying Alberta’s competitive minimum wage. Newcomers earning minimum wage will not have sufficient income to afford to buy
in Calgary’s market.
2. Protect the supply of rental housing
Along with increasing the supply of purpose-built rental housing, non-market housing, and co-operative housing, it is also recommended that efforts be made to
protect the existing supply of this stock. With higher than typical vacancy rates in Calgary, the timing is optimal for regeneration efforts.
Some of the Municipal tools being used in the other big cities to protect rental supply include:
Prioritizing and supporting the redevelopment or regeneration of existing rental stock. This has been supported through similar incentives as are
outlined above.
Supporting the acquisition of existing rental stock for the affordable housing and co-operative housing sectors; this has included supporting renovations
on units that are acquired that are in need of repair. An example of this would be selling city-owned land that has been leased to non-profit
organizations and housing co-operatives.
Implementing condominium conversion regulations. It should be noted that if this tool were considered for Calgary, it is only recommended for newer
developments. Applying condominium conversion regulations on all rental development could inhibit the purchase and renovation of older buildings,
and thus could sustain rental buildings in poor condition. One way these regulations could be used in Calgary would be to protect new rental supply that
is supported through government incentives. In other words, if incentives are provided to increase rental supply, condominium conversion regulations
could help prevent the new units from being quickly converted to condominiums, thereby protecting both the supply and government investment.
Implementing short-term rental regulations, for the purpose of increasing or preserving rental housing supply, is not a recommendation of this report. This is
partly because the short-term rental market comprises such a small proportion of housing supply in Calgary, and efforts to limit short-term rentals might be
better spent on other initiatives to increase and protect rental supply. Additionally, recent research shows that investors may have played a critical role in
9|Page
increasing the supply of new housing in Canada, and that curtailing investors’ interest in financing new housing construction could adversely affect long-term
housing supply (Canada Mortgage and Housing Corporation, 2018).
3. Diversify ownership stock
While Calgary will need to add housing stock proportionate to its growth, the new economic reality for Calgary provides an opportunity to diversify the
ownership stock being produced as well. Looking further ahead, Calgarians will need a range of ownership options to meet their needs, including single-family
housing, townhomes, duplexes and multi-family developments. The housing preferences of low and moderate income Calgarians should be taken into account
when building new ownership stock, with most people preferring ground-oriented housing over high-rise apartment buildings (The City of Calgary, 2015).
Calgary has an accomplished, skillful development industry, and government should work to redirect some of industry’s efforts to supplying a range of
ownership options for lower-income households.
Some of the Municipal tools being used in the other big cities to create ownership opportunities for lower-income households include:
Incentivizing industry to build housing for lower-income households,
Incentivizing redevelopment in older neighbourhoods, especially those in close proximity to amenities such as transit and grocery stores,
Programs to help lower-income households buy a home (including down payment assistance and affordable homeownership programs),
Programs to help people stay in their owned homes (supports, renovations),
Implementing non-resident ownership taxation (Municipal portion), and
Advocating for non-resident ownership policy and/or taxation (where funds would be redirected to affordable housing) at the Federal level.
A more comprehensive examination of non-resident ownership and its potential impacts is a recommendation of this report. Foreign investment could be
influencing Canadian buyers’ expectations of future house prices, which could be driving up housing prices (Canada Mortgage and Housing Corporation, 2018).
CMHC data suggests that foreign investors are concentrated on higher-priced properties in urban centres (Canada Mortgage and Housing Corporation, 2018).
While the proportion of non-resident ownership has been reported as quite low (3.4% in Toronto and 4.9% in Vancouver), these numbers are actually higher
than the proportion of non-market housing and co-operative housing found in Calgary.
10 | P a g eThe City of Calgary’s Role
The findings from this research confirm and support the direction set by The City of Calgary’s
corporate affordable housing strategy, Foundations for Home, 2016-2025. Together with an
implementation plan for the period 2016-2022, Calgary City Council has endorsed the strategy and its
six key objectives:
1. Get the Calgary community building,
2. Leverage City land,
3. Design and build new City units,
4. Regenerate City-owned properties,
5. Strengthen intergovernmental partnerships, and
6. Improve the housing system.
Progress toward the objectives is already underway, and several actions have been implemented that
support the three recommendations of this report, that is, increase rental supply, protect rental supply and diversify ownership stock. Continued investment in
these actions will contribute to achieving these three recommendations. A high-level description of work completed or underway is listed below, and more
information can be found through reports to Council and on The City of Calgary’s website.
There is also an opportunity to use the findings presented here to prioritize and plan future implementation of the Strategy. A high-level description of actions
yet to be implemented is included below. The research on the tools that other Municipalities are using could be used here, to inform tactics to achieve the
objectives of the Strategy.
Get the Calgary Community Building
Actions completed or underway include:
The provision of a dedicated resource in Planning & Development, to support organizations (that provide affordable housing) through the planning
approval process,
Prioritizing affordable housing applications in the planning process,
Implementation of the Housing Incentive Program (HIP), a $6.9M funding program to support non-profit organizations to develop affordable housing,
and
Advocating to the Government of Alberta to offer property tax exemptions for affordable housing.
Actions yet to be implemented, that would support the recommendations of this report, include:
Incentivizing private developers to build, manage or contribute to affordable housing,
11 | P a g e Implementing regulatory changes that would enable lower-cost building forms, and
Increasing the proportion of households in Calgary that are served by the market.
Leverage City Land
Actions completed or underway include:
The provision of a dedicated resource to support non-profit organizations in building their assets and increasing operational capacity,
The sale of city-owned land at below-market value to non-profit organizations (that provide affordable housing), and
The sale of leased city-owned land to non-profit organizations (that provide affordable housing).
Actions yet to be implemented, that would support the recommendations of this report, include:
Hosting a competition to explore innovative design, operations, or supports in affordable housing, and
Create a proactive land strategy for affordable housing.
Design and Build New City Units
Actions completed or underway include:
Building, partnering or acquiring new City-owned affordable housing units
– 72 units have been occupied since the Strategy’s approval, 64 are
currently in development, and another 200 have been funded, and
Developing a 10-year capital development plan.
Regenerate City-owned Properties
Actions completed or underway include:
Creating a portfolio-wide strategy for all units managed by CHC,
Completing audit requirements, and
Piloting regeneration of properties in CHC’s social housing portfolio.
12 | P a g eStrengthen Intergovernmental Partnerships
Actions completed or underway include:
Advocating for legislative changes to enable the use of new tools to create affordable housing, and planning for utilizing those tools,
Participating in the development of a National Housing Strategy, A Provincial Affordable Housing Strategy, and the Alberta Housing Act, and
Continued advocacy for stable, predictable long-term funding for affordable housing.
Improve the Housing System
Actions completed or underway include:
Participation in the Calgary Community Housing Affordability Collective (CHAC), to support systemic changes in affordable housing delivery, and
Fostering increased public support for affordable housing through proactive communications.
13 | P a g eINTRODUCTION
It is helpful to view housing as a system, where movement and pressure affect all components of the system. The system includes emergency shelters,
transitional and supportive housing, subsidized and below-market rental housing and affordable homeownership programs, through to market rental and
homeownership. Some types of housing can span across different parts of the spectrum, such as co-operative housing. People may move in either direction
along the spectrum depending on circumstances and system changes.
For the purposes of this report, the housing system includes the following types of housing (see Glossary for definitions):
Rental
Emergency Housing Homeownership
Shelters Housing
Non-Market Housing Market Housing
Non-Market Affordable
Rental Housing Homeownership
Housing
Rent supplements
Co-operatives
Figure 1: The Housing System
Methodology
Both primary and secondary research has been used to compile this report. Methods of data collection include phone calls, e-mails, and analysing published data
(e.g. Statistics Canada website) and reports (e.g. CMHC’s Rental Market Report). Efforts have been made to use only credible sources. Wherever possible, data
from 2016 has been used, to align with 2016 Census of Canada data. The focus of geography is on the Census subdivision (CSD)4, as these boundaries typically
align with municipal boundaries, and therefore, municipal authority. Where data was not available for the Census subdivision, the Census metropolitan area
4
Defined by Statistics Canada: Census subdivision (CSD) is the general term for municipalities (as determined by provincial/territorial legislation) or areas treated as municipal equivalents for
statistical purposes (e.g., Indian reserves, Indian settlements and unorganized territories).
14 | P a g e(CMA5) geography was used. Throughout the report the terms ‘city’, ‘municipality’ and ‘CSD’ are used interchangeably. Also, the terms ‘metropolitan area’ and
‘CMA’ are used interchangeably.
It should be noted, that there may be some lack of comparability of data due to different dates, or geographical zones for some of the information provided.
Comprehensive research on housing and municipal tools was not conducted for all cities, and no claim is made to have included all of the data and information
available. The intent was to provide a comparison of supply, affordability and municipal tools across Canada’s eight largest municipalities, such that a more
complete picture can be seen for Calgary, to inform strategic direction.
This research has included some calculations to determine if relationships exist between different types of data. This has been done through correlation
calculations, where one dataset is compared to another dataset. The value of a correlation is always between -1 and +1, and the closer the correlation value is to
+/-1, the stronger the correlation. If there is a positive relationship (a value between 0 and 0.99…), this means that an increase in one variable correlates with an
increase in another variable. If there is a negative relationship, a value less than 0, this means that an increase in one variable correlates with a decrease in
another variable. It is important to understand that correlation does not equal causation – a change in one variable does not necessarily determine a change in
the other. Looking at correlation is a valuable means of understanding if relationships exist, and might mean that one variable is influencing another variable,
however, knowing for certain would require further investigation.
5
Defined by Statistics Canada: A census metropolitan area (CMA) or a census agglomeration (CA) is formed by one or more adjacent municipalities centred on a population centre (known as the
core). A CMA must have a total population of at least 100,000 of which 50,000 or more must live in the core. A CA must have a core population of at least 10,000. To be included in the CMA or CA,
other adjacent municipalities must have a high degree of integration with the core, as measured by commuting flows derived from previous census place of work data.
15 | P a g eCity Profiles Population, Cities, 2016
The eight largest municipalities (cities) in Canada are examined in this report. In order of
population, these are: Toronto, Montreal, Calgary, Ottawa, Edmonton, Mississauga,
Winnipeg and Vancouver. Throughout this report, data is presented in an order consistent Toronto
with the population of the cities. This means that when data is presented in charts, Montréal
Vancouver will be at the bottom. Where data was not available at the CSD (city) level, data Calgary
from the Census Metropolitan Area (CMA) is used, and that data is presented in an order Ottawa
consistent with the population of the CMAs. In these charts, Winnipeg will be at the Edmonton
bottom. Only seven CMAs are included because one of the cities is included in another’s Mississauga
CMA (Mississauga is in the Toronto CMA). Even though Quebec City is the seventh largest
Winnipeg
CMA, it is not included in the report because it does not contain one of the eight largest
Vancouver
cities. The focus is on the city.
0 1,000,000 2,000,000 3,000,000
Calgary is the third largest city in Canada (see Figure 2), with a population of 1,239,220.
The Calgary CMA6 is the fourth largest Census Metropolitan Area in the country (see Figure Figure 2: Population, CSDs, 2016 (Statistics Canada, 2017)
3).
Population, CMAs, 2016
Toronto
Montréal
Vancouver
Calgary
Ottawa - Gatineau
Edmonton
Québec
Winnipeg
0 2,000,000 4,000,000 6,000,000
Figure 3: Population, CMAs, 2016 (Statistics Canada, 2017)
6 (Statistics Canada, 2016) The Calgary CMA includes Calgary, Airdrie, Rocky View County, Cochrane, Chestermere, Crossfield, Tsuu T’ina Nation, Irricana, and Beiseker
16 | P a g eCalgary’s population has nearly doubled since 1986, from 640,645 to 1,246,337 in 2017
Calgary Population 1986-2017
(see Figure 4).
1,300,000
Growth in the last sixteen years has outpaced the other big cities; from 2001 to 2017, the 1,200,000
population in the Calgary CMA grew by over 50%, while the average growth across the
1,100,000
CMAs during the same period was 28% (see Figure 5). Since 2006 Calgary has been one
of the fastest growing cities in Canada, and between 2011 and 2016, Calgary grew at a 1,000,000
rate of 13%, while the average growth rate across the big cities was 6.7% (see Figure 6 ). 900,000
800,000
700,000
FROM 2001-2017 CALGARY’S POPULATION GREW BY 50%, WHILE THE 600,000
AVERAGE GROWTH RATE ACROSS CANADA’S BIG CITIES WAS 28%.
1986
1988
1990
1992
1994
1996
1998
2000
2002
2004
2006
2008
2010
2012
2014
2016
Figure 4: Calgary Population 1986-2017 (The City of Calgary, Civic Census)
Population, % Change 2001-2017, CMAs
Population, % change 2011-2016, CSDs (Cities)
Average Across CMAs Average Across 8 Big Cities
Toronto Toronto
Montréal Montréal
Vancouver Calgary
Calgary Ottawa
Ottawa - Gatineau Edmonton
Edmonton Mississauga
Québec
Winnipeg
Winnipeg
Vancouver
0% 10% 20% 30% 40% 50% 60%
0% 5% 10% 15% 20%
Figure 5: Population, % Change 2001-2017, CMAs (Statistics Canada, 2018)
Figure 6: Population Growth 2011-2016, CSDs (Statistics Canada, 2017)
17 | P a g eCalgary has a relatively low population density, compared with the other big
Population density per square kilometre, 2016
cities, with a population density of 1,500 persons per square kilometer,
compared to the average of 2,709 persons per square kilometer (see Figure
7). In this respect, Calgary may have kept housing costs down through growth Average Across 8 Big Cities
at its edges, however, urban sprawl has disadvantages and “it is now widely Toronto
recognized that it is not sustainable to meet housing demand largely through Montréal
low-density development at the edges of cities.” (Canada Mortgage and Calgary
Housing Corporation, 2018)
Ottawa
Edmonton
Mississauga
Winnipeg
Vancouver
0 1,000 2,000 3,000 4,000 5,000 6,000
Figure 7: Population Density, CSDs, 2016 (Statistics Canada, 2017)
18 | P a g eHOUSING SUPPLY 2001-2016 Net Dwellings Added Per Net Household Added
The primary objective of this research is to compare Calgary’s housing supply to the
housing supply in Canada’s largest cities. Average Across CMAs
Toronto
Between 2001 and 2016, all of the big cities added housing stock at a rate higher than Montréal
growth in households (see Figure 8). However, the timing of development and the type Vancouver
of housing each city has added varies.
Calgary
Ottawa-Gatineau
Calgary’s rate of growth has been high, with dwelling starts generally outpacing all of
Edmonton
the other cities since 2006, when examined as a percentage of existing housing stock
Winnipeg
using 2006, 2011 and 2016 Census data (see Figure 9). Housing activity in oil-
dependent cities like Calgary and Edmonton is tied to crude oil markets (Canada 1 1.05 1.1 1.15 1.2
Mortgage and Housing Corporation, 2018). Ratio of Net Dwellings Added to Net Households Added
Figure 8: 2001-2016 Net Dwellings Added Per Net Household Added (Rose, 2017)
# of Dwelling Starts as a % of Total Dwellings, CMAs
4.5%
Toronto
4.0%
Montréal
3.5%
3.0% Vancouver
2.5% Calgary
2.0%
Ottawa -
1.5% Gatineau
Edmonton
1.0%
0.5% Winnipeg
0.0%
Figure 9: Dwelling Starts as a % of Total Dwellings, CMAs (Canada Mortgage
and Housing Corporation, 2015)
Figure 10: Wildwood affordable housing development ground breaking
19 | P a g eA healthy housing system includes a diverse mix of housing tenures and forms, and
Per cent Owner Households, CSDs (Cities), 2016
this section of the report will examine each of these separately, beginning with
housing tenure.
Average Across 8 Big Cities
Tenure Toronto
Calgary has the second highest homeownership rate among the big cities, at 71% Montréal
(see Figure 11), and the highest rate among the seven largest CMAs, at 73% (see Calgary
Figure 12). This could be due to a high median household income driving market Ottawa
response. Edmonton
Mississauga
Homeownership rates in the CMAs have been relatively stable since 2006, with Winnipeg
moderate increases in Montreal, Quebec City, Winnipeg, and Edmonton, and Vancouver
decreases in Vancouver, Toronto, Ottawa-Gatineau and Calgary (see Figure 13).
0% 20% 40% 60% 80%
Figure 11: Per Cent Owner Households, CSDs, 2016 (Statistics Canada, 2017)
Per cent Owner Households, CMAs, 2016
Average Across CMAs Per cent Change in Rates of Homeownership,
Toronto CMAs, 2006-2016
Montréal Toronto
Vancouver Montréal
Calgary Vancouver
Ottawa - Gatineau Calgary
Edmonton Ottawa–Gatineau
Winnipeg Edmonton
0% 20% 40% 60% 80% Winnipeg
Figure 12: Per Cent Owner Households, CMAs, 2016 (Statistics Canada, 2017) -4% -2% 0% 2% 4% 6%
Figure 13: Per Cent Change in Rates of Homeownership, CMAs, 2006-2016
(Statistics Canada, 2017)
20 | P a g eCalgary has owners and renters in every income bracket, with most households in the higher income brackets owning their home, and most households in the
lower income brackets renting theirs (see Figure 14).
Calgary (CMA), # of Renter Households and Owner Households, by Income,
2015/2016 Owner Renter
300,000
250,000
# of households
200,000
150,000
100,000
50,000
0
Under $10,000 $20,000 $30,000 $40,000 $50,000 $60,000 $70,000 $80,000 $90,000 $100,000
$10,000 to $19,999 to $29,999 to $39,999 to $49,999 to $59,999 to $69,999 to $79,999 to $89,999 to $99,999 and over
Figure 14: # of Renter & Owner Households, Calgary CMA (Statistics
Canada, 2017)
Per cent Renter Households, CSDs (Cities), 2016
IN CALGARY, TENURE AND INCOME ARE LINKED. 83% OF
HOUSEHOLDS WITH INCOMES ABOVE $80,000 OWN THEIR HOME, Average Across 8 Big Cities
WHILE ONLY 16% RENT THEIR HOME. IN COMPARISON, 48% OF Toronto
HOUSEHOLDS WITH INCOMES BELOW $60,000 RENT THEIR HOME, Montréal
AND 52% OWN THEIR HOME. Calgary
Ottawa
Among the eight cities, Calgary has the second-lowest proportion of renter households, Edmonton
at 29% (Mississauga has the lowest, at 28%). The average across the cities is 41% (see Mississauga
Figure 15). These renter households may be renting a variety of homes – from purpose- Winnipeg
built apartments to private condominium rentals to single-family homes. The majority, Vancouver
however, are likely renting in the ‘secondary market’, that is, housing units that were 0% 10% 20% 30% 40% 50% 60% 70%
built for ownership, but have been turned into rentals privately by their owners.
Figure 15: Per Cent Renter Households, CSDs, 2016 (Statistics Canada, 2017)
21 | P a g eThe rental supply across the CMAs was also examined, to account for any differences in
Per cent Renter Households, CMAs, 2016
data between the two geographies. Among the CMAs, Calgary has the lowest proportion
of renter households, at 27%. The average across the CMAs is 34% (see Figure 17).
Average Across CMAs
The supply of purpose-built rental stock in the Calgary CMA is very limited, and is far
Toronto
below the numbers in all the other cities. Only 7% of dwelling units in the Calgary CMA
Montréal
are purpose-built rental, the lowest across the seven CMAs, where the average is 16%
Vancouver
(see Figure 18). This may be an artefact of the relative size of the city during the ‘MURB
Calgary
era’7; Calgary was a small city compared to some of the other major cities when the bulk
of rental housing was built under the MURB program from 1974-1981. Ottawa - Gatineau
Edmonton
Winnipeg
0% 10% 20% 30% 40% 50%
Figure 17: Per Cent Renter Households, CMAs, 2016 (Statistics Canada, 2017)
Purpose-Built Rental Stock, as % of all households,
CMA, 2016
Average Across CMAs
Toronto
Montréal
Vancouver
Calgary
Ottawa-Gatineau
Edmonton
Figure 16: Whitehaven Manor acquisition
Winnipeg
0% 10% 20% 30% 40%
Figure 18: Per Cent Purpose-Built Rental Stock, CMAs, 2016 (Canada Mortgage
and Housing Corporation, 2016)
7
The ‘MURB Era’ refers to a period in time from 1974-1978 and 1980-1981 when Multi-Unit Residential Buildings were incentivized through Federal tax shelters.
22 | P a g eVacancy rates have been quite high in Calgary since 2015 (Canada Mortgage and
Average Vacancy Rate (%) for a Two-Bedroom Housing Corporation, 2017), and are currently the highest of the cities, at 7.7% (see
Apartment, 2016 Figure 19). A vacancy rate of 3% is typically considered a balanced rental market.
Average Across 8 Big Cities
The age of rental stock varies across Canadian cities. For rental units in the lowest rent
Toronto
quintile, suitable for lower-income households, the average age of units is 54 years
Montréal
Calgary
across the seven largest CMAs. Calgary’s lowest quintile rental units are
Ottawa comparatively young, at an average age of 45 years (see Figures 20 and 21). While
Edmonton these units are young relative to the other cities, they are still approaching an age
Mississauga where they may be in need of considerable renovation or redevelopment. The age of
Winnipeg the lowest priced rental units in Toronto, Montreal, Ottawa-Gatineau and Winnipeg is
Vancouver likely a concerning factor for these metropolitan areas.
0 2 4 6 8 10
Figure 19: Vacancy Rates, Average 2-bedroom Apartment, 2016 (Canada Mortgage
and Housing Corporation, 2016)
Average Age of One-Bedroom Average Age of Three-Bedroom
Units in the Lowest-rent Quintile, CMAs, 2015 Units in the Lowest-rent Quintile, CMAs, 2015
Toronto Toronto
Montréal Montréal
Vancouver Vancouver
Calgary Calgary
Ottawa-Gatineau Ottawa-Gatineau
Edmonton Edmonton
Winnipeg Winnipeg
0 10 20 30 40 50 60 70 0 10 20 30 40 50 60 70
Figure 20: Average Age of Units in Lowest Rent Quintile, 1-Bdrm (Canada Figure 21: Average Age of Units in Lowest Rent Quintile, 3-Bdrm (Canada Mortgage and
Mortgage and Housing Corporation, 2015) Housing Corporation, 2015)
23 | P a g eResearch done by CMHC in 2017 found that for purpose-built rental construction, Calgary has one of the highest development costs in the country, stating that
even for a basic project with 50 units, development costs come in around $313 per square foot. The CMHC report concludes that the economics of new rental
development, across the country, is challenged – citing low cash-on-cash returns for new rental development in markets studied (Canada Mortgage and Housing
Corporation, 2017).
CALGARY HAS ONE OF THE HIGHEST DEVELOPMENT COSTS IN THE
COUNTRY FOR PURPOSE-BUILT RENTAL CONSTRUCTION. THE
ECONOMICS OF NEW RENTAL DEVELOPMENT IS CHALLENGED.
24 | P a g eAmong the eight cities, Calgary has the lowest proportion of households living in
Per cent Subsidized Households, CSDs (Cities), 2016
subsidized housing, at 2.9%. The average across the eight cities is 5.3% (see Figure
22). It should be noted that this is likely more a reflection of supply than of Average Across 8 Big Cities
affordable housing need. For example, in Calgary there are over 4,000 households Toronto
on waiting lists for affordable housing. Montréal
Some of the key findings from The City of Calgary’s Housing in Calgary: An Inventory Calgary
of Housing Supply, 2015/2016 include: Ottawa
Edmonton
Nearly eighty per cent of non-market units are over 25 years old,
Mississauga
Non-market units are not geographically distributed in the city; More than
half of Calgary’s residential communities have zero non-market housing, Winnipeg
Less than 7% of units built in the past 25 years have 3 or more bedrooms, Vancouver
and 0% 2% 4% 6% 8%
Twenty-five per cent of the units have an operating agreement that will
expire within five years. Figure 22: Per Cent Households in Subsidized Housing, CSDs, 2016 (Statistics Canada, 2017)
The supply of subsidized housing was also examined across the CMAs, to account for Per cent Subsidized Households, CMAs, 2016
any differences in data between the two geographies. Among the CMAs, Calgary has
the lowest proportion of subsidized households, at 2.7%. The average across the Average Across CMAs
CMAs is 4.3% (see Figure 23). Toronto
There is a strong negative correlation (-0.753) between median household income Montréal
and the proportion of households in subsidized housing in the cities. This means that Vancouver
the cities with higher median household incomes have lower proportions of Calgary
households in subsidized housing.
Ottawa - Gatineau
Edmonton
Winnipeg
0% 2% 4% 6%
Figure 23 Per Cent Households in Subsidized Housing, CMAs, 2016 (Statistics Canada,
2017)
25 | P a g eFinally, in the eight big cities, Calgary emerges as having the lowest supply of co-
Co-operative Housing, as a % of Total Households, 2017
operative housing, at 1,294 units, representing 0.3% of Calgary’s housing stock.
The average across the cities is 1.0% (see Figure 25). While co-operative housing
doesn’t comprise a large proportion of housing supply in any of the cities, it does Average Across 8 Big Cities
fill an important niche, providing affordable homes for thousands of households. Toronto
Montréal
Co-operative housing is housing with joint membership. It is different than a
Calgary
condominium in that the co-operative, a legal association, is on title, and
membership in the co-operative is determined by a board. Once approved, new Ottawa
members purchase a share in the co-operative. Edmonton
Mississauga
Winnipeg
Vancouver
0.0% 0.5% 1.0% 1.5% 2.0% 2.5%
Figure 25: Per Cent Co-operative Housing, CSDs, 2017 (Co-operative Housing Federation
of Canada, 2017)
Figure 24: Alberta 75 Housing Co-operative
26 | P a g ePer cent Occupied Dwellings that are Single Family, 2016
Form
In looking at the housing form in the eight big cities, a few differences emerge.
Average Across 8 Big Cities
Toronto
Single-Family Dwellings
Calgary has a significantly higher than average proportion of households living in Montréal
single-family housing, at 56%. The average across the cities is 36.5%, with wide Calgary
variation (see Figure 26). Ottawa
Edmonton
This research found a strong positive correlation (0.76) between median household Mississauga
income and the proportion of households living in single-family housing. This means Winnipeg
that the cities with the highest household incomes also typically have the highest Vancouver
proportion of single-family housing.
0% 20% 40% 60% 80%
Other Attached Dwellings Figure 26: Per Cent Single-Family Housing, CSDs, 2016 (Statistics Canada,
36.2% of Calgary’s households are living in dwelling units defined as “other 2017)
attached” – these comprise semi-detached homes, row houses, apartments or
Per cent of Occupied Dwelling Units that are "Other
duplexes, and units in low-rise apartment buildings. These types of housing are often
Attached" - also known as the "missing middle", 2016
referred to as the “missing middle”. The average across the big cities is 43.3% (see
Figure 27). Average Across 8 Big Cities
Toronto
Montréal
Calgary
Ottawa
Edmonton
Mississauga
Winnipeg
Vancouver
0% 20% 40% 60% 80% 100%
Figure 27: Per Cent Missing Middle, CSDs, 2016 (Statistics Canada, 2017)
27 | P a g eHigh-Rise Apartments
The proportion of households living in high-rise apartment buildings – buildings with 5 or more stories, is significantly lower in Calgary than in the other big cities
(see Figure 28). 7% of Calgary’s households live in high-rise apartment buildings, while the average across the big cities is 20%. In contrast, 44% of Toronto’s
households live in high-rise apartment buildings.
Per cent of Occupied Dwelling Units that are High-Rise
Apartments, 2016
Average Across 8 Big Cities
Toronto
Montréal
Calgary
Ottawa
Edmonton
Mississauga
Winnipeg
Vancouver
0% 10% 20% 30% 40% 50%
Figure 28: Per Cent High-Rise Apartments, CSDs, 2016 (Statistics Canada,
2017)
Figure 29: Lumino affordable housing development
28 | P a g eHOUSING AFFORDABILITY Per cent of Households in Core Housing Need,
Measures of Affordable Housing Need 2015/2016
Housing affordability is a general measure of how affordable housing is. For housing
Average Across 8 Big Cities
to be affordable, the Canada Mortgage and Housing Corporation says a household
Toronto
should not spend more than 30 percent of gross income on rental shelter costs, and
Montréal
no more than 32 percent of gross household income on homeownership. It is also
Calgary
often used in relation to the cost of housing provided by the market, e.g. entry-level
Ottawa
home prices.
Edmonton
CMHC’s definition of core housing need is: “a household is in core housing need if its Mississauga
housing does not meet one or more of the adequacy, suitability or affordability Winnipeg
standards, and it would have to spend 30% or more of its before-tax income to Vancouver
access acceptable local housing. Acceptable housing is adequate in condition,
0 5 10 15 20 25
suitable in size, and affordable. ‘Adequate housing’ does not require any major
repairs, according to residents. ‘Suitable housing’ has enough bedrooms for the size Figure 30: Per cent Households in Core Housing Need, 2015/2016 (Statistics
Canada, Canada Mortgage and Housing Corporation, 2017)
and makeup of resident households, according to National Occupancy Standard (NOS)
requirements. ‘Affordable housing’ costs less than 30% of before-tax household Per cent of Households Spending 30% or More of
income.” (Canada Mortgage and Housing Corporation, 2016) Household Income on Shelter Costs, 2015/2016
Among the eight big cities, Calgary has the lowest proportion of households in core Average Across 8 Big Cities
housing need, at 11.8%; the average is 16% (see Figure 30). Also, Calgary ties with Toronto
Winnipeg for having the lowest proportion of households spending 30% or more of
Montréal
their income on shelter costs, at 22%, while the average across the cities is 28% (see
Calgary
Figure 31). This does not mean that Calgary doesn’t have affordability pressures –
Ottawa
these measures simply look at how the city is doing on average.
Edmonton
Mississauga
Winnipeg
Vancouver
0% 10% 20% 30% 40%
Figure 31: Per cent Households Overspending, 2015/2016 (Statistics Canada, 2017)
29 | P a g eCore housing need grew in Calgary faster than any other big city from 2006 to
Per cent Change in Households in Core Housing Need
2016, at 26% compared to an average of 3.4% (see Figure 32). It should be noted,
2006-2016
however, that this was an increase from 9.4% to 11.8%. Additionally, while the rate
of core housing need declined in Toronto, Montreal and Vancouver, the absolute
Average Across 8 Big Cities
decline was small (for example, from 23.7% to 23.3% in Toronto).
Toronto
These changes may actually be significantly impacted by the methodology used to Montréal
estimate core housing need. In a low vacancy market, core housing need
Calgary
underestimates actual need. Core need estimates are derived by matching
Ottawa
households with suitable rental housing using household incomes and average
market rent. If a household’s income does not match the rent required for a Edmonton
suitable unit, that household is counted as being in core housing need. However, in Mississauga
a low vacancy market, households that could theoretically afford a rental unit that Winnipeg
suits their household composition (i.e. enough bedrooms for all family members),
Vancouver
might not be able to actually find that rental unit, because the supply is limited.
When discussing core housing need, users should consider vacancy rates, and -20% -10% 0% 10% 20% 30%
therefore, actual availability of units. This is especially exaggerated in a high-income
Figure 32: Per cent Change in Core Housing Need, 2006-2016 (Statistics Canada,
city. When looking at Figure 32, it should be noted that vacancy rates for 2- Canada Mortgage and Housing Corporation, 2017)
bedroom apartments in Calgary in 2006 were 0.5%, whereas in 2016 they were
7.7% (Canada Mortgage and Housing Corporation, 2017), (Canada Mortgage and Housing
Corporation, 2006). Therefore, actual housing need was likely underestimated in 2006 for
Calgary, and is likely underestimated in 2016 for Toronto, Vancouver, Mississauga and
Winnipeg (as the vacancy rates in 2016 were below 3%, indicating an unbalanced market).
Figure 33: Vista Grande affordable housing development
30 | P a g eCost of Housing
According to data compiled by CMHC, the average home price in the resale
Average Rent for a Bachelor Apartment, 2016
market across the seven largest CMAs was $503,341 in 2016; for Calgary it
was $463,047. Vancouver is by far the most expensive city to buy a home in,
with an average resale price of $1,017,228 in 2016, while Winnipeg is the least Average Across 8 Big Cities
expensive (see Figure 34). Toronto
Montréal
Average resale prices are strongly correlated (0.88) with the incidence of Calgary
overspending in the metropolitan areas, meaning that cities with the highest Ottawa
home prices also have the highest incidence of households overspending. Edmonton
Mississauga
When looking at average rents across the cities, Calgary sits in the middle (see
Winnipeg
Figure 35 and Figure 36). Average rent for a bachelor apartment in Calgary is
Vancouver
$859, while the average across the eight cities is $831. Average rent for a two-
bedroom apartment in Calgary is $1,260, while the average across the cities is $0 $200 $400 $600 $800 $1,000 $1,200
$1,241. Figure 35: Average Rent for a Bachelor Apartment, 2016 (Canada Mortgage
and Housing Corporation, 2016)
Average Home Price in Resale Market, 2016
Average Rent for a 2-bedroom Apartment, 2016
Average Across CMAs
Average Across 8 Big Cities
Toronto Toronto
Montréal Montréal
Vancouver Calgary
Calgary Ottawa
Ottawa - Gatineau Edmonton
Mississauga
Edmonton
Winnipeg
Winnipeg
Vancouver
$0 $200,000 $400,000 $600,000 $800,000 $1,000,000
$0 $500 $1,000 $1,500 $2,000
Figure 34: Average Resale Prices, CMAs, 2016 (Canada Mortgage and Housing
Corporation, 2017) Figure 36: Average Rent for a 2-bedroom Apartment, 2016 (Canada Mortgage and
Housing Corporation, 2016)
31 | P a g eWhile vacancy rates have been quite high in Calgary since 2015 (Canada Mortgage and Housing Corporation, 2017), and are currently the highest amongst the
cities, rents have not declined substantively. According to the latest publication of CMHC’s Rental Market Report, average two-bedroom rent declined by 0.9%
($11) from 2016 to 2017, and sample-sample rents for 2-bedroom units declined by 1%. Sample-sample rents are rents for units common to both the 2016 and
2017 survey.
A HOUSEHOLD WOULD NEED TO EARN AN ANNUAL INCOME
OVER $50,000 TO BE ABLE TO AFFORD AN AVERAGE 2-
BEDROOM APARTMENT IN CALGARY.
A PERSON WORKING FULL-TIME EARNING MINIMUM WAGE
IN ALBERTA EARNS JUST OVER $28,000 PER YEAR.
Figure 37: Crescent Heights affordable housing development
32 | P a g eA CLOSER LOOK AT CALGARY Median Household Income, 2015
At first glance, Calgary appears to be doing well compared to the other cities when looking
Average Across 8 Big Cities
at the averages for measures of need (lowest incidence) and housing costs (comparable to
average). However, looking only at the averages of these variables masks the significance of Toronto
their distribution. Further analysis shows that Calgary is facing particular challenges. Montréal
Calgary
High Household Income
Ottawa
Calgary has enjoyed some of the highest household incomes in Canada’s big cities for many
Edmonton
years; in 2015 the median household income was $97,334, while the average across the
cities was $75,418 (see Figure 38). Figure 39 helps illustrate what this high median income Mississauga
means for Calgary – put simply, there are just as many households in the Calgary Winnipeg
metropolitan area with a household income over $100,000 as there are total households Vancouver
with a household income less than $100,000.
$0 $20,000 $40,000 $60,000 $80,000 $100,000 $120,000
Figure 38: Median Household Incomes, 2015 (Statistics Canada, 2017)
Why Does High Household Income Matter?
# of Households by Income, Calgary CMA,
High incomes are a fundamental factor in increases to home prices - 2015/2016
“In oil dependent provinces, changes in disposable income are closely
tied to changes in oil prices, which therefore influences the amount of
income available to spend on housing” (Canada Mortgage and Housing
Corporation, 2018) $100,000+;
259,145You can also read