HOUSING BOSTON 2020 - Boston.gov
←
→
Page content transcription
If your browser does not render page correctly, please read the page content below
HOUSING BOSTON 2020
     A blueprint for building 30,000 units of housing
                                    by the year 2020

                                          Prepared by:

          The Department of Neighborhood Development

                    The Boston Redevelopment Authority

                            The Boston Housing Authority

      Mayor's Office of Environmental and Energy Services

                         Boston Fair Housing Commission
Acknowledgements

  Housing Boston 2020 Advisory Panel:

     Eric Belsky, Managing Director for Housing Studies, Harvard University
     Gail Latimore, Executive Director, Codman Square NDC
     Janelle Chan, Executive Director, Asian CDC
     Joe Kriesberg, President and CEO, MACDC
     Lisa B. Alberghini, President, POUA
     Mark Erlich, Executive Secretary-Treasurer, NECU
     Michael Roberts, Vice President – Development, Avalon Bay
     Tamara Roy, Senior Associate Principal, ADD Inc.
     Thomas Callahan, Executive Director, MAHA
     Thomas R. Gleason, Executive Director, MassHousing

     Bill McGonagle, Director, Boston Housing Authority
     Peter Meade, Director, Boston Redevelopment Authority
     Sheila Dillon, Chief and Director, Dept. of Neighborhood Development
     Brian Swett, Chief of Environment and Energy
     Dion Irish, Director, Office of Civil Rights

  Housing Boston 2020 Working Groups:

     Curtis Kemeny, CEO and President , Boston Residential Group
     Ann Verrilli, Director of Research, CHAPA
     Bart Mitchell, Chief Executive Officer, The Community Builders
     Brenda Clement, Executive Director, CHAPA
     Brian Doherty, Project Coordinator,
              Boston Metropolitan District Building Trades Council
     Clark Zeigler, Executive Director, Massachusetts Housing Partnership
     Doug Arsham, Development Manager, Forest City
     Ed Nardi, President, Cresset Group
     Joe Flatley, President and CEO, Massachusetts Housing Investment Corporation
     Joseph Shea, Senior Vice President/Operating Partner, Roseland Property
     Larry Curtis, Managing Partner, Winn
     Ling Yi Liu, Founder, Abodez
     Mark Curtiss, Managing Director , Massachusetts Housing Partnership
     Peter Munkenbeck
     Peter Sougarides, Executive Vice President of Development, Samuels & Associates
     Sue Connelly, Director of Community Housing Initiatives,
              Massachusetts Housing Partnership
     Young Park, President & Principal, Berkley Investments
     Matt Wally, Community Development Manager - Southern New England, TD Bank
     Rick High, President, Corcoran Group

                                                                       1
Dear Friends:
Since the first Leading the Way housing plan was launched in 2000, we have created and
preserved more than 20,000 units of housing - an accomplishment equivalent to creating
the entire housing stock of the Town of Brookline within Boston’s borders.
That was a tremendous achievement, and today, we gather to talk about how to do even
more.
Boston 2013 is a remarkably different city than it was in 2000, with shifting demographics
and changing needs. Our city is thriving, and well positioned to meet its bright future.
But one thing has not changed. In order to fulfill its promise, Boston needs to continue
our relentless focus on building housing. This is not just the simple matter of putting roofs
over people’s heads; we need to build strategically, creating the right kind of housing for
the next decade.
Housing in Boston is an issue that touches every single citizen. Children need a place to
call home so that they can succeed in school. Families need homes where they can gather
to create and sustain the traditions of their culture. Seniors need housing that can
support them as they age in place, so they may continue to call Boston home. And our
college students, who add so much to the vibrancy of our city, need to be housed in ways
that enhance and support our neighborhoods.
Housing Boston 2020 is intended to be a blueprint for the creation of 30 thousand units of
housing, but it is much more than that. While this document serves as the action plan for
the remaining days of this administration, it also is a guide to the challenges facing an
incoming administration – and our proposed solutions for those issues.
I have learned so much about what it takes to grow a city in these last 20 years, and chief
among those lessons is that access to safe, affordable housing tops the list of things that
make cities great. My deepest thanks go out to the members of the Advisory Panel, the
members of our Working Groups, and the City staff who spent so much time and effort
helping create this plan to make that vision a reality.
Never stop working on these critical issues. The future of Boston depends on them.
Sincerely,
Thomas M. Menino, Mayor
City of Boston
2Executive Summary
From 2000 – 2010, Boston posted its greatest increase in its housing supply in 50
years, adding 20,000 new units, representing $6.1 billion in private and public
investment. Thirty percent of those new units were affordable, resulting in
Boston having a higher ratio of affordable housing stock than any other major city
in America.
Yet for all of these accomplishments, the City still faces challenges as it moves
through the decade of the 2010s:
• 23,000 very low income households are paying more than half of their
income for housing and are considered at risk of becoming homeless; yet
some of the federal resources that fund the production of housing for
very low income housing have already been cut by 35 – 45 percent;
• 100,000 net new jobs are expected to be created in Boston by 2020.
Those jobs, combined with a rising preference of workers to live in the city
rather than the suburbs, are expected to generate demand for 28,000
new units. The primary growth demographics are expected to be empty-
nesters and seniors; 20-34 year-olds; and downtown families;
• Housing is a critical factor in Greater Boston’s economic engine.
Employers are attracted by our generous supply of high-skill university
graduates, yet if we lose these graduates in large numbers to lower-cost
cities, one of the great economic advantages of our metropolitan area
could be seriously diminished;
• Boston has a smaller middle class than the state or the nation, and our
middle class is increasingly squeezed as house prices rise at double the
rate that incomes are growing. The middle class is being priced out of
homeownership in more and more neighborhoods, and is increasingly in
competition with lower-wage workers for housing in the more affordable
neighborhoods;
• Boston’s nation-leading inventory of 52,000 units of affordable housing is
increasingly at risk, due to declining federal operating support for public
housing, capital obsolescence and expiring affordability restrictions.
3• While dorm production during the decade of the 2000s has reduced the
need for off-campus housing by 22 percent, Boston’s colleges and
universities still have more than 27,000 students living in off-campus
housing in Boston.
This student housing demand is highly concentrated in just a few areas,
and in those areas the market pressures from students are substantial.
To address these challenges, the city will seek to put into action a number of policies
to meet the city’s evolving housing needs through the year 2020. These policies
represent $16.5 billion in housing investment over ten years. Some of these polices
can be put in place in 2013, while others will need to be evaluated and adopted by a
new administration starting in 2014.
Accommodating Growth
This plan calls for the addition of 30,000 new units of housing in the decade of the
2010s. 25,000 of these will be unrestricted private market rate units that will
require $11.4 billion in new private investment in Boston. The primary strategies
to promote the development of these 25,000 units will include:
• Enabling developers to deliver more non-luxury units at a lower price
point
• Helping developers to better meet the specific housing needs and
preferences of Boston’s growth demographics: seniors, 20-34s, and
downtown families.
To advance this agenda, by the end of 2013 the City will:
• Development Pipeline. In addition to the 5,332 market-rate units
that have started construction and the 9,112 that have been
approved but not permitted, 3,600 more market-rate units are
awaiting zoning approval from the BRA. The City will approve those
that have been appropriately reviewed by the community and have
met the BRA’s design standards.
4• Housing Cost Drivers Study. To understand how the city can best
enable developers to produce more housing at a lower price, the City
will commence a study to identify the key cost-drivers for housing
production in Boston. This study will also identify those costs that
can be beneficially influenced by City action.
• Parking Options Study. To further help reduce the costs of producing
housing, the City will seek to find more efficient ways to manage the
need for off-street parking.
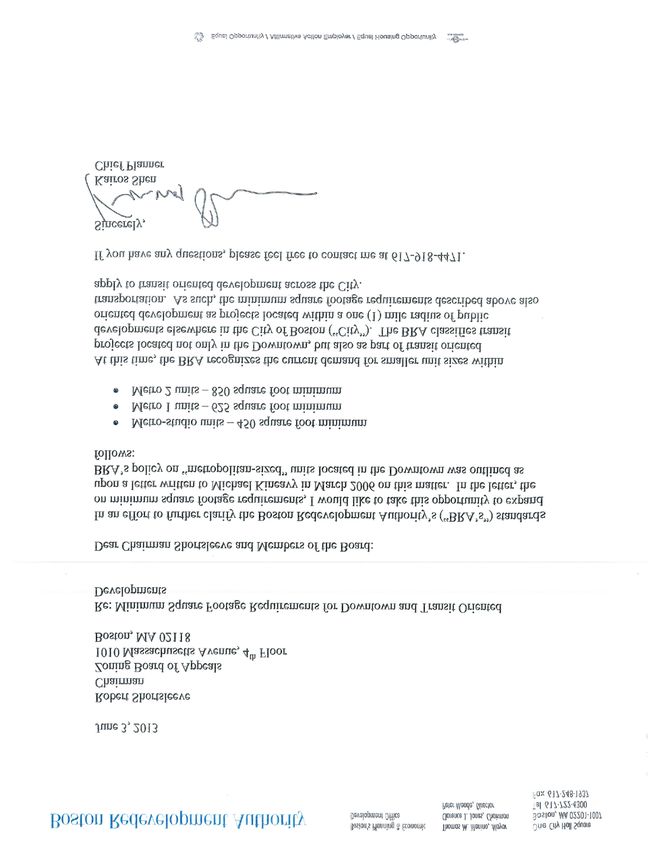
• Unit Sizes. The City will implement the new smaller unit size
standards that were approved by the BRA in July 2013.
• Design for Our Demographics. To facilitate the creation of housing
that more optimally meets the needs of Boston’s growth
demographics (empty nesters and seniors, 20-34s, and downtown
families) the City will start convening design experts to look
worldwide for new approaches and best practices.
It is recommended that, starting in 2014, the City should:
• Zoning Update. Based on the results of the cost-drivers study, update the
provisions in the Zoning Code to allow for more cost-efficient development
while ensuring designs that are compatible with the surrounding community.
• Labor Participation. Work with unions to reduce labor costs on
affordable and workforce housing projects, while also seeking to
strengthen the City’s capacity to enforce workforce agreements that
developers made as a part of the permitting process.
Expanding Housing For The Middle Class
Establish a new 5,000-unit, $1.5 billion dollar middle class housing initiative to
expand the supply of housing affordable to the middle class and improve their
ability to buy a home in the existing housing market.
5Key strategies will include:
• Stimulating new middle-class housing production through the disposition
of more publicly owned real estate;
• Creating new zoning incentives to promote more housing production in
middle-class affordable neighborhoods;
• Offering improved homebuyer assistance services to help middle class
buyers compete in the market.
To advance this agenda, by the end of 2013 the City will:
• Boston Buyer’s Advantage Program. Launch a new homebuyer assistance
program and create a new Boston Homebuyers Club to enable middle-class
homebuyers compete more successfully in the market.
• Public Real Estate Review. Create an inventory of all City, State and Federally
owned real estate that could be suitable for middle-class housing
development in the neighborhoods.
• Middle Income Housing Initiative. Put a half million square feet of City
owned real estate on the market for unsubsidized middle income small-scale
homeownership development under the Middle Income Housing Initiative
launched by Mayor Menino at the start of 2013.
It is recommended that, starting in 2014, the City should:
• Middle Class Incentive Zoning Program. Create a new zoning product that
provides expedited reviews and density bonuses for creation of middle-
income targeted housing, especially near transit nodes and bicycle corridors.
• Expanded Middle Income Housing Initiative. Based on the results of the
Public Real Estate Review, expand beyond the current one-million square foot
target by including more City, State and Federal lands for middle income
development. Extend the initiative through 2020.
6• Middle Class Housing Access Fund. Explore the potential of using some
Inclusionary Cash-Out funds to establish a buydown program, enabling
middle-class homebuyers to access neighborhoods where they are largely
priced out, in exchange for long-term middle class affordability restrictions.
Affordable Housing for Boston’s Workforce
Create 5,000 new units of affordable, deed-restricted housing; maintain the BHA’s
97 percent occupancy rate despite declining resources and an aging stock and
reduce greenhouse gas emissions in the BHA-owned portfolio by 25 percent; and
lose no more than 5 percent of the privately-owned affordable housing stock to
physical decay or affordability opt-outs.
The new affordable housing strategy will require approximately $2.1 billion in
governmental and private financing.
About 2,000 units are projected to be created in market rate developments
through the Inclusionary Development Policy, and 3,000 units will be the result of
City-assisted affordable housing development. Those 3,000 units are expected to
cost $1.2 billion to build, and will require $559 million of gap funding from City,
State and Federal sources.
If Federal cuts to housing programs continue as expected, the City will need to
identify an additional $81 million dollars in new revenues or cost reductions to
make up for the Federal cuts if the 5,000-unit target is to be achieved.
Key elements of the City’s strategy are:
• Offset Federal cuts with more locally-generated resources
• Bring down the costs of producing affordable housing by reducing high-
cost design requirements and allowing more efficient development
models.
7To advance this agenda, by the end of 2013 the City will:
• Update Linkage. Update the Linkage fee to adjust for inflation. Increase by
$.47 per square foot to a new rate of $8.34 per square foot.
• Inclusionary Development Policy. Begin to codify the Inclusionary
Development Policy into law by filing a Home Rule Petition from the Boston
City Council to the State Legislature. Execute a companion Executive Order to
govern the program in a manner consistent with the Home Rule Petition in
the interim until Legislative approval is received.
• Revenue Research. Research best practices that other cities have used to
raise affordable housing resources from non-traditional sources.
• Rental Housing Finance Product. Working with State agencies, develop a fast-
track rental financing product using underutilized resources such as 4 percent
Housing Tax Credits to accelerate development of highly-cost-efficient
projects.
• Design & Development Practices. Revise design and development standards
for affordable housing to lower production costs and allow more cost-
effective production methods such as the Design-Build model that is often
used in market-rate development.
It is recommended that, starting in 2014, the City should:
• Linkage. Reassess the Linkage program, and if appropriate, file a Home Rule
Petition to update Linkage to reflect more closely the current costs of
producing affordable housing.
• Inclusionary Development Cash-Out Policy. Once enacted into State Law,
rework the Cash-Out component to provide greater revenue for housing and
greater cost-certainty to developers.
• Community Preservation Act. Seek to put a 1 percent Community
Preservation Act vote on the ballot in 2014. Here in Massachusetts, 148 other
communities have already passed such measures.
8• Senior Housing Task Force. Establish a task force of key stakeholders to
develop new housing strategies for seniors that addresses three key issues:
o Declining federal funding for assisted senior housing, exactly when
there is a major increase in the senior population;
o The need to help seniors downsize into more affordable and
sustainable housing within their community; and
o The rising need for assistance to help seniors age in place.
• Affordable Housing Energy & Greenhouse Gas Initiative. Implement the
HUD’s Green PHA Assessment at the BHA and disseminate best practices from
this effort to other affordable housing operators.
College & University Housing
House 10,000 more full time students and further reduce the number of students
living in off-campus housing, which will require about $1.5 billion in new
investment by Boston’s colleges and universities. There are no specific actions
recommended for implementation in 2013, but for a new administration starting
in 2014, the following actions are recommended:
• Institutional Housing Plans. Require all colleges to create a plan showing how
each college will, over time, reduce its reliance on the private rental housing
stock to house its students and their families, especially underserved
populations such as graduate students and students from moderate-income
families that cannot afford high dorm fees.
• Co-Development. Support, but properly regulate, new forms of student
housing production, including co-development models where private
developers create housing that is leased back to the college.
• Linkage. Modify the Linkage program to reflect the much greater impact on
the housing market that college expansion has compared to all other forms of
commercial development
9Table of Contents
Overview……………………………………………….. 11
Market Rate Housing………………………………… 13
The Middle Class……………………………………... 20
Affordable Housing………………………………….. 25
College and University Housing………………… 34
Appendices……………………………………………. 38
10Boston: “Leading the Way” since 2000
Boston has long been a national leader in the area of housing. Since
2000, Mayor Menino’s Leading the Way initiatives have helped
transform Boston’s housing economy with a balanced growth agenda
that serves all Bostonians. From 2000 to 2010:
More than 20,000 new units of housing were completed,
injecting $6.1 billion of investment into the economy;
6,100 units, or 30 percent of all new housing production, was set
aside as affordable housing;
With 22 percent of its housing stock now dedicated to affordable
housing, Boston has the highest affordable housing ratio of any
major city in America 1;
More than 10,000 new dorm beds were created, freeing up
apartments for neighborhood families.
A Changing City
Boston is a rapidly shifting city, which requires a new plan to ensure that
all Bostonians have access to the right kind of housing. More families are
living downtown; more workers are choosing to avoid suburban
commutes by living closer to their jobs in Boston; and Boston’s growing
workforce is young and well-educated, well-positioned to drive the city’s
innovation-based economy forward.
At the same time, Boston will also see a rising number of seniors in the
coming years, particularly because so few Bostonians - only 20 percent -
move away when they retire. Boston is a city that is becoming both
younger and older at the same time.
In addition to accommodating growth, other challenges lie ahead.
Middle class homebuyers are being priced out of more and more
neighborhoods, while they are increasingly in competition with investors
for more affordably-priced homes.
1
See Research Appendix 1 for a comparison of Boston’s affordable housing share compared to other major
cities
11And Boston has more than 23 thousand low-income renter households
who pay more than 50 percent of their household income for rent – a
group at high risk of homelessness.
To appropriately meet the evolving housing challenges that Boston will
face in the decade of the 2010s, a new set of housing strategies is
needed. Specifically, this strategy must address four priority issues:
Accommodating new growth and changing demographics
through market rate housing production
Expanding housing options for the middle class
Creating and preserving affordable housing for those in
Boston’s workforce who are not served by the market
Mitigating the impacts of colleges and universities on Boston’s
housing market
Homelessness: Although housing is a key factor that affects homelessness,
this strategy will not directly address this issue. A new, three year
homelessness strategy is being developed on a parallel track. It will address
both the housing and non-housing policies (e.g. outplacement from
institutions, workforce development, and eviction intervention) that can
reduce homelessness in Boston.
12Market Rate Housing Production: Background
Boston’s specialization in the fast-growing professional, scientific, and
technical economic sectors generated 14,460 new jobs in Boston in 2011.
This 2.2 percent growth in Boston’s job base brought the total number of
jobs in Boston to a near-record count of 675,000, and virtually erased all
of the job losses from the 2008-2010 recession. Those new jobs
generated demand for more than 4,000 new units of housing, driving
down vacancy rates and putting upward pressure on rents and prices.
As a place to live, Boston is proving to be increasingly attractive to those
who work here. More and more Boston workers are choosing to avoid
long commutes by living in the city. The workforce residency rate – the
share of Boston workers who live in Boston - increased from 34 percent
in 2000 to 39 percent in 2011.
From 2011 through 2020, it is conservatively projected that Boston’s
job base will rise by around 100 thousand net new jobs – a climb of
about 1.35 percent job growth per year. It is estimated that this
growth, combined with Boston’s rising workforce residency rate, will
result in demand for approximately 30,000 new units of housing 2.
Our demographic projections indicate the greatest population growth will
occur in three sectors: 20-34 Year-Olds, Empty-Nesters & Seniors, and
Downtown Families.
20-34s: Drivers of the New Economy
Between 2000 and 2010, Boston’s attractiveness as a place to go to
school and start a career resulted in a net in-migration of almost 70
thousand 20-34 year-olds 3. Boston now has a higher percentage of young
people (20-34) than any of the other 25 largest cities in the country.
2
100,000 jobs divided by 1.3 jobs per household (average from 2010) multiplied by a 39% percent residency
rate in 2011 results in a projected housing demand in Boston of 30,000 units from 2011 through 2020.
3
See Research Appendix 2 for more information about in- and out-migration from Boston during the period
2000-2010
13This trend presents an opportunity for Boston. More young people are
choosing Boston as a place to learn and as a place to live, and are, in the
process, helping propel Boston’s innovations-based economy. Proposed
immigration reform could substantially reinforce this trend by allowing
more of Boston’s high-skilled international students to remain in Boston
after they graduate.
In a new American economy where education is the most valuable
resource, Boston is better positioned for growth than most cities in the
country. Yet high housing costs could pose a serious obstacle to
Boston’s ability to capitalize on these educational advantages. If an
unaffordable housing market drives our new graduates away to more
affordable parts of the country, Boston’s employers will not have the
skilled workforce that they need to grow Boston’s economy.
For Boston to continue to serve as the economic engine for the region, it
cannot ignore the housing and social needs of this population.
Developers need to be able create housing that is right-sized and right-
priced. In planning, Boston also needs to make sure that it offers
communities the right mix of housing, entertainment, and services to
meet the needs of this group.
Empty-Nesters & Seniors
As the baby-boom generation has aged, the count of people in Boston
aged 55–64 (typically the “empty-nester” cohort) has risen by 37 percent
– from 41 thousand in 2000 to 56 thousand in 2010. As these empty-
nesters move into retirement during the decade of the 2010s, new
housing challenges will emerge. Historically, Boston retains 80 percent
of its empty-nesters as they move to retirement. If that retention rate
continues, there could be as many as 13 thousand more retirees in
Boston by 2020.
Retirees present a special challenge for Boston’s housing market. While
the labor force participation rate among seniors has risen substantially –
from 10.9 percent in 2000 to 17.6 percent in 2010, and could easily reach
25 percent by 2020, most seniors do leave the labor force. While these
retirements create new job openings for new workers that need new
housing, retirees do not create many new openings in the housing
market because so many Bostonians choose to remain when they retire.
14Additionally, if downsizing empty-nesters and seniors from suburban
communities decide in significant numbers to relocate to the city
because of its social, cultural, transportation and healthcare advantages,
this could further add to housing demand. The empty-nester age cohort
already has a much lower out-migration rate than other age cohorts over
the age of 30 4, and could easily become a source of in-migration in the
decade of the 2010s if current trends continue.
Families With Children
The number of families with children in Boston represents only 20
percent of Boston’s households, compared to 28 percent statewide.
However, the trend may be beginning to reverse itself. The number of
young families with only pre-school age children rose by 7.3 percent
from 2000 to 2010, and the number of children in the downtown
neighborhoods grew by 15 percent. The recently-announced new
public school at 585 Commercial Street recognizes this trend.
Conversely, many of the neighborhoods where families have traditionally
located are posting significant drops in the number of children under 18
years. From 2000 to 2010, Dorchester had a 19 percent drop in the
number of children; Mattapan had a 23 percent decline.
The result may yield an increasing housing mismatch where family-sized
housing is concentrated in areas that are losing children, while the need
for more family housing will arise in areas that lack family housing.
Boston has historically had its largest out-migration in the 35-49 year old
demographic that includes many families with school-age children. This
out-migration has been a key offset to the market pressures created by
the in-migration of 20-34 year olds 5. If, however, the public schools
continue to improve in the decade of the 2010s, and this out-migration
of families with school-age children abates, the result will be a significant
increase in the need for new housing production.
4
See Research Appendix 2 for more information about in- and out-migration from Boston during the 2000s
5
See Research Appendix 2 for more information about the out-migration of households in the 35-49 year-old
demographic
15Market Rate Housing Production: Goals
To accommodate the City’s economic growth and demographic change during the
decade of the 2010s, the City has established the following goal:
Accomodate the city’s anticipated economic growth by permitting a total
of 30,000 new units in Boston during the decade of the 2010s.
About 25,000 of these units are expected to be market rate 6 units without
governmental assistance, representing $11.4 billion in private investment.
As shown in Appendix 3, the City currently has 5,332 of the 25,000
market rate units in construction, and another 9,112 have been
approved through Article 80 of the Boston Zoning Code, but have not
pulled permits yet.
Market Rate Housing Production : Strategies and Action Steps
Market Rate Production Strategy
To achieve the goal of producing 25,000 market rate units, the City will
employ three key strategies:
• Density. Encourage greater density, coupled with good design and
public amenities, in order to create stronger, more vibrant
communities that will be attractive to Boston’s growth
demographics.
• More Efficient Development. Promote more efficient development
that allows developers to create housing at a lower price point by
offering greater flexibility in design elements such as parking and unit
sizes and promoting greater efficiency in the development permitting
process while still creating housing that is highly compatible with its
surrounding community.
6
Market rate units are units that do not have income restricted occupancy or long term
affordability covenants.
16Actions To Be Taken in 2013
• Move Forward on the Development Pipeline. In addition to the
5,332 market-rate units that have started construction, there are
another 9,112 that have been approved but have not yet pulled
building permits. The city will work to ensure that these projects are
permitted in a timely manner. Another 3,600 new units are in the
development pipeline seeking zoning approval. The BRA will continue
to move forward, approving those that have been appropriately
reviewed by the community and have met the BRA’s Article 80
development review process requirements.
• Housing Cost Drivers Study. Commence a study to identify the key
cost-drivers for housing production in Boston relative to other similar
cities across the county. Identify those cost-drivers that can be
influenced by City action. These cost-drivers may be design-related
(e.g. unit sizes, parking), regulatory-related (e.g. costs and timelines
for getting all permits) or construction-related (e.g. costs of materials
and labor). Seek to find best practices in other communities that
helped reduce the cost of producing housing.
• Parking Options Study. Research best practices find more efficient
ways to manage the need for offstreet parking with a goal of having
a greater proportion of the new residential buildings being dedicated
to housing people rather than cars.
• Unit Sizes. Implement the new smaller unit size standards that were
approved by the BRA in July 2013. See Appendix 8 for a summary of
these unit size policies.
• Design For Our Demographics. While micro-units are a design
innovation that serves the housing needs of a segment of the
younger workforce, the need to innovate cannot stop there. Design
solutions for creating family-adaptable housing downtown are
needed; designs that are attractive to downsizing empty-nesters and
seniors are needed; design solutions from the City’s Energy-Positive
17demonstration initiative 7 should be distilled and disseminated. In
2013, the City will start with convening design experts to look for
new approaches and best practices from other communities and
other countries.
Recommendations for an Incoming Administration
• Zoning Update. Update the provisions in the Zoning Code to allow
for more cost-efficient development options, examples:
o Cost Drivers. Where there are cost-drivers resulting from the
zoning code and there are proven best practices to responsibly
reduce those cost drivers, seek to update the zoning code to
implement those best practices. This should include specifically
revisiting the Article 80 development review process with eye
toward offering a review process that is not only inclusive and
comprehensive but is also efficient and time limited.
o Structured Parking Requirements: Drawing from the best
practices identified in the Parking Options Study, allow
developers to meet resident transportation needs more
comprehensively -- promoting all transportation options, not just
the automobile 8.
• Labor Participation. Support responsible labor practices on
residential construction. Work with the unions to reduce labor costs
on affordable and workforce housing projects. Concurrently, the City
should seek new authorities to enforce workforce agreements that
developers made as a part of the permitting process.
7
Energy-Positive Housing is designed to generate more energy than it consumes.
8
Examples of best practices in other cities: Vancouver, Canada allows developers to partially cash-out parking
requirements by funding improvements to bicycle and transit access; New York City is looking at allowing
developers to lease/sell spaces to non-residents and commercial parking operations thereby increasing the
revenue from their parking facilities while still getting the same number of cars off the street.
18Expanding Housing Options for the Middle Class: Background
With just over 26 percent of its households in the middle class (2010
household income between $50,000 and $100,000), Boston has a smaller
middle class than its region (29.1 percent) or the nation as a whole (30.1
percent). Rebalancing this equation will require housing strategies that
attract and retain the middle class.
Creating middle class housing is going to require a much more activist role
for government than had previously been necessary because costs are
rising so much faster than incomes 9. Without a robust middle class
housing production effort, the middle class will increasingly be in
competition with lower-wage workers for existing housing, further
worsening the housing challenges for Boston’s poorest citizens.
The biggest housing challenge for Boston’s middle class is its access to the
homeownership market. The pricing-out problem for middle class
homebuyers is most extreme in the downtown neighborhoods, where a
$75,000 income is not enough for 96 percent of all homes on the market.
Even a $100,000 income provides access to only 13 percent of the homes
on the market in the downtown areas.
Today, even neighborhoods like Jamaica Plain and South Boston,
traditionally viewed as more affordable, are out of reach – that $75,000
income is sufficient to afford only 15 percent of the market in Jamaica Plain
and only 6 percent of the market in South Boston 10.
Compounding this is the reality that an increasing number of middle-class
first-time homebuyers are still carrying massive amounts of student debt
that further constrains their ability to qualify for a mortgage.
9
While household incomes have risen by 31 percent (from 2000-2011), median rents are up by 53 percent,
and median home prices grew by 63 percent.
10
See Research Appendix 4 for more detailed information on the pricing-out problem for Boston’s middle
class.
19Expanding Housing Options for the Middle Class: Goals
While the City has never before had such a large and explicit goal for housing the
middle class, the current realities demand that the City do so now. To that end,
during the decade of the 2010s, the City intends to:
House 5,000 middle income households – half through new private
production in middle income affordable areas and through creation of
middle-income affordable units in City-assisted and Inclusionary
developments, and half through City assistance to homebuyers buying in
the private market. This will require between $1.5 and $2 billion in public
investment and private financing.
Expanding Housing Options for the Middle Class: Strategies & Actions
Middle Class Housing Strategy
To achieve the goal of providing expanded housing opportunities to
5,000 middle class households, the City will employ three key
strategies:
• Private Middle Income Development in the Neighborhoods. Promote more
new private development in areas of the city that are already more affordable
to the middle class.
• Publicly-Owned Real Estate. The City will create targeted middle class
development opportunities through public land disposition using the
City’s own land, as well as advocating for State & Federal lands. The
City will also manage the tax foreclosure process to prioritize the
acquisition of distressed and underutilized sites that can be turned
quickly into tax-paying middle income housing development sites.
• Homebuying Assistance. Re-engineer the City’s homebuying
assistance programs to better compensate for the highly competitive
homebuying market that middle class homebuyers current face, and
seek to facilitate better access into some of the higher cost
neighborhoods where the middle class is largely priced out.
20Actions To Be Taken in 2013
• Homebuyer Programs. Recognize the newly competitive homebuying
market and recalibrate the City’s homebuyer assistance programs so that
City-assisted middle-income homebuyers can compete more successfully
in the market. As currently envisioned, the new Boston Buyers Advantage
Program will provide a comprehensive suite of services including:
o Credit counseling and help getting prequalified by a lender for those
just starting down the path toward becoming a homebuyer;
o A new Boston Homebuyers Club that will help with the home
shopping process for buyers currently in the market, including listings
of any new affordable homes from DND or BRA/Inclusionary programs
as well as available resales of affordable homes;
o A new financial assistance product that will provide enhanced
downpayment and closing cost assistance to ensure that participating
buyers have no cash shortages at closing. This new financing product
is intended to make City-assisted homebuyers more attractive to
sellers and their brokers, as most last-minute financing issues that
might hold up a sale will have been addressed ahead of time.
o Seek sufficient funding in FY14 and after to triple the annual output to
a least 300 homebuyers per year.
• Public Real Estate Holdings Suitable for Middle & Mixed-Income
Development. Complete a thorough assessment of all publicly held
real estate in Boston that has potential for development into
middle-class and affordable housing. Start with all City agencies
including the BRA and line agencies (e.g. Public Works Department
and Boston Public Schools) and identify vacant or underutilized
parcels suitable for middle-income development that are in tax
foreclosure or that could be obtained in the near future. Seek
cooperation from State/Federal landholding entities such as DCAM,
DCR, MBTA, USPS and GSA regarding their disposition plans.
• Middle Income Housing Initiative. Continue to deliver on the
Middle Income Housing Initiative that committed to provide a
million square feet of City-owned land for new middle income
housing development over two years. Have at least a half million
square feet of property underway by the end of 2013.
21Recommendations for an Incoming Administration
• Middle Class Incentive Zoning. Create a middle-class incentive
zoning program that would provide expedited reviews and a density
bonus program for developers who create middle-income targeted
housing. The incentive zoning program would also include
provisions to ensure that the most cost-efficient and sustainable
construction techniques 11 are possible.
The incentive zoning would carry with it a design requirement to
ensure that projects that can now be built as-of-right still must be
well-designed, offer sustainable energy-efficient housing for the
occupants and are appropriate in their neighborhood context. This
incentive zoning program should be primarily focused in
neighborhood locations around transit nodes, along bicycle
corridors, and in some commercial districts, e.g., the Fairmount and
Orange Line corridors.
• Middle-Class Housing Access Fund. Consider further enhancing the
Homebuyer Assistance Program by using some Inclusionary Cash-
Out funds to fund a homebuyer assistance program that provides
buydown assistance for middle-income buyers to buy into the
existing (non-luxury) market in the high-cost neighborhoods where
they would otherwise be priced out 12. Units bought this way would
be required by covenant to remain middle-income affordable units
into the future.
• Expanded and Extended Middle Income Housing Initiative. Using
the public property analysis described above, expand and extend
the Middle Income Housing Initiative to include much more than
the current one-million square foot target and extend the initiative
through the year 2020.
11
For example: Woodframe low-rise construction costs are typically 10% - percent – 30% percent
less per square foot than other construction techniques.
12
See Appendix 4 for information about the pricing out of the middle class
22Affordable Housing Production & Preservation: Background
Boston has a greater percentage of its housing stock set aside as
affordable housing than any other major city in America 13. Affordable
rental housing represents about 22 percent of our existing stock and 30
percent of all new housing production since 2000. With more than
52,000 affordable units, Boston has more than 20 percent of the
state’s affordable housing, even though the city is home to less than
ten percent of the state’s population.
Despite all these efforts, the cost of housing remains a huge challenge
for many Bostonians. One in every five households in Boston – 46,000
in total -- spends more than 50 percent of their income on housing.
Addressing these high housing cost burdens has been at the center of
every Boston housing plan since the repeal of rent control in the mid-
1990s deregulated 22,000 apartments occupied by low income and
elderly tenants.
Despite the overwhelming need, resources and outputs for affordable
housing are declining. In the last 10 years, CDBG 14 has been sliced 36
percent and HOME 15 grants are down 46 percent. After 53 years, HUD
is now no longer funding the capital subsidy component of the Section
202 elderly housing program, effectively turning it into a project-based
rent subsidy program.
Compounding this are steep cuts in HUD’s support for rental assistance
programs and public housing programs. If these cuts continue, there
will be serious impacts to both the BHA’s Housing Choice Voucher
programs and Public Housing programs, and longer and longer waiting
lists will be the result.
The Commonwealth of Massachusetts, however, continues to be a
reliable partner. Currently, the State FY14 budget includes a new
Housing Bond Bill, the first since 2008, which could provide as much as
$1.4 billion for affordable housing over the next few years.
13
See Research Appendix 1 for city-by-city rankings
14
CDBG: Community Development Block Grant.
15
HOME: HOME Investment Partnership Program
23At the City level, Linkage funds, which are tied to the commercial
sector, are rebounding after the recession, but it has been seven years
since the formula was adjusted for inflation. Inclusionary Development
Cash-Out funds, which had been declining due to the housing slump,
may now rebound with the market upturn.
Those declining resources have resulted in lower affordable production
rates. In the early 2000s, an average of 443 City-assisted affordable
units were created annually, but in recent years the production rate
has fallen to 274 units per year – a 38 percent decline.
A second key factor in the declining production rate is the rising cost of
creating new housing. The average total development cost per unit in
City-assisted developments in the early 2000s was $259,000. In the last
four years, the average cost per unit was $365,000 – a 41 percent
increase 16. Private sector costs have increased even more – from
$302,000 per unit in the early 2000s, to $566,000 over the last four
years – an 87 percent increase 17.
Affordable Housing Preservation
Boston’s nation-leading affordable housing inventory is the result of 75
years of investment stretching back to the New Deal era, when the first
of Boston’s public housing units were created. Preserving that legacy
becomes more challenging every year as the stock ages and market
forces entice owners to opt out of the affordable housing business.
Nowhere is the commitment to preserving that legacy more apparent
than at the Boston Housing Authority. While other major cities have
numerous boarded up developments or large tracts of land where
public housing used to be, the BHA currently has one of the highest
occupancy rates in the nation among large public housing authorities –
more than 97 percent of the BHA’s 12,000 units are habitable and
occupied.
16
See Research Appendix 5 for information on affordable housing production costs and gap subsidy
requirements between 2000 and 2012
17
Private sector market-rate housing typically has more has more amenities and non-residential elements
st
(e.g. 1 floor commercial) than affordable housing projects. This results in per unit costs that are consistently
higher than are experienced with affordable housing.
24This occupancy rate largely has been the result of the BHA’s effective
use of Federal PHA Operating funding, but these funds are being
drastically reduced each year. Capital funding for major capital
investments is also down significantly – from $28 million in 2002 to $17
million in 2012. 2013 is expected to bring a further cut of almost $1
million. Capital funding for the BHA’s state-funded developments has
not been cut back as severely, but it still is far short of what is needed.
The BHA estimates that it will cost over a half billion dollars to make all
of the necessary capital investments needed to fully upgrade all of
their developments.
As one of Boston’s largest residential landlords, the BHA must also
continue to play a leadership role in energy and water conservation
and in the reduction of greenhouse gases, despite formidable resource
challenges. Just recently, the BHA was certified as a Green
Organization by HUD and the Sustainable Performance Institute.
Boston’s other 40,000 affordable units are in private hands, including
for-profit developers, non-profit organizations and individual
homeowners. These units are threatened on a number of fronts. Some
are, like public housing, getting old with substantial capital
obsolescence issues. Others have reached, or will soon reach, the end
of their affordability obligations and are at risk to be converted into
market-rate housing.
While the city has been successful so far in preserving these units – less
than 10 percent of the 5,300 units at risk between 2009 and 2012 were
lost – that task becomes ever more difficult as more units require
recapitalization and even more units reach the end of their
affordability protections.
25Affordable Housing Production & Preservation: Goals
Despite the resource challenges that it currently faces, the City remains
committed to an ambitious affordable housing production agenda:
Produce 5,000 income-restricted long-term affordable units through new
production, and conversion of existing market-rate units into affordable
units. This represents 2.1 billion dollars of new investment in affordable
housing production.
Of these 5,000 affordable units, about 2,000 are expected to be
created privately through the Inclusionary Policy, and about 3,000 will
be created with public financing. As can be seen in more detail in
Appendix 6, the publicly funded units will cost $1.25 billion to build and
will require $559 million in public gap financing from City, State and
Federal sources. Private sources, including equity generated through
various State and Federal tax credit programs will provide $691 million.
Also shown in Appendix 6 is an analysis of the impact of additional
Federal funding cuts. The State’s new $1.4 billion Housing Bond Bill
provides the City with reasonable confidence that the projected State
share of $235 million will be available. Without any more Federal cuts,
the City would need to raise $115 million of its own funds over ten
years, which is comparable to what it is raising now on an annual basis.
However, given the recent defunding of capital subsidies in the Section
202 elderly housing program, the termination of the NSP program, and
the continuing vulnerability of the HOME and CDBG programs, level
Federal funding is highly unlikely. If Federal participation in Boston’s
affordable housing production were to decline by a full 50 percent, the
City would need to raise an additional $81.3 million above the $115
million it is already raising.
In response to these realities, Housing Boston 2020’s strategy places
emphasis on expanding revenue sources and cutting costs. Without
some of each, the 5,000-unit production target will be difficult to
achieve.
26In the area of affordable rental housing preservation, the City has the following
goals:
Retain 100 percent of Boston’s public housing stock 18 despite declining
resources, while maintaining the BHA’s 97 percent occupancy rate at
developments not undergoing redevelopment.
Reduce greenhouse gas emissions in the BHA-owned portfolio by 25
percent.
Retain at least 95 percent of privately-owned affordable units.
Affordable Housing Production & Preservation: Strategies &
Actions
Affordable Housing Strategy
To achieve its affordable housing goals, the City will employ the
following strategies:
• Offset Continuing Federal Cuts to Affordable Housing with Locally
Grown Resources. Federal housing programs have borne a
disproportionate share of Federal budget cutting actions, and it is
unlikely that this is going to be reversed any time soon. Boston,
and cities like it across the country, must become more self-reliant
when it comes to affordable housing funding. To that end, the City
must explore all available options for enhancing affordable housing
funding.
18
Zero permanent losses of units because of habitability. Excludes some nominal losses that may result from
unit reconfigurations in redevelopment projects or because of ADA-required unit adaptations.
27• Reduce The Cost of Producing Affordable Housing. Encourage and create
means for affordable housing developers to offer more efficient
affordable housing designs. Increase the efficiency of systems for funding
and approving affordable housing proposals.
• Reduce Operating Costs and Greenhouse Gas Emissions in Affordable
Housing. Help affordable housing owners to reduce both their environmental
impacts and their operating costs by adopting new technologies to conserve
energy and water.
Actions To Be Taken in 2013
• Linkage. Adjust the Linkage fee for the last three years of inflation,
as allowed under current law, at the earliest opportunity. This
would be a 6 percent increase or 47 cents per square foot resulting
in a new rate of $8.34 per square foot.
• Inclusionary Development Policy. File a Home Rule Petition,
through a vote of the Boston City Council, to codify the
Inclusionary Development Policy into State law. Execute a Mayoral
Executive Order and BRA Board vote to govern the interim
administration of Inclusionary Development funds pending
enactment of the City’s Home Rule Petition. These actions will
require DND and Treasury to administer Inclusionary Funds in a
manner consistent with DND’s procedures for other housing funds.
• Revenue Options Research. Complete a housing revenue options
research study that explores all new resource options not currently
in use by the City of Boston to support affordable housing
production and preservation. This study will assess how these
options might be applied to actual projects in the City’s affordable
housing production and preservation pipeline.
• Alternative Rental Housing Financing Option. Develop in
cooperation with State entities (MassHousing, MHIC, DHCD,
MassDevelopment) a new fast-track financing product that enables
more cost-efficient projects to bypass the multi-year queue that
now exists for the deeper subsidy programs. Currently there is a
significant unused allocation of 4 percent Low Income Housing Tax
Credits at the State that could be a key resource for this alternative
financing product.
28• Design Standards. Publish new design/construction standards for
affordable housing to permit more efficient construction and lower
per-unit production and preservation costs, without substantially
affecting the livability or energy efficiency of the housing. These
changes could, for example, include: smaller unit sizes, lowered
parking requirements, alternate construction technologies, and
allowing more efficient design/build projects where the developer,
architect, and contractor come in as a single team, and bidding
only occurs at the subcontractor levels.
Recommendations for an Incoming Administration
• Linkage. Reassess the Linkage program, and if appropriate, file a
Home Rule petition to update Linkage, including a limited resetting
of the fee amount to account for affordable housing production
cost increases, as well as reassessing the current 100,000 square
foot exemption policy.
• Inclusionary Development Cash-Outs. Once the Policy has been
enacted into State law, establish clear rules under that law for the
City to administer the cash-out program. These rules should:
o Be predictable and uniform across all covered projects, so
that developers can undertake IDP-covered projects with
more cost certainty;
o Establish a floor price for cash-outs closer to the actual total
public cost of producing an offsite affordable unit; and
o Reassess the cash-out formula to capture a greater share of
the economic value of the cash-out and to incent developers
to directly create on-site or off-site affordable units.
The Inclusionary Cash-Out option has the potential to generate
significant, much-needed revenue. If one-quarter of the Article 80-
covered projects expected to be permitted between now and 2020 are
allowed to cash-out even at the minimum floor rate of $200,000, it is
estimated that the City could raise an additional $19.5 million per year
for affordable housing.
29• Community Preservation Act. 148 communities across Massachusetts
have voted to approve CPA initiatives, and new rules at the state level
have not only reduced the cost to taxpayers but also have increased
the State funding that it leverages. Under current CPA rules, only a one
percent surcharge is required to qualify for matching funds, and the
State will match not just CPA funds, but also Linkage and Inclusionary
funding.
Although Boston voters rejected a CPA measure in 2001, these
improvements and the prospect of ever-deepening Federal funding
cuts makes a reconsideration of the CPA appropriate at this time.
The amount of revenue generated will depend on the CPA formula that
goes to vote combined with the amount of match funding the State
provides.
For example, if a 1 percent CPA vote with residential and low income
exemptions were approved, it would raise about $12 million annually
before the State’s matching funds are added in 19.
It is important to note, however, that CPA funds are not only used for
housing; they must be distributed across affordable housing, open
space and historic preservation. This means that amount available for
housing would be less than the total $12 million.
• Senior Housing Task Force. With the number of seniors living in
Boston expected to increase substantially by 2020, and with the
largest Federal cuts coming in the Section 202 senior housing
program, Boston, like every other city in the country, will need to
devise fundamentally new strategies to house its seniors.
We expect to see rising numbers of seniors living alone in large
homes that are increasingly difficult to maintain and expensive to
operate. If seniors have attractive and affordable downsizing
opportunities within their community, it follows that more family-
19
State matching funds are generated from a real estate transaction fee that is divided across all
CPA communities. It can vary substantially with the level of activity in the real estate market as well
as the number of CPA communities eligible for the match, so reliable projections of State matching
funds are not possible.
30sized housing would be available for families, while seniors would
be able to stay in their community in more sustainable housing.
It is expected that that there may even be in migration of middle-
class seniors from the suburbs as the City offers more attractive
and accessible downsizing opportunities. The confluence of all of
these trends creates an unprecedented set of challenges that must
be addressed comprehensively and strategically.
To that end, it is recommended that a Senior Housing Task Force
be convened by the incoming administration to create a
fundamentally new comprehensive senior housing strategy. This
Task Force would be comparable in nature to those used to
generate homeless strategies – challenging experts and
stakeholders to create a realistic and strategic response to a highly
complex issue.
• Affordable Housing Energy and Water Consumption &
Greenhouse Gas Emissions. Implement at the BHA HUD’s Green
PHA Assessment, including an authority-wide audit. Disseminate
the benefit of this experience, including best practices, to other
affordable housing operators.
31You can also read


