Housing and Business Development Capacity Assessment 2017
←
→
Page content transcription
If your browser does not render page correctly, please read the page content below
SmartGrowth Housing and Business Development Capacity Assessment 2017

              Housing and Business
             Development Capacity
                 Assessment 2017

                                                                        1
SmartGrowth Housing and Business Development Capacity Assessment 2017
Contents
Executive Summary…………………………………………………………………………………………………….. 4
Introduction……………………………………………………………………………………………………………………… 7
Purpose…………………………………………………………………………………………………………………………… 7
Geographic Area……………………………………………………………………………………………………………… 7
Assumptions……………………………………………………………………………………………………………………. 8
SmartGrowth Context and Principles………………………………………………………………………………. 9
Sub-Regional Context……………………………………………………………………………………………………… 10
Policy Context…………………………………………………………………………………………………………………. 11
Part 1: Housing…………………………………………………………………………………………………………………. 12
Housing Demand Assessment………………………………………………………………………………………………. 13
Typology………………………………………………………………………………………………………………………….. 14
Location………………………………………………………………………………………………………………………..... 17
Price Point………………………………………………………………………………………………………………………. 18
Housing and Māori………………………………………………………………………………………………………….. 23
Summary of Housing Demand…………………………………………………………………………………………. 25
Housing Capacity Assessment -Tauranga City………………………………………………………………………. 26
Short Term Capacity- Tauranga City - June 2017 - June 2020 ……………………………………….. 26
Medium Term Capacity- Tauranga City - June 2020 - June 2027……………………………………. 29
Long Term Capacity- Tauranga City - June 2027 - June 2047…………………………………………. 31
Housing Capacity Assessment - Western Bay of Plenty District……………………………….…………... 37
Short Term Capacity- Western Bay of Plenty District - June 2017 - June 2020 ………………. 37
Medium Term Capacity- Western Bay of Plenty District - June 2020 - June 2027………….… 39
Long Term Capacity- Western Bay of Plenty District - June 2027 - June 2047………………….. 40
Housing Capacity Assessment Sub-Regional Overview……………………………….……………………… 42
Part 2: Business………………………………………………………………………………………………………………………. 44
Business Demand Assessment………………………………………………………………………………………………. 44
Employment Projections by Sector………………………………………………………………………………….. 44
‘Out of Zone’ Business Demand……………………………………………………………………………………… 46
Agriculture………………………………………………………………………………………………………………………. 46
Business Capacity Assessment…………………………………….………………………………………………………. 47
Commercial…………………………………………………………………………………………………………………..... 47
Industrial…………………………………………………………………………………………………………………………. 50
Business Capacity Assessment Sub-Regional Overview………………………………………………………… 51
2
SmartGrowth Housing and Business Development Capacity Assessment 2017
Part 3: Sufficiency and Monitoring……………………………………………………………………………………. 52
Short Term………………………………………………………………………………………………………………………. 52
Medium Term…………………………………………….…………………………………………………………………… 52
Long Term………………………………………………………………………………………………………………………. 52
Monitoring………………………………………………………………………………………………………………………. 53
Part 4: Business and Housing Interactions………………………………………………………………………. 54
Part 5: Stakeholder Engagement……………………………………………………………………………………….. 55
Part 6: Funding……………………………………………………………………………………………………. 56
Part 7: Summary of Challenges for Future Development Strategy…………………………... 58
List of Appendices and Links……………………………………………………………………………………………….. 60
3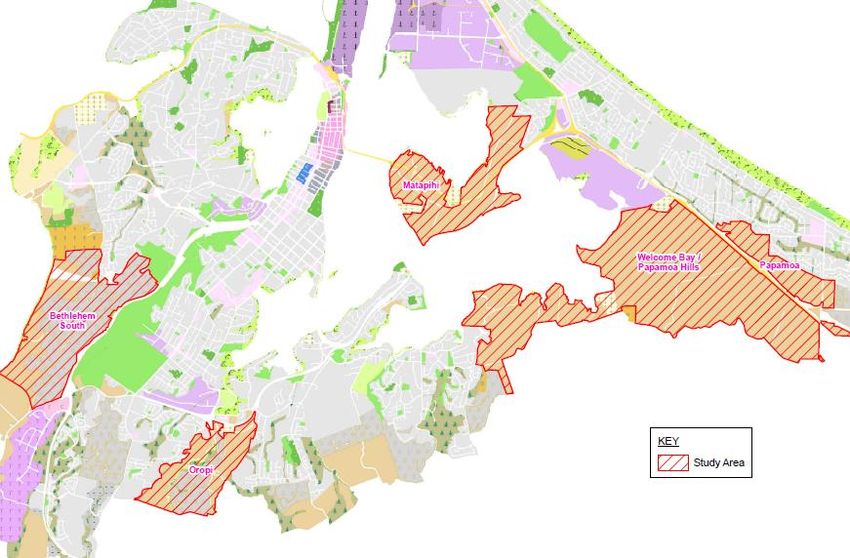
SmartGrowth Housing and Business Development Capacity Assessment 2017

Executive Summary
The purpose of this report is to meet the National Policy Statement on Urban Development Capacity
(NPS-UDC) requirements to carry out a Housing and Business Development Capacity Assessment
(HBDCA) for the Tauranga Urban Area. The overall objective is to have a robustly developed,
comprehensive and frequently updated evidence base to inform planning decisions for urban growth
in the western Bay of Plenty sub-region.

The SmartGrowth partnership is made up of the Tauranga City Council, Western Bay of Plenty District
Council, Bay of Plenty Regional Council and local tangata whenua, as well as the NZ Transport Agency
and Bay of Plenty District Health Board as implementation partners. Since 2001, SmartGrowth has
developed and regularly updated an integrated spatial plan and settlement pattern for the sub-region.
The sub-region remains the appropriate lens for growth management and therefore SmartGrowth has
adopted this geographic extent for the HBDCA.

Overall, the results indicate that the western Bay of Plenty sub-region does not have any projected
shortfalls in capacity for either housing or business capacity over the short, medium or long term. Both
the development capacity which is provided in resource management plans (and supported with
development infrastructure and feasible for development) and the anticipated additional supply over
time will be sufficient to meet the projected demand for housing and business capacity across the sub-
region. The Future Development Strategy in 2018 will outline how this anticipated capacity will be
planned for and delivered over the next 30 years and the key challenges that need to be overcome to
achieve this.

Housing
Over the 30 years from June 2017, the western Bay of Plenty sub-region will need to cater for demand
for over 43,000 new dwellings. This is made up of a 60% and 38% increase in dwellings for Tauranga
City and Western Bay of Plenty District respectively. Table E1 provides a broad summary of the current
SmartGrowth settlement pattern as it relates to the timeframes defined by the NPS-UDC for the short,
medium and long term. An overview map is attached as Appendix 2.

Table E1 - Indicative Sequencing of Development Capacity for Housing

                           Short Term                  Medium Term                   Long Term
                      (June 2017 – June 2020)      (June 2020 – June 2027)     (June 2027 – June 2047)

                                                       Current Areas           Medium Term Capacity
                                                              +                          +
                    Current Zoned and Serviced         Intensification            Intensification
  Tauranga City
                         Areas Sufficient                     +                          +
                                                        Te Tumu and              Western Corridor
                                                        Tauriko West            Southern Corridor

                                                      Current Areas           Medium Term Capacity
 Western Bay of     Current Zoned and Serviced              +                            +
 Plenty District         Areas Sufficient          Omokoroa and Katikati      Waihi Beach and Te Puke
                                                    Generation 4 Areas          Generation 4 Areas

                                                                                                         4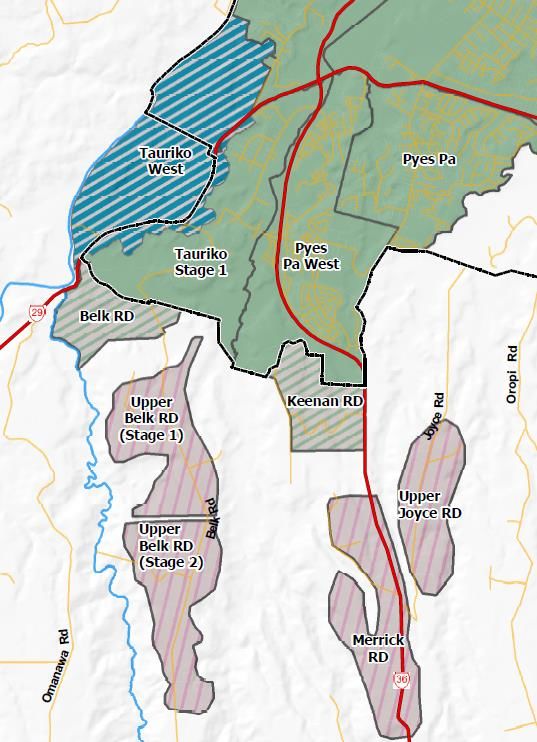
SmartGrowth Housing and Business Development Capacity Assessment 2017

For Tauranga City there is a strategic imperative through the Tauranga Urban Strategy1 to achieve
higher rates of growth through intensification and achieve a more compact urban form. This is
intended to be achieved through higher densities in and around the city centre and for other centres
in the City. There has been a relatively low rate of intensification in Tauranga to date compared with
other major cities in New Zealand. The Future Development Strategy developed over 2018 will outline
the measures that will be introduced to increase the rate of intensification.

There are significant affordability challenges currently for housing in terms of both house prices and
rents. There has been a significant divergence between growth in household incomes and house prices
and rents over several decades. As a result, over 80% of current renters cannot afford to buy a home
in the lower price quartile and over 50% cannot affordably rent anywhere in the sub-region.

Structural ageing of the population is projected over the 30 years. There will be a corresponding
increase in demand for smaller houses for both owner-occupiers and renters to meet the needs of an
older demographic.

There is a greater housing challenge for Māori relative to the general population. There are unique
spatial considerations relevant to Māori as well, particularly in respect to papakainga development on
multiply-owned Māori land and the development of treaty settlement land. Housing issues affect both
tangata whenua as well as Māori for whom the sub-region is not associated with their whakapapa.
The latter group are noted to make up the majority of homeless in the sub-region.

Increasing the range of housing typologies, price points and tenure models for housing will contribute
to matching housing supply with needs and addressing the challenge of affordability. There are a range
of measures being developed by the SmartGrowth partners and other parties to create a Smart
Housing Action Framework for the sub-region. This work will be will be integrated with development
of the Future Development Strategy.

Business
Development capacity for business activity is well catered for across the sub-region over the next 30
years. The Tauriko Business Estate in the western corridor and the Raniguru Business Estate in the
eastern corridor will together cater for a large proportion of the forecast industrial growth in the sub-
region. Other areas for industrial activity of smaller but still significant scale will become available in
the northern corridor (Omokoroa and Te Puna) and eastern corridor (Te Tumu) during the medium
term.

There will be emerging pressure on some smaller neighbourhood centres in the long term, especially
if increasing demand for services results from higher densities of residential activity and higher
proportions of older residents in these areas. For example, several centres in the Otumoetai area are
forecast to be in deficit for business development capacity at the end of the 30 year term, as are a
number of neighbourhood centres in the Western Bay of Plenty District.

1
 The Tauranga Urban Strategy is currently in draft and there will be public engagement on the document in
parallel with the Future Development Strategy in 2018.

                                                                                                         5
SmartGrowth Housing and Business Development Capacity Assessment 2017

Interactions of Housing and Business
SmartGrowth promotes an urban form that supports a live/learn/work/play philosophy, and
coordinating the location of housing and business activity is an important consideration to achieve
this goal. Given the large commercial centre and industrial estate emerging at Tauriko, further
opportunities for housing capacity in the western corridor will be investigated following on from the
current settlement pattern. The intention signalled in the Tauranga Urban Strategy to increase
densities of housing in and around the city centre, as well as other centres in the City, will also require
consideration of the business development capacity available in these areas. Synergies of housing
location, density and proximity to employment and learning opportunities will be essential to realise
the benefits of a compact city form. Likewise, the commercial and industrial offering in the growing
townships of the Western Bay of Plenty District will need to be considered. The HBDCA provides a
robust platform to consider these matters in developing the Future Development Strategy in 2018.

Funding Challenge
There are significant costs associated with bringing new urban growth areas online for development.
A financially sustainable and equitable model to fund growth related infrastructure is required. This is
a key challenge shared across territorial authorities in New Zealand, particularly in high growth areas.
Government is currently addressing these issues and significant policy announcements are likely
during the first part of 2018.

Future Development Strategy
A Future Development Strategy (FDS) will be developed and consulted on over 2018 to identify how
sufficient development capacity will be made available in the medium and long term. The FDS will be
strongly guided by the SmartGrowth settlement pattern review. The NPS-UDC provides an opportunity
to link our existing SmartGrowth Strategy and settlement pattern with the FDS. The FDS will be specific
out to the medium term, however, there will be less certainty into the long term as a range of factors
can influence the optimal timing and location of new development capacity. For example, the success
or otherwise of centres-based intensification will influence the timing and extent of further greenfield
urban growth areas.

The FDS will outline the monitoring regime - and crucially the trigger points that will signal when new
interventions are required to release further development capacity. Given the long lead-in times
required to render new development capacity ready-to-go, it is important that these trigger points
account for the time required to complete the necessary enabling work.

Potential future scenarios in the long term may need to look at strategic opportunities elsewhere in
the sub-region and compare whether such opportunities are a preferred alternative to the long term
capacity scenario presented in this HBDCA. Such alternatives will be investigated through developing
the FDS and its subsequent revisions. In turn, this could change housing and business development
capacity identified for the long term in future updates to the HBDCA.

                                                                                                         6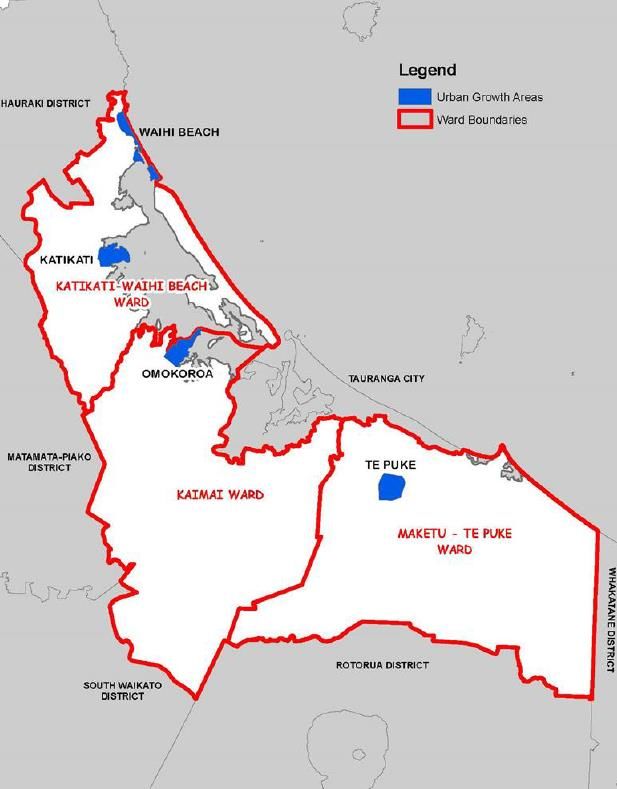
SmartGrowth Housing and Business Development Capacity Assessment 2017

Introduction
Purpose

The purpose of this report is to meet our National Policy Statement on Urban Development Capacity
(NPS-UDC) requirements to carry out a Housing and Business Development Capacity Assessment
(HBDCA). The overall objective is to have a robustly developed, comprehensive and frequently
updated evidence base to inform planning decisions in urban environments. In short, the HBDCA
estimates the demand for dwellings and business land and the supply of development capacity to
meet that demand in order to determine whether there is sufficient capacity to meet need.

The NPS-UDC came into effect on 1 December 2016 and involves a step change in the way local
authorities provide for and respond to growth, and the evidence and monitoring required to support
planning decisions. The NPS-UDC provides national direction to local government on making provision
for urban development.

The NPS-UDC identifies the Tauranga Urban Area as a high-growth urban area, which covers all of the
Tauranga territorial area and some of the urban area within the Western Bay of Plenty District. As
such, the SmartGrowth councils need to meet all of the requirements in the NPS-UDC. Policy PB1
requires that a HBDCA be carried out at least every three years. The relevant NPS-UDC capacity
assessment policies are set out in Appendix 1. Under the NPS-UDC, all medium and high growth local
authorities are also required to monitor a range of indicators on a quarterly basis. SmartGrowth has
undertaken this monitoring and incorporated it into its annual Development Trends report, attached
as Appendix 3. This monitoring data provides important information for the HBDCA.

Geographic Area

Since 2001, SmartGrowth has developed and regularly updated an integrated spatial plan and
settlement pattern for the western Bay of Plenty sub-region. The SmartGrowth councils have
determined that the sub-region
remains the appropriate lens for
growth     management       and
therefore SmartGrowth has
adopted this geographic extent
for the HBDCA.

The requirement for all three
local authorities to implement
various aspects of the NPS-UDC
means that the SmartGrowth
partnership is the right vehicle for
coordinating this work.

                                                                                                  7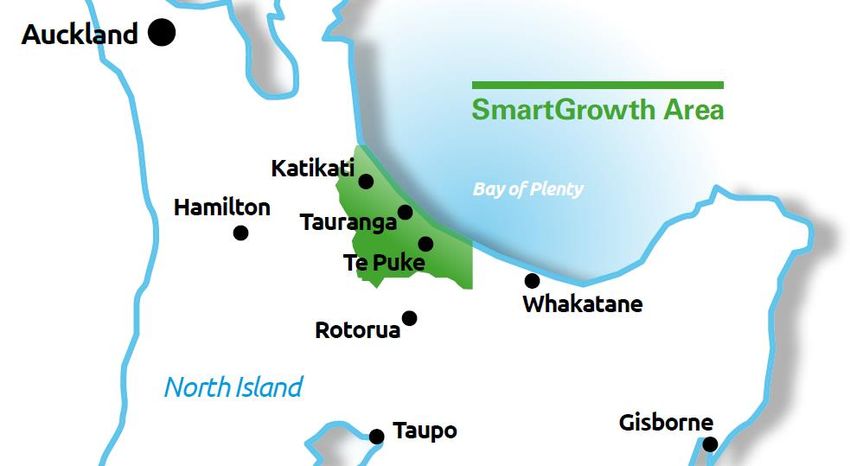
SmartGrowth Housing and Business Development Capacity Assessment 2017
Assumptions
This HBDCA is based on the following high level assumptions:
The HBDCA is part of a wider suite of SmartGrowth and other partner documents, in particular
the SmartGrowth Strategy 2013 and associated documents.
This HBDCA reflects the evidence base that we have available at this time.
Further work is required on an ongoing basis in relation to infrastructure and development
feasibility, especially in respect of brownfields intensification.
Funding
That planned and committed investment from central government and other national
infrastructure providers will occur, for example State highways, the rail network, schools,
healthcare, energy and telecommunications.
That the SmartGrowth partner councils will be able to provide and fund infrastructure in a
timely manner.
All funding opportunities will be investigated and explored.
Growth Management
It is important that development occurs in a logical and staged manner while being flexible
enough to respond to changes in circumstances and new opportunities, in particular the
emerging Government urban development authority toolkit and development funding
reforms.
Increased residential densities are an essential part of managing urban development.
A comprehensive approach is taken to development and whole areas are considered so that
sufficient scale is achieved to ensure that infrastructure and services are efficient and cost
effective.
Growth Drivers
There are a number of factors that influence development capacity and uptake which are
beyond the control of the SmartGrowth partners. These include:
Demographic changes including migration rates
Financial interest rates and lending criteria
The influence of Auckland and surrounding regions and any displacement of growth
into the western Bay of Plenty sub-region
The impact of significant infrastructure (e.g. State highway upgrades, any future rail
initiatives)
These factors highlight the importance of monitoring in order to identify trends and challenges
early so that we can respond to these.
The HBDCA will be a key input into the Future Development Strategy which will form part of
the SmartGrowth settlement pattern review (this will update Part C of the SmartGrowth
Strategy).
The HBDCA will be subject to careful monitoring and review.
8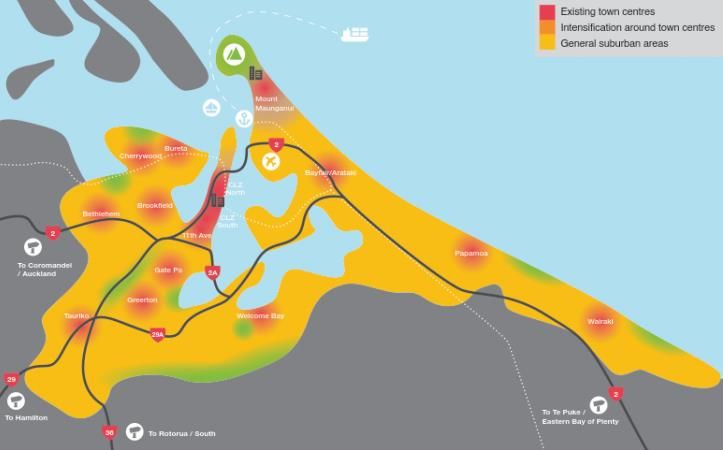
SmartGrowth Housing and Business Development Capacity Assessment 2017
SmartGrowth Context and Principles
The SmartGrowth Strategy is a 50 year spatial plan for the western Bay of Plenty sub-region.
SmartGrowth is a partnership between the Tauranga City Council, Western Bay of Plenty District
Council, Bay of Plenty Regional Council and tāngata whenua, as well as the NZ Transport Agency and
Bay of Plenty District Health Board as implementation partners.
SmartGrowth sets the strategic vision and direction for the growth and development of the western
Bay of Plenty sub-region, on key issues across the spectrum of social, environmental, economic and
cultural objectives.
A cornerstone of the SmartGrowth Strategy is the settlement pattern. This is currently being reviewed
and updated. This HBDCA will inform the settlement pattern review. The settlement pattern review
will dovetail into the NPS-UDC requirement to prepare a Future Development Strategy.
The SmartGrowth settlement pattern has been anchored in the Bay of Plenty Regional Policy
Statement, District Plans, Regional Land Transport Strategy and Long Term Plans.
This HBDCA, along with other NPS-UDC work, has been undertaken in accordance with the outcomes
and principles for the settlement pattern contained in Part C of the SmartGrowth Strategy. The
overarching outcome is as follows:
“We all work from the same long term planning blueprint which incorporates planning for land use,
transport and other infrastructure in an efficient, and affordable way”.
This work also takes account of the SmartGrowth Strategy pillars of partnership, collaborative
leadership, integration, evidence-based and the live/learn/work/play approach.
The relevant principles are:
A more compact urban form and opportunities for live/learn/work/play are actively
promoted.
New settlements start when agreed population thresholds have been reached and land supply
is monitored and actively managed.
Defined urban limits are maintained.
Business land is provided for a range of activities along with the ability to adapt to changing
circumstances over time.
Continual efforts are made to improve the transport system, including the road network, rail,
public transport, walking and cycling.
A diverse range of innovative, safe, efficient and effective infrastructure and funding solutions
are encouraged.
Areas severely constrained by hazard effects are mitigated or avoided and the community is
kept well informed of hazard risks.
The transport system is optimised in association with other infrastructure networks.
The high level outcome and principles will guide the settlement pattern review and the preparation
of the Future Development Strategy in 2018.
9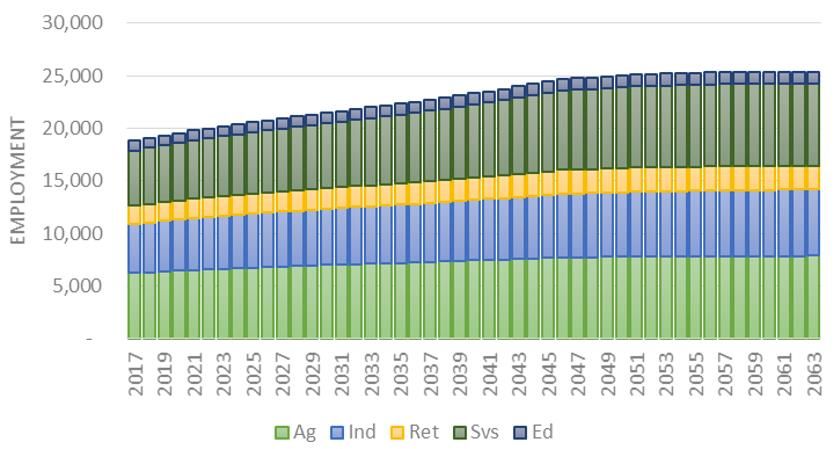
SmartGrowth Housing and Business Development Capacity Assessment 2017
Sub-Regional Context
The western Bay of Plenty sub-region has been an area of rapid population growth since the 1950s
with very strong growth since 1990 in particular.
The total population of the sub-region is around 173,000 people as at 2017. It is projected to reach
around 244,000 by 2047 (the timeframe relevant to this HBDCA). Over this 30 year period around
43,000 new dwellings will be required.
The growth drivers for the sub-region are:
Part of the golden triangle of Auckland, the Waikato and the Bay of Plenty – there is
significant population and economic growth in this area
An ageing population and decreasing size of households
A sunbelt destination with high migration into the area
Seasonal increases in population due to horticultural workers and holiday makers
The influence of the Port of Tauranga
The sub-region has a number of key pieces of infrastructure, including social facilities:
The Port of Tauranga
Tauranga Eastern Link
The designated Tauranga Northern Arterial and 4-laning to Omokoroa as a potential future
piece of infrastructure
Significant State highway networks, e.g. State Highway 2 and State Highway 29
East Coast Main Trunk Railway
Tauranga urban transport network
Tauranga Airport
Tauranga Hospital
Toi Ohomai Institute of Technology, University of Waikato Tauranga Campus and Te
Wānanga o Aotearoa
The 2013 SmartGrowth Strategy identifies some of the sub-region’s growth areas but noted that these
were subject to further analysis. This analysis was undertaken to inform an update to the settlement
pattern in August 2016, which confirmed the following growth areas over the next 10 years:
Compact City (intensification and infill within the Tauranga urban area)
Eastern Corridor – Te Tumu, Te Puke
Northern Corridor – Omokoroa, Katikati, Waihi Beach
Western Corridor – Tauriko West
Development and structure planning is underway for these areas2. Appendix 2 provides an overview
map of the current settlement pattern with staging indicated for the short, medium and long terms.
2
Note that, as outlined in this HBDCA, new growth areas beyond the current urban extent are not required in
the Waihi Beach and Te Puke townships within the next ten years. The current structure planning work underway
is therefore focussed on the Te Tumu, Tauriko West, Omokoroa and KatiKati future urban growth areas. This is
indicated on the overview map attached as Appendix 2.
10SmartGrowth Housing and Business Development Capacity Assessment 2017
Policy Context
Alongside the SmartGrowth Strategy and settlement pattern, a number of key policy and strategy
documents have informed this HBDCA. These include:
National Policy Statements (Urban Development Capacity, Freshwater Management) and
the New Zealand Coastal Policy Statement
National Infrastructure Plan
Government Policy Statement on Land Transport
Bay of Plenty Regional Policy Statement (in particular the Urban and Rural Growth
Management Policies)
Bay of Plenty Regional Land Transport Plan
Long Term Plans of the partner councils including 30 year Infrastructure Strategies
District Plans
Tauranga Urban Strategy3
3
The Tauranga Urban Strategy is currently in draft and there will be public engagement on the document in
parallel with the Future Development Strategy in 2018.
11SmartGrowth Housing and Business Development Capacity Assessment 2017
Part 1: Housing
The western Bay of Plenty sub-region effectively operates as one large housing market – with strong
interdependencies between the populations of Tauranga and the Western Bay of Plenty District for
employment, education - and of course housing. Figure 1.1 shows the close correlation for dwelling
sales prices across the two areas.
Figure 1.1 – Dwelling sales prices for Tauranga City and Western Bay of Plenty District
This housing assessment is presented in two parts. Firstly, the demand profile is outlined in terms of
the current state of the market and how it serves the resident demographic and also future projections
for the short, medium and long term. The demand profile addresses housing typology, location and
price point to illustrate the variation in the housing market across the sub-region and how this
will/should change in the face of projected shifts in the demographic composition. A comprehensive
report on the demand profile is attached as Appendix 44.
In terms of development capacity, there are distinctive characteristics for each of the territories that
are important to understand. The development capacity overview therefore presents the two
territorial areas separately, followed by a sub-regional overview.
4
Prepared by Community Housing Solutions Ltd and Livingston and Associates Ltd
12SmartGrowth Housing and Business Development Capacity Assessment 2017
Housing Demand Assessment
The SmartGrowth partnership engaged NIDEA5 in 2013 to develop projections for the western Bay of
Plenty sub-region. These projections are used to plan for future growth in housing demand. Regular
monitoring is undertaken to compare the NIDEA projections with the projections of Statistics NZ and
the actual uptake of population and new dwellings as new data becomes available.
For Tauranga City, in order to ensure that the projections remain as accurate as possible, the
projections were adjusted in March 2017 to bring some growth forward in the 2013 to 2018 period
and this was offset by reducing growth in the 2018 to 2033 period to align with the revised Statistics
NZ medium projection to 2033. The revision responds to the current high rate of population and
dwelling growth signalled by high levels of dwelling consents issued and migration.
The 2033 to 2063 NIDEA projection remains unchanged as does the total population and household
projection to 2033 and 2063 as projected by NIDEA. Figure 1.2 below shows the trend of actual growth
compared to the revised NIDEA projections, indicating that the revised NIDEA projections are still
serving as a robust basis for anticipating future population growth and demand for new dwellings.
Figure 1.2 - Western Bay of Plenty Sub-Region Development Compared to Projections
Table 1.1 indicates the projected demand for new dwellings over the short, medium and long term
time periods as defined in the NPS-UDC. The 30 year time horizon covered by the NPS-UDC is from
June 2017 to June 2047 for this HBDCA. The Table shows a 60% and 38% increase in dwellings for
Tauranga City and Western Bay of Plenty District respectively over 30 years.
5
National Institute of Demographic and Economic Analysis – University of Waikato
13SmartGrowth Housing and Business Development Capacity Assessment 2017
Table 1.1 - Projected Dwelling Demand for Short, Medium and Long Term
Short Term Medium Term Long Term Total 30 Year
Area June 2017 – June June 2020 – June June 2027 – June June 2017 – June
2020 2027 2047 2047
Tauranga City 4,245 9,191 22,013 35,449
Western Bay of
1,267 2,657 4,128 8,052
Plenty District
Total Sub-
5,512 11,848 26,141 43,501
Region
Typology
A more fine-grained analysis of the nature of this demand reveals significant shifts in the demographic
composition and in turn the typology of housing required for the sub-region. An important factor in
this regard is the projected change in rates of owner occupation – as renters are twice as likely as
owners to live in multi-unit typologies. The rate of home ownership has been modelled to reduce to
less than 60% over the next 30 years as shown in Figure 1.3 below:
Figure 1.3 - Projections for Rates of Home Ownership
Another relevant factor is the ageing population. This correlates with an increase in couple only and
one person households, with the demand for rental housing for this demographic projected to
increase by over 100% over the 30 year term. The number of renters aged 65+ forecast is projected
to increase by 225% over the 30 year term. Figure 1.4 shows the changing household demographic
projected for the sub-region.
14SmartGrowth Housing and Business Development Capacity Assessment 2017
Figure 1.4 - Occupied Dwellings in Sub-Region by Age of Reference Person
A potential outcome of this changing demographic, and a trend towards rental tenure for smaller
households, has a potentially significant implication for the typology of housing stock required to serve
the population. This is primarily driven by the higher propensity of couple only and one person renter
households to live in multi-unit vs. standalone typologies. Figures 1.5 and 1.6 show the breakdown of
typologies delivered over the last decade.
Figure 1.5 - New Dwellings by Typology – Tauranga City
15SmartGrowth Housing and Business Development Capacity Assessment 2017
Figure 1.6 - New Dwellings by Typology – Western Bay of Plenty District
Table 1.2 - Trend Analysis of Housing Typologies in Sub-Region
Townhouses,
Retirement flats, units,
Houses Apartments
village units and other
dwellings
Last 12 Tauranga City 76.7% 1.9% 16.9% 4.5%
months WBOPD 80.6% 0.0% 8.5% 11.0%
Tauranga City 83.1% 0.7% 12.3% 4.0%
Last 5 Years
WBOPD 85.0% 0.2% 8.9% 5.9%
Aside from the obvious dip in development activity following the global financial crisis, the figures
above illustrate a rising number of retirement village units and attached typologies in recent years.
The apartment market appears yet to make a significant resurgence.
16SmartGrowth Housing and Business Development Capacity Assessment 2017
Location
An important factor to consider in terms of location is the housing needs implied by the future
demographic projections. This could impact on the range of typologies and the propensity of
households to seek particular forms of housing in particular locations. The locational factors will
similarly be influenced by demographic composition. For example, older and potentially mobility
restricted residents may seek locations that are in close proximity to a range of services in areas of
relatively gentle terrain, preferably in areas of relatively high public amenity.
Employment and education sector growth can also have an impact on preferred housing location.
Students may seek closer proximity to tertiary institutions, with Tauranga City’s major campuses
located in the city centre and southern corridor. The University of Waikato Tauranga Campus is
currently under construction and represents a step change in the scale and offering of the tertiary
sector in the city centre.
Another example is temporary accommodation for seasonal workers associated with the
agriculture/horticulture industry. A comprehensive assessment of demand for this sector is attached
as Appendix 5.
As traffic congestion increases with growth, the desirability to trade-off housing typology for reduced
travel time/cost will become more relevant. These matters are highlighted in the Tauranga Urban
Strategy which seeks to achieve higher residential densities in the existing urban area through centres-
based intensification.
There are significant areas of multiply-owned Māori land across the sub-region. Many of those areas
are locations for marae and currently support papakāinga housing. There is potentially significant
demand for more papakāinga housing in the future to serve local tangata whenua.
Another consideration for location is visitor accommodation. Whilst provision for short-stay
accommodation is partly related to the commercial accommodation sector, the use of housing for
short-stay accommodation is a growing trend, particularly through mediums such as Airbnb. Some
locations in the sub-region indicate relatively high proportions of the housing stock being used for this
purpose. Vacancy rates of housing from Census data is a useful indicator in this regard. Table 1.3 shows
the areas in the sub-region that have relatively high rates of vacancy at the last Census – all being
areas of high coastal amenity and having vacancy rates over 20%.
Table 1.3 - Vacancy Rates Indicating Areas Popular for Short Stay Visitor Accommodation
Area Vacancy Rate
Island View-Pios Beach 61%
Waihi Beach 49%
Matakana Island 34%
Western Bay of Plenty District
Pongakawa (incl. Pukehina) 31%
Athenree 28%
Maketu 26%
Tauranga City Mount Maunganui North 32%
17SmartGrowth Housing and Business Development Capacity Assessment 2017
The Tauranga Urban Strategy identifies key benefits that will be achieved from centres-based
intensification, supporting a pre-eminent city centre and a range of smaller centres across the City.
These include:
Better choice and resilience through density, diversity and mixed-use.
Greater efficiency through better connectivity and being transit supportive.
Streets with character and walkable neighbourhoods.
Open space, integrated natural systems and environmental resilience.
Place-making through, quality architecture and urban design.
These will be important considerations in determining the areas of focus for intensification in
developing the Future Development Strategy in 2018.
Notwithstanding the above factors, the location of future growth for housing is principally determined
by the location of current and future zoned land for housing as identified in the SmartGrowth
settlement pattern. This is outlined in the capacity assessment below. Projections based on recent
trends suggest that over 80% of new dwellings will be delivered in the greenfield urban growth areas.
The Tauranga Urban Strategy seeks to increase the rate of intensification around existing urban
centres, but even if this strategy is successful, over the long term the majority of dwellings will still be
delivered in the greenfield context.
Price Point
At the city and sub-regional scales the increase in house prices over time has been pronounced which
suggests a high demand for housing in the sub-region over time. That said, the period of 2007 to 2012
saw a softening of prices in both territorial areas, largely associated with the global financial crisis
which had a corresponding effect on housing demand across the board. Figure 1.7 illustrates that even
compared to other high growth areas the absolute price of housing and rate of increase in the sub-
region has been higher than all other major urban areas other than Queenstown and Auckland.
Figure 1.7 - 12 Month Rolling Average Dwelling Sales Price (Actual)
Price trends vary within the sub-region as shown over the following pages for both Tauranga City and
Western Bay of Plenty District.
18SmartGrowth Housing and Business Development Capacity Assessment 2017
Figure 1.8 - Tauranga City Dwelling Rents - June 2017
Figure 1.9 - Tauranga City Dwelling Sales Prices - June 2017
Figure 1.10 - Tauranga City Percentage Change in Dwelling Sales Prices - June 2007 to June 2017
19SmartGrowth Housing and Business Development Capacity Assessment 2017
Figure 1.11 - Western Bay of Plenty District Dwelling Rents - June 2017
Figure 1.12 - Western Bay of Plenty District Dwelling Sales Prices - June 2017
Figure 1.13 - Western Bay of Plenty District Change in Dwelling Sales Prices - June 2007 to June 2017
20SmartGrowth Housing and Business Development Capacity Assessment 2017
There are significant affordability challenges currently for housing in terms of both house prices and
rent prices. There has been a significant divergence between growth in household incomes and house
prices and rent over several decades. As a result, over 80% of current renters cannot afford to buy a
home in the lower price quartile and over 50% cannot affordably rent anywhere in the sub-region6.
Figure 1.14 for example shows the change in housing stress faced by renters across various household
income brackets from 2001 to 2013.
Figure 1.14 - Changes in Renter Housing Stress: 2001 – 2013
There is also a more pronounced need for Māori in terms of affordability and access to housing relative
to the general population, with a significantly higher proportion of Māori in the lowest income quartile
compared to the general population. There are specific spatial considerations relevant to Māori as
well, particularly in respect to papakainga development on multiply-owned Māori land. The issues of
affordability and access to housing extend beyond local hapu/iwi to Māori for whom the sub-region is
not associated with their whakapapa. The latter group are noted to make up the majority of homeless
in the sub-region.
There is a need to increase the range of housing typologies and price points in order to address the
challenge of affordability. Higher densities in both the existing urban area as well as in the greenfield
urban growth areas could provide significant benefits in this regard. There are nonetheless real
challenges in delivering a wider price point for housing, particularly in a brownfields context7.
Feasibility modelling indicates that the development costs for brownfields medium density typologies
require price points at sale that are not proven in the current market for the medium density range of
typologies. This explains in part the observation that medium and high density development to date
has been concentrated in the higher amenity areas of Mount Maunganui North and to a lesser extent
6
Affordable to rent or buy in this regard is considered to be where less than 30% of gross household income is
required to service rent or the cost to service a mortgage plus other housing costs.
7
‘Brownfields’ in this HBDCA is used to refer to comprehensive redevelopment of sites through removal of
existing improvements. This is also sometimes referred to as ‘greyfields’.
21SmartGrowth Housing and Business Development Capacity Assessment 2017
the city centre. The best performing typologies that are close to development feasible in a brownfields
context, given current market conditions, are intensive terrace and medium rise apartment typologies.
Feasibility modelling suggests that duplex typologies are workable in the greenfield context8. The
difference is explained in that the cost component of existing improvements (that need to be removed
in brownfield contexts) remains high relative to the land component in the brownfields. There is
anecdotal evidence from the development community that there is suppressed demand for attached
typologies in the greenfield urban growth areas, but this is not being met by the market given the
relative profitability of delivering standalone dwellings, even on ever decreasing average section sizes.
The observation that price points for intensification products still need to be relatively high,
particularly in brownfield contexts, is a challenge that needs to be considered in the development of
the Future Development Strategy in 2018.
There are other measures across a range of themes that can also address the affordability challenge.
These measures are being developed by the SmartGrowth partners and other parties to create a Smart
Housing Action Framework for the sub-region which will be integrated with the Future Development
Strategy. Ultimately, the above factors relating to price point for renting or buying housing, and its
relationship to household incomes, influence how the population is spread across a housing
continuum ranging from homelessness through to ownership of market housing. The current
breakdown of households across this continuum is shown in Figure 1.15.
Figure 1.15 - Housing Continuum as at 2017 for Tauranga City and Western Bay of Plenty District
Projections indicate that by 2047 the proportion of households that will have an acute housing need
- being those in ‘emergency, homelessness & crowding’, ‘social housing’ or ‘stressed private renters’
situations - will increase from 21% to 28% in Tauranga City and from 16% to 22% in the Western Bay
of Plenty District. This means that based on current trends, around 30,000 households will be in a
situation of acute housing need. This trend is heading in the wrong direction in terms of meeting the
needs of the population and therefore the wellbeing of residents in the sub-region. In developing the
Future Development Strategy in 2018, measures to address this negative trend need to be front of
mind and will require measures beyond the supply of land for market driven housing development.
8
See Appendix 6E.
22SmartGrowth Housing and Business Development Capacity Assessment 2017
Housing and Māori
There are unique aspects to the demand and supply considerations as they relate to housing for Māori.
There are also distinctions to be made between tangata whenua, i.e. Māori from iwi that have
whakapapa connected to the sub-region, and Māori that do not have such connections to the land.
There are extensive areas of multiply-owned Māori land associated with local iwi. In addition, treaty
settlements also result in land transferring back to iwi and hapu. These unique factors are outlined
below as they relate to housing for Māori in the sub-region.
Māori
Approximately 27% of the population in the western Bay of Plenty sub-region identified as being of
Māori descent in the 2013 census. This population is relatively younger than the European population
and also is projected to have less structural ageing over the next 30 years.
In terms of spatial distribution there are areas in the sub-region with very high proportions of the
resident population being of Māori descent. Table 1.4 lists the highest proportion areas based on data
from the 2013 Census.
Table 1.4 - Proportion of resident population with Māori descent
Census Area Unit Proportion of Māori Descent
Matakana Island 95%
Matapihi 80%
Maketu Community 71%
Kairua 57%
Paengaroa 40%
Yatton Park 40%
Rangiuru 36%
Poike 33%
Te Puke West 32%
Gate Pa 30%
Home ownership rates for Māori are noted to be around half the rate observed for the population
generally, being around 30% at the 2013 census. It is noted that Pacific peoples have even lower rates
of owner occupation being less than 20% in 2013.
Māori households tend to be bigger on average than European households, due in part to the strong
concept of whanau among Māori, with it being common for multiple generations of an extended
family to cohabit, reflecting these cultural values.
Tangata Whenua
Tangata whenua are those Māori whose whakapapa (geneology) is directly affiliated with the sub-
region. There are 15 iwi groups that identify whakapapa to the western Bay of Plenty sub-region. Some
of the areas shown in Table 1.4 with high proportions of resident Māori population also exhibit a
corresponding high proportion of Māori with whakapapa to those areas. Data is not readily available
as to the ownership rates of tangata whenua compared to Māori as a whole. This is a potential area
for further analysis.
23SmartGrowth Housing and Business Development Capacity Assessment 2017
Multiply-Owned Māori Land
There are extensive areas of multiply-owned Māori land across the sub-region linked to these iwi
groups. Note there is a correlation between the areas with a high proportion of resident Māori and
the areas with a high proportion of multiply-owned Māori land.
There is roughly 22,000 hectares of Māori land within the western Bay of Plenty sub-region9. This
represents approximately 10% of the total land area within the sub-region. Nearly all (96%) of
multiply-owned Maori land within the sub-region is currently zoned rural.
It is noted that not all of this land presents characteristics that would support urban development in
terms of physical characteristics. Further there are complicating factors that significantly impact the
ability of multiply-owned Māori land to be developed for urban purposes, such as access to capital
and finance, land administration and infrastructure services. Development of multiply-owned Māori
land requires firstly an order from the Māori land court. The Māori land court rarely provides for
alienation of multiply-owned Māori land from its iwi (i.e. sale of fee-simple title).
Treaty Settlement Land
Treaty settlements have resulted in transfer of lands previously alienated from tangata whenua back
to iwi and hapu groups. An important principle for most iwi negotiating settlements is the concept of
“riro whenua atu, hoki whenua mai, land was alienated and therefore, land should be returned”.
Four iwi10 have completed settlements in the western Bay of Plenty sub-region: Ngāti Makino,
Waitaha, Tapuika and Ngati Pukenga; there is one settled iwi entity – Affiliate Te Arawa; and five iwi
are awaiting settlement legislation: Ngati Ranginui, Ngai Te Rangi me Nga Potiki, Ngati Tamatera, Ngati
Maru, and Ngati Hako. The other iwi are either in negotiation phases or are yet to secure a mandate
to negotiate with the Crown.
Treaty settlements within the sub-region, while not totally complete, are estimated to total more than
$250 million. Settlements include a mixture of relationship agreements, management and governance
arrangements over culturally significant resources, protected rights over resources, commercial and
cultural property, and financial redress. More than 90% of lands returned to iwi through settlement
are cultural property and have limitations on development. Nearly all cultural property is zoned rural.
Further, settlement land in an urban context sometimes comes with encumbrances such as schools,
public utilities and other government services. These factors can limit the potential opportunities for
settlement land to contribute to land supply for housing.
Commercial property has the most potential for land development. Given iwi are at different stages
of the settlement process, it is difficult to assess the commercial aspirations collectively. Some iwi are
well advanced in their development plans, while other iwi are still developing their investment
strategies. An example of advanced planning is the current development of the ‘Manawa’ estate in
Wairakei by Nga Potiki. This is a 240-dwelling development that includes provision of 30% of the
dwellings for affordable and assisted ownership housing for iwi members, as well as housing available
to the open market, including duplex typologies. Waitaha also have development aspirations for a
land holding adjoining the ‘Manawa’ estate that was returned through treaty settlement.
9
WBOPDC 20,083.8ha and TCC 1951.28ha (2005)
10
Completed Deeds of Settlement and Legislation
24You can also read