EU Biofuel Policies - A Carbon Map for Kalimantan and Sumatra - by Mareike Lange in Practice
←
→
Page content transcription
If your browser does not render page correctly, please read the page content below

EU Biofuel Policies in Practice
– A Carbon Map for Kalimantan
and Sumatra
by Mareike Lange

No. 1863| December 2013

Kiel Institute for the World Economy, Hindenburgufer 66, 24105 Kiel, Germany

Kiel Working Paper No. 1863| August 2013

EU Biofuel Policies in Practice – A Carbon Map for Kalimantan and
Sumatra*

Mareike Lange

Abstract:

It is still difficult for biofuel producers to proof the contribution of their biofuels to reducing carbon
emissions because the production of biofuel feedstocks can cause land use change (LUC), which in
turn causes carbon emissions. A carbon map can serve as a basis to proof such contribution. I show
how to calculate a carbon map according to the sustainability requirements for biofuel production
adopted by the European Commission (EU-RED) for Kalimantan and Sumatra in Indonesia. Based on
the carbon map and the carbon balance of the production process I derive maps showing the possible
emission savings that would be generated by biofuels based on palm if an area were to be converted to
produce feedstock for this biodiesel options. I evaluate these maps according to the criterion contained
in the EU-RED of 35% minimum emission savings for each biofuel option compared to its fossil
alternative. In addition, to avoid indirect LUC effects of the EU-RED that might offset any
contribution of biofuels to reducing carbon emissions, I argue that all agricultural production should
be subject to sustainability assessments and that for an effective forest protection, policies need to
address the manifold drivers of deforestation in the country. In this effort, my resulting carbon maps
can be the basis for a sustainable land use planning with a strategy to reactivate degraded areas that is
binding for all agricultural production in the country.
Keywords: biofuels, carbon emissions, Renewable Energy directive, carbon map, land use change,
Indonesia
JEL classification: Q42, Q58, Q56, Q16

Mareike Lange
Kiel Institute for the World Economy
24100 Kiel, Germany
Telephone: +49(0)431-8814-461
E-mail: Mareike.lange @ifw-kiel.de

This paper is part of the Global Land Use Change project steered by the WWF Germany and
supported by the German Federal Ministry for the Environment, Nature Conservation and Nuclear
Safety. I want to thank the whole project team from WWF Germany, WWF Colombia and WWF
Indonesia and in particular Adam Dixon and Oki Hadian for their invaluable and continuous support.

____________________________________
The responsibility for the contents of the working papers rests with the author, not the Institute. Since working papers are of
a preliminary nature, it may be useful to contact the author of a particular working paper about results or caveats before
referring to, or quoting, a paper. Any comments on working papers should be sent directly to the author.
Coverphoto: uni_com on photocase.com
1. Introduction

One of the components of the European Commission´s (EC) strategy to replace fossil energy sources
by non-fossil renewable sources is to expand the production of biofuels. On the one hand, this
promotion of biofuels has been widely criticised. Due to an increase in biomass demand for feedstocks
for biofuel production and a continuously high demand for feedstocks in the food and feed sector, the
demand for agricultural land is expected to increase globally (Erb et al. 2009, Hertel et al. 2008,
Haberl et al. 2011). Meeting this demand causes emissions from LUC that still contribute
approximately 9% to global emissions (Global Carbon Project 2011). Thus, it is questionable whether
using biofuels can reduce emissions as long as there are any emissions from LUC.

On the other hand, biofuels are considered to be especially important for reducing the dependency of
the transport sector on fossil fuel and for decarbonising the fuel it uses. Through its biofuel
sustainability regulation (EU-RED), the EC seeks to achieve a minimum target of 10% renewables in
the transport sector by 2020 (EU-RED 2009). The EU-RED was supplemented by a regulation
stipulating a mandatory reduction of 6% in the emission intensity of fuels used in transport (European
Union 2009) to emphasize the aim to reduce greenhouse gas emissions (emissions). According to the
national renewable energy action plans biofuels will account for 90% of the mandated target of 10%
renewables in the transport sector (EC 2011).

To ensure that biofuels contribute to a reduction in emissions and that biofuels are sustainably
produced, the EU-RED contains a sustainability regulation in order to avoid undesirable LUCs caused
by expanding biofuel feedstock production. These undesirable LUCs can be divided into direct land
use change (DLUC) and indirect land use change (ILUC). DLUC is the conversion of land that has not
been cultivated before, into land used to produce a particular biofuel feedstock. ILUC is an external
effect of the promotion of biofuels. This effect is caused by changes in prices for agricultural products
on the world market, particularly food and feed products in the form of grains and oils. The cropland
used to produce food and feed is reduced globally when the cropland is used to produce biofuel
feedstock instead. Consequently, the supply of food and feed products on world markets is reduced,
which drives up their prices, which in turn creates an incentive to convert new land to produce food
and feed.

Regarding DLUC, the EU-RED stipulates that, in order to be counted towards the 10% target imposed
on the mineral oil industry, biofuel feedstocks may not be produced on land with high carbon stocks
such as continuous forests or peatlands, or on land with high biodiversity.

In addition, in order to assure that biofuels reduce emissions even when they cause emissions from
DLUC, the EU-RED stipulates a mandatory minimum emission saving threshold. Accounting for
possible emissions from DLUC and emissions from production and transportation till the final use of
the biofuel, it has to be proved that each biofuel will provide emission savings of at least 35%
compared to the fossil fuel alternatives

The EC implemented the EU-RED by adapting 13 certification schemes 1aimed at verifying
compliance with the sustainability criteria set out in the EU-RED, including those regarding DLUC.
Within the certification process it is possible to account for possible emissions from DLUC as they can
be directly linked to a particular biofuel production, and can thus be allocated to the specific emission
balance of the biofuel at hand.

In practice, the main problem for producers to verify compliance with the sustainability criteria is to
account for possible emission from DLUC because the land use at the beginning of 2008 must be
known. This is because 2008 is the reference year to calculate emissions from DLUC. Thus, for an
individual accounting of emissions from DLUC, the producer needs a land cover and carbon map of
2008 of the cultivation area used to produce the feedstock to be potentially certified. A carbon map
displays the carbon stocks stored in the biomass and soil of different land covers. Such maps are often
not available, particularly in remote areas. This increases the cost of the certification process for the
individual producer as the land cover and carbon stock of 2008 would need to be determined in an
individual assessment. This can be an exclusionary burden for small producers.

Beyond the direct accounting of possible emissions from DLUC for EU-RED, a carbon map could
represent a tool for land use planning which aims at reducing emissions from land use change in
general. If land use change is only allowed on areas with low carbon content, emissions from land use
change would be reduced compared to a situation where land use change is allowed independent of the
carbon stock stored in the expansion area. This is in line with the claim of researchers that land use
change emissions cannot be controlled for biofuels alone but need to be controlled for all agricultural
production in order to avoid ILUC effects.

Thus, the problem of ILUC regulation is only a problem of an incomplete emission accounting of land
use practices when only biofuel production is subject to such accounting, but food, feed and bioenergy
production other than biofuel production are not (see also Lange 2011, Lange and Delzeit 2012). A
land use planning based on a carbon map for all agricultural production could thus be a tool used for
an overall reduction of land use change emissions. Including all agricultural production in such land
use planning by defining priority areas for expansion would account at the same time for the need of
countries to further develop their agricultural sector and meet increasing global demand for
agricultural production.

The use of maps that determine carbon stored in natural vegetation has already become the common
tool for countries preparing for the UNFCCC (united Nations Framework Convention on Climate
Change) REDD+ (Reduced Emissions from Deforestation and Degradation) mechanism that aims to
pay developing countries to halt their deforestation (Gibbs et al. 2007) Such maps could be used to
determine a baseline for the payments and to monitor deforestation over time. Two examples of global

1
 ISCC, Bonsucro EU, RTRS EU RED, RSB EU RED, 2BSvs, RBSA, Greenenergy, Ensus, Red Tractor, SQC,
Red Cert, NTA 8080, RSPO RED, Biograce GHG calculation tool
above ground carbon maps can be found in Saatchi et al. 2011 and Baccini et al. 2012. Due to their
different purpose, maps produced for REDD+ cannot be used here as they focus only on determining
carbon in forests. In addition, they aim at determining forest carbon dynamics, do not necessarily start
at the baseline year 2008 for biofuels and do not necessarily have a spatial resolution of 30 meters as
required by the EC.

In this paper I show how a carbon map that is in line with the EU-RED requirements could be
calculated for Kalimantan and Sumatra in Indonesia and how it could be further used to control
compliance with the EU-RED criteria. Going beyond the EU-RED requirements, I additionally discuss
which consequences such map brings for a sustainable land use planning in this region. Indonesia is
the largest producer of palm oil in the world and due to the cheap price for palm oil on the world
market, it is possibly used to produce biodiesel for the EU biofuel target. At the same time, Indonesia
has experienced tremendous forest losses in the last decade causing accelerated biodiversity loss and
very high land use change emissions from converted forest and peatland areas. Thus, a land use
planning that accounts for the carbon emissions is urgent in Indonesia, not only for the sustainability
requirements of the EU-RED. I begin by briefly presenting the method and data requirements to
calculate land use change emissions in the EU-RED context which draws on the method in the IPCC
2006. Next, I present the database for my calculation of the carbon mapping and then present the
resulting carbon maps. Finally, I apply the carbon mapping to the sustainability requirements of the
EU-RED and draw conclusions.

      2. EU‐RED sustainability requirements and land use change calculation

To first understand which criteria a carbon map for the EU-RED needs to fulfil, in this section I
shortly discuss the sustainability requirements of the EU-RED. These sustainability requirements
mainly tackle the problem of possible DLUC to produce feedstocks for biofuel production. Under this
framework, which is shown systematically in figure 1, biofuels and bioloquids shall not be made from
raw material obtained from land with high biodiversity value (primary forest and other wood land;
areas designated for nature protection or protection of rare, threatened, endangered ecosystem or
species; and highly biodiverse grasslands), lands with high carbon stocks (wetlands, continuously
forested areas with a canopy cover higher than 30%2, and land spanning more than one hectare with
trees higher than five meters and canopy cover of between 10% and 30%, unless evidence is provided
that the carbon stock before and after conversion apply to saving greenhouse gas emission at least at
35% (EU-RED Art.17(3,4)).

For all other production areas, accounting for possible emissions from DLUC and production and
transportation emission, it has to be proved that the resulting biofuel will provide emission savings of
at least 35% compared to the fossil fuel alternatives (EU-RED Art 17(2))(third column of Figure 1)
2
    This corresponds to the upper level of canopy cover of the forest definition in UNFCCC (2001)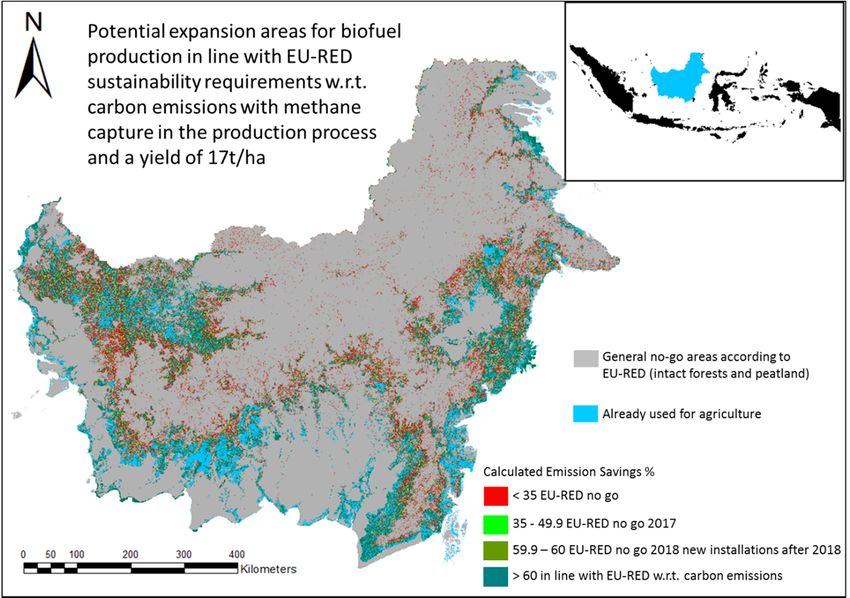
This implies that biofuel crops produced on land with high carbon content before the land use change
are less likely to achieve this target as well as biofuels with low energy yields per hectare and high
process emissions. This minimum emission saving threshold will be increased to 50% in 2017 and
60% in 2018 for new installations for biofuel production (EU-RED 2009).

These sustainability requirements need to be met by both imported bioliquids and bioliquids produced
within the European Union in order to count towards the national targets of renewable energy.

Figure 1. Framework of the EU-RED sustainability regulation

This paper focuses on the third column of the sustainability criteria, which is all area which is not
already excluded by definition from being suitable for biofuel production. However, as far as possible,
column 1 and 2 are included into the final maps in order to get the full picture. Thus, the major
challenge of this paper is to provide a good measurement of potential DLUC emissions that would
occur if an area where to be converted for biofuel feedstock production. This measurement is based on
the carbon map. According to the EU-RED, the method and data used for the calculation of emissions
from DLUC should be based on the IPCC Guidelines for National Greenhouse Gas Inventories –
Volume 4 (IPCC 2006) and should be easy to use in practice (EU-RED Annex V C(10)). With the
“Background Guide for the Calculation of Land Carbon Stocks in the Biofuels Sustainability Scheme
drawing on the 2006 IPCC Guidelines for National Greenhouse Gas Inventories” Carré et al. 2010
published guidelines for the calculation of land carbon stocks for the purpose of Annex V of the EU-
RED.

3. Carbon Mapping according to the EU‐RED for Sumatra and Kalimantan

In this section I demonstrate the method of the EU-RED for calculating carbon emissions from land
use change as presented in Carré et al. 2010. I only go into the details of Carré et al. 2010 where it is
relevant for our purpose. After each major calculation step I present the data I used for the carbon
mapping in Sumatra and Borneo.

For the calculation of a carbon stock              per unit area i associated with a particular land use l, the
carbon stock stored in the soil                  and the carbon stock stored in biomass                 need to be
                                                                           3
summarized and multiplied with the hectares per unit area              .

                                                                                     1

             a. Biomass Carbon
                       I. Method

For the calculation of carbon stock stored in biomass                      it is assumed that it can be subdivided
into carbon stock stored in above ground biomass                   , below ground biomass                and dead
organic matter            4.   The carbon stock stored in below ground biomass is normally calculated by
applying a constant ratio factor        to the carbon stock stored in above ground biomass.

                                                                                         2

                                                                                         3

                       II. Data

Different methods are available for the calculation of the carbon stock stored in biomass. The very
basic method for a producers is to produce ground based inventory data of the land cover classes
present on their land. The carbon values could be determined by field surveys on the diameter at breast
height which along with information on tree height can be converted to estimates of forest carbon
stocks using allometric relationships (Wertz-Kanounnikoff 2008). Data on the allometric relationship
can be based on data from sample sites or forest inventories (Wertz-Kanounnikoff 2008). However,
this method seems like a disproportional burden particularly for small producers. In addition, to
determine land use change emissions, not the present but the land cover present in 2008 is the
reference land cover. If there have been changes in between, it might be difficult to retrace the land
cover in 2008.

3
  Normally one uses one hectare as the unit area. However, it could be every other area like the area of a pixel if
the analysis is made on the basis of a raster data set.
4
  In line with the EU-Red we use a value of 0 for C_DOM, except in the case of forest land – excluding forest
plantations – having more than 30% canopy cover.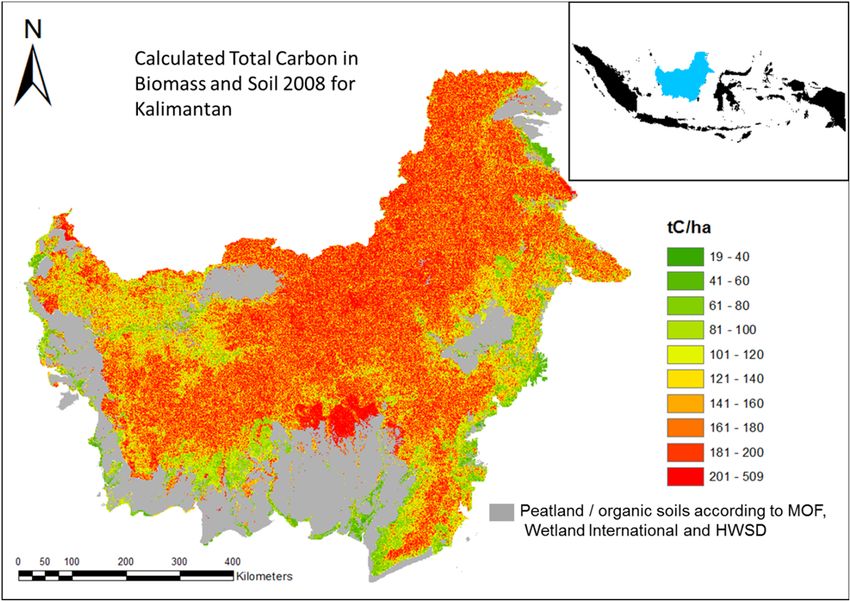
The most commonly used method is to use land cover maps based on satellite images and to combine
them with carbon values that represent the biome-average carbon value. This method corresponds with
the Tier 1 method of the IPCC. The EC adopts this method presenting carbon values for the purpose of
calculating emissions from LUC in Carré et al. 2010. Other data sources is the scientific literature on
carbon values generated on sample sites. A major drawback of this method is that the biome average
analyzed in the scientific literature does not necessarily adequately represent biome or region or
overestimate the carbon stored in premature stands (Gibbs et al. 2007, Wertz-Kanounnikoff 2008,
Goetz et al. 2009)

There has been a fast development of techniques to determine above ground biomass carbon in
particular for tropical forests via remote sensing techniques based on active signals such as Synthetic
Aperture Radar technologies (SAR) and or Light Detection and Ranging (LIDAR) (Engelhart et al.
2011). The signal of SAR penetrates through clouds and returns the ground terrain as well as the level
of the top of the canopy cover which in turn gives the basis for deriving the height of the biomass
cover. Thus, SAR provides a 2 dimensional image of the ground. If slightly different angles are used,
this 2D image can be converted into a 3D image. The knowledge about typical biomass heights of
different land covers can then be used to derive a land cover map (Mette et al 2003, Kellndorfer et al,
2004, Shimada et al 2005). Recent applications to tropical forest can be found e.g. in Gama et al. 2010,
Engelhart et al. 2011, Kuplich et al. 2005, Michard et al. 2009, Pandey et al. 2010 or Santos et al. 2006

Instead of using radar signals, the Light Detection and Ranging (LIDAR) method uses pulses of laser
light and analyses the signal return time (Engelhart et al. 2011). This method cannot penetrate through
clouds but allows estimating the height and density of the biomass cover resulting in a detailed 3D
image (Patenaude et al 2004). The biomass density and height is linked to biomasses and thus the 3D
image can be converted into above ground carbon estimates applying allometric height–carbon
relationships (Hese et al 2005). Recent application for tropical forest can be found e.g. in Saatchi et al
2011, Duncanson et al. 2010 or Zao et al. 2009.

The purpose of this paper is not to evaluate the different methods but to demonstrate the use of the
available data and maps for the sustainability regulation of the EU-RED5 in the study regions.
Therefore, I use two different methods due to the availability of data for the study regions. For
Sumatra I use the official land cover map of the Ministry of Forestry of Indonesia combined with the
biome-average approach (MOF) (Figure 1).

The use of a land cover map like the MOF map is appropriate here as the aim of this map is to provide
a carbon mapping for the EU-RED. The motivation behind Lidar and Radar applications is mostly
because REDD+ projects require an explicit determination of the carbon stored in the biomass of
forest to determine a baseline for the payments for ecosystem service mechanism. For the EU-RED the
land cover change/land use change emissions are the important figure to determine. However, this is

5
    A comparison of different methods can be found in Goetz et al. 2009 or Wertz-Kanounnikoff 2008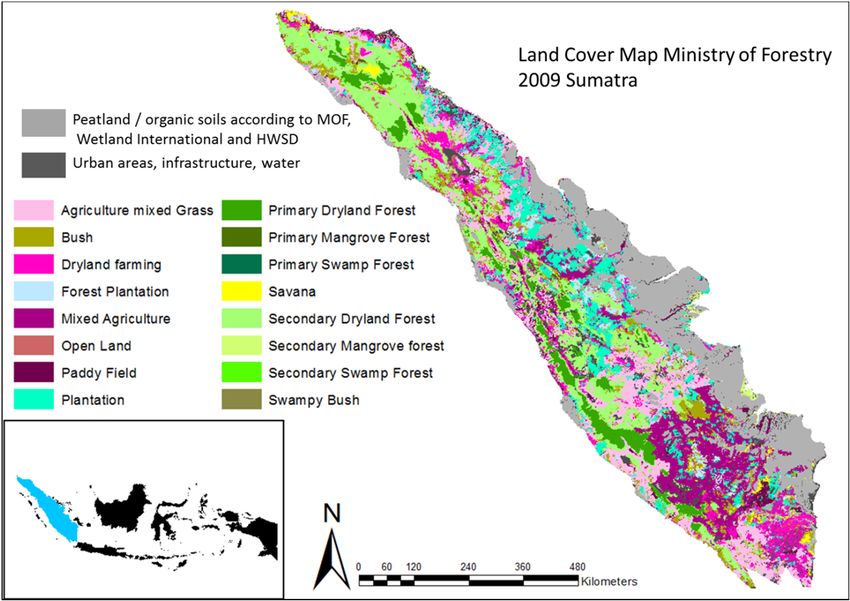
less relevant for forest as forests and wetlands are generally excluded from being suitable areas for
feedstocks to produce biofuels. In addition, there is also a cost benefit in the choice of the method as
Landsat and others optical sensors are cheaper than LIDAR or SAR technology. Last but not least, the
impact of a derived carbon map strongly depends on the acceptance of policy makers and producers in
the country. The MOF map is officially recognized by the Indonesian authorities which is important
to feed in results into the political decision process of land use planning.

Figure 2

The land cover map for Sumatra in figure 2 shows already very large areas used for agricultural
production and only small areas left with natural forest cover. The light grey areas represent
peatswamp areas that I derive as the sum of 3 different sources. First I use all swamp areas of the
MOF land cover map. In addition I use information from Wetlands International (Wetlands
International 2008) on organic soil content as well as organic soils from a soil map based on the FAO
harmonized world soil database generated by IIASA (FAO/IIASA/ISRIC/ISSCAS/JRC, (2012). I do not
calculate the carbon content for these areas as first they are generally excluded from the suitable areas
of the EU-RED and second the method presented here is not appropriate for the calculation of
emissions from organic soils. 6 I will come back to the second point when presenting the method for
the carbon content in the soil.

6
 The EU-RED allows production on peatland soils if they were already converted into palm plantations in 2008
and the production does not cause further drainage of the soil. With my databases I am not able to control for the
To convert the land cover map into a map that displays the carbon stock stored in above ground
biomass, the values for carbon stock stored in above ground biomass associated with different land
cover classes were taken from several sources. All values could have been taken from Carré et al. 2010
or the IPCC 2006, however, these carbon values do not always correspond one to one to the land cover
classes in the map. Furthermore, Carré et al. 2010 or the IPCC (2006) values are, if at all, only
specified for Asia in general and not specific for Indonesia. The exact values used in the calculation
and the respective sources are listed in the data tables of ANNEX 1. For some of the carbon values
taken from the Carré et al. 2010 or the IPCC 2006, the climate zone of the area must be known. For
this purpose, I used the climate zone map provided by the Joint Research Centre (EC-JRC 2010).

The resulting map on carbon stocks stored in total biomass is shown in Figure 2. One can clearly
determine the difference between the large carbon stocks in the remaining natural forest and the very
low carbon stocks in the already cleared and used areas.

Figure 3.

For Kalimantan, other data were available which were generated by Sarvision7 within the Global Land
Use Change Project of WWF Germany. A detailed description of the data generating process can be
found in Sarvision (2011).

status of the peatland neither do I have information on the production possibilities on peat-soils not fully drained.
In addition, I am not able to control whether fully drained peatland soils do not cause more emissions than
mineral soils under continuous agricultural production.
7
  Sarvision is a spin-off of Wageningen Universtiy http://www.sarvision.nl/.
In order to derive a above ground biomass carbon map Sarvision (2011) used a combination of a
vegetation structural type map derived from recent ALOS PALSAR radar satellite imagery that can
see through clouds, and ICESat-GLAS spaceborne LIDAR height measurements that can be related to
above ground biomass. A total of 17 different vegetation structural types were detected to be different
in the coastal zones and the interior of Kalimantan using supervised classification techniques over the
radar images (Sarvision 2011). Two different types of high forest were mapped in addition to peat
swamp forest, mangrove forest, riparian forest, swamp forest and grasslands (Sarvision 2011).
Detection of human affected areas was also possible including two types of degraded forest,
shrublands, (oil palm) plantations and agricultural areas (Sarvision 2011). The vegetation structural
type map was thoroughly validated using available field data observations in different areas of
Kalimantan, georeferenced photographs and very high (0.5-1m) resolution remote sensing imagery
available in Google Earth (Sarvision 2011). Validation of biomass map was done using biomass data
based on field measurements collected for the assignment by Utrecht University (Sarvision 2011).
Thus Sarvision 2011 provided two maps for this mapping exercise: A land cover map which is shown
in figure 3 and map of above ground biomass density. I convert the unit of the map of biomass
densities into carbon by multiplying the map with 0.47. In order to add carbon in below ground
biomass I apply a constant ratio factor R (see equation 3). Figure 4 shows the resulting map displaying
carbon stored in total biomass.

Figure 4
Compared to Sumatra, in Kalimantan large forest areas still remain. However, especially in the south
of the island and in parts of the east, already large plantation areas and degraded forests exist.
Naturally, this structure also shows in the biomass carbon map where the highest carbon stocks can be
found in the forests of Central Kalimantan (figure 5).

Comparing both maps, on land cover and carbon in biomass, it clearly shows the strength of Lidar and
Radar analysis compared to the use of only land cover maps combined with carbon values from the
literature as done for Sumatra. The combination of both maps show the high range of carbon values
within one land cover class. A unique value from the literature can at best show the average carbon
stored in a particular land cover class. For instance, based on Figure 5, for the land cover class of high
forest with closed canopy the mean value of carbon in biomass is 139 tC/ha. However, the standard
deviation of 91tC/ha shows exemplary the high range of possible carbon values within one land cover
class. The detailed carbon map in Figure 5 covers the whole range of carbon values and therefore
represents the carbon stock at the local level with a much higher accuracy. As these data are produced
to influence local production decisions their accuracy should be as high as possible.

Figure 5
b. Soil Carbon
                      I. Method

For the calculation of the carbon stock stored in the soil, information of the land cover map needs to be
combined with a soil map. This is because the carbon stock stored in the soil under natural vegetation
is changed once the land is used for agricultural production. Soil maps are commonly provided by
national institutions as they cannot be derived directly from remote sensing methods. Here, I only
consider the Tier 1 approach of the IPCC 2006 which models soil carbon stocks influenced by climate,
soil type, land use, management practices and inputs. The method is based on the assumption that the
actual carbon stock stored in the soil               is the product of the carbon stock under natural land
cover              and the influence of land use          , management               and input factors        ,
                                                                                 8
which can increase or decrease the carbon content under natural land cover. Thus, the working steps
to be done for the calculation of a soil carbon map is to first choose a suitable soil map, second,
allocate the carbon values for soil under natural land cover to the soil categories in the map and, third,
define and allocate the influence factors from the IPCC 2006 based on the land cover map (see
equation 4).

The reasons why I generally exclude peatland areas from this mapping exercise are the following. The
carbon content is to be calculated for the first 30 centimeters according to EU-RED as this is the layer
where most of the carbon is stored in mineral soils. This does not apply for peatswamp areas which
can have a thickness of several meters. In addition, the EU-RED method based on the IPCC 2006
assumes that the carbon content of a soil after a land use change stabilizes again after 20 years of
agricultural production (excluding emissions from tillage and inputs). This is an arbitrary assumption
for calculation purposes but not totally unrealistic for mineral soils. However, peatland soils converted
to agriculture can keep on causing emissions for hundreds of years and for sure do not stabilize after
20 years. For a discussion of annual emission factors for different land uses in Southeast Asian
peatlands see e.g. Hergoulc’h and Verchot (2013).

                                                                                              4

                      II. Data

The EC provides a soil map based on the FAO harmonized world soil database (HWSD) generated by
IIASA (FAO/IIASA/ISRIC/ISSCAS/JRC, (2012) (see figure 6 for Sumatra and figure 7 for
Kalimantan).

8
 The EU Background Guide gives more details and data about land cover classes not explicitly covered by the
IPCC 2006 e.g. savannahs and degraded land.
Figure 6 Figure 7
The categories used in this map correspond to the categories of the SOCref values in the IPCC 2006.
These values are climate region specific. To determine the climate zone of a certain area I use the
climate map provided by the EC. As a first step I generate a map of soil carbon as if the whole area
where under natural land cover by combining the SOCref carbon values with the HWSD soil map. The
SOCref carbon values corresponding to the soil map categories are taken from the EU Guidelines
which draw on the data in IPCC 2006 (figure 8 SOCref Sumatra).

Figure 8

As a second step, to determine the actual carbon stock stored in the soil, the carbon stock under natural
land cover must be adjusted with the soil use factors that correspond to the current (2008) land use.
For natural land cover these factors are 1. Thus, the soil carbon under natural vegetation remains the
same after this calculation step. For all other land use with non-natural land cover, these factors
indicate how much the land use type, the management practice and the inputs change the carbon stock
stored in the soil compared to a natural land cover (see equation 4). The categories for the land use
type factor are annual cropland, perennial cropland, pasture or forest plantations. The categories for
the management factor mainly account for the tillage regime and the input factor account for the
amount of fertilizer/manure applied to the production. In order to determine which of these factors
apply, I use the land cover map. I do this by defining for each land cover category the land use factor,
the typical management regime applied for a particular land use in the region and the corresponding
typical input. The corresponding values for the factors are exclusively taken from the EU/RED and the
IPCC 2006. Thus, to determine the actual carbon stock stored in the soil                   I multiply the
SOCref calculated in the first step with these soil factors according to equation 4. (Figure 9 SOCact
Kalimantan).

Figure 9.

             c. Total Carbon Map

I calculate the final carbon map by overlaying and summarizing the map about carbon stocks stored in
total biomass and the map about actual carbon stocks stored in the soil. The result is a carbon map
which indicates the high and low carbon stock areas in a region. Figure 10 and 11 show these maps for
Sumatra and Kalimantan respectfully. Results mainly mirror the results of the carbon maps of only the
biomass cover at a higher level as I excluded the very large carbon pools in peatland soils. This means
very high carbon stocks in the forest areas and low carbon stocks in the areas already used for
agricultural production. Again, the Kalimantan map shows in much greater detail the local carbon
stocks as varying carbon values within one land cover class are possible. Therefore, particularly the
areas with medium biomass cover in the transition areas to the forest and the areas at the deforestation
frontier seem to be represented with a higher degree of detail. These areas will be the first deforested
for new plantations as they are closest to already existing production areas. Thus, these areas will be
important for certifiers and the higher accuracy of local carbon values will guide a more realistic result
of the certification process.
Figure 10: Figure 11:
In addition, the resulting carbon maps can serve as a basis for a low carbon spatial planning for a
sustainably expanding agricultural sector. Low carbon stock areas could be priority areas for
agricultural expansion whereas high carbon stock areas should remain untouched for a climate friendly
expansion policy. Again, a higher detail in local carbon values will allow a more detailed and accurate
land use planning process.
4. Sustainable production areas under the EU‐RED emission saving requirements
For the practical implementation of the sustainability regulation of the EU-RED, a further step of
calculation is necessary. To prove the compliance with 35% emission saving threshold, the emission
savings for each spatial unit that would occur if this spatial unit were to be converted into cropland to
produced biofuel feedstock need to be calculated. Thus, I calculate the emission savings of each spatial
unit if this unit were converted into a palm plantation to produce feedstock for biofuel production.
Emission savings represent average annual savings for a production period of 20 years.9
For the calculation, first, the emissions caused by the land use change needs to be calculated
by just taking the difference of the carbon stocks stored in the land use at t0 (which is 2008
for the current regulation) and the carbon stocks stored in the land use at t1 (which is the after the land
use change). For our purpose, t1 represents the carbon stock stored in palm plantation
_ _ .
5
I derive _ _ by repeating all calculations steps under the assumption that all areas
are under palm plantations.
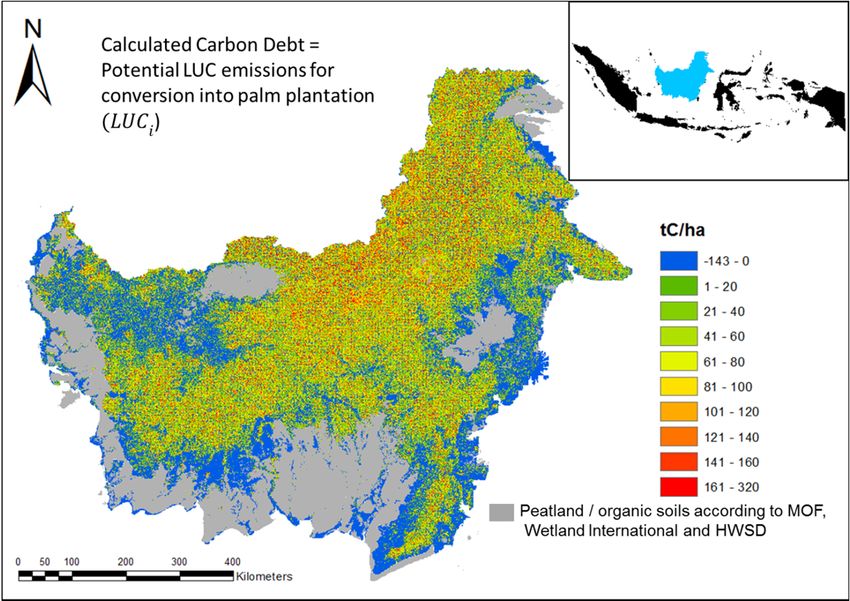
Figure 12 shows the result of this calculation step exemplarily for Kalimantan. Areas colored in blue
would generate a gain in carbon storage when converted into a palm plantation. All other areas result
in carbon emissions. Thus, the conversion of these areas into palm plantations would generate a
carbon dept. Figure 12 shows that this mainly applies to all forest areas.Figure 12:
Second, I convert the total emissions caused by the land use change into emissions per year on
the basis of a 20 year period and convert carbon stocks into carbon dioxide stocks by multiplying the
former by the factor 3.664. Third, I convert the LUC emissions per hectare into LUC emissions of the
final biofuel unit _ . Thus, I divide the LUC emissions per hectare with the energy yield per
hectare of the biofuel feedstock . Consequently, the resulting LUC emissions per MJ biofuel
_ are specific for each biofuel due to the specific energy yield per hectare. Higher energy
yields result in fewer emissions per MJ biofuel.10
1 1000000
∗ 3.664 ∗ ∗ ∗ 6
20
To complete the calculation of the LUC emissions, the EC allows for an allocation of the resulting
LUC emission to each biofuel or its intermediate products and possible by-products. The allocation
factor (AL) should be calculated on the basis of the energy content, that is, the lower heating value.
This means that for example from the soy bean, only the oil is used for biodiesel production. The
remaining soy cake is mainly used as animal feed. Consequently both the soy cake and the soy oil are
evaluated with their lower heating values. Then, land use and production pathway emissions are
10
I assume no production on degraded land and thus ignore a possible emission bonus granted by the EU-RED
for emission savings.allocated to the emissions caused by the soy biodiesel in the same proportion as the proportion of the
soy oil on the total lower heating value of the harvested soy bean. Equation 6 summarizes these
calculation steps.
Table 1. Production processes and yields
Source Source Source
Palm biodiesel with methane capture 123344.4 = Pancheco (2012)
0.91 IES 2008 37 EU‐RED
in the production process 17t/ha and FNR (2012)
Palm biodiesel without methane 123344.4 = Pancheco (2012)
0.91 IES 2008 68 EU‐RED
capture in the production process 17t/ha and FNR (2012)
Palm biodiesel with methane capture
145111.1 = Pancheco (2012)
in the production process and higher 0.91 IES 2008 37 EU‐RED
20t/ha and FNR (2012)
yields
As a last step, I calculate emission savings . Emission savings mean savings generated due to the
use of biofuel feedstock compared to the alternative use of fossil fuels. The term “emission savings”
used by the EU-RED is slightly misleading as it does not indicate that every biofuel saves emissions.
Emission savings could be also negative if the production and use of the biofuel causes higher
emissions than the fossil fuel alternative. With respect to land use change emissions, one can generally
say that high land use change emissions due to high carbon stocks before the land use change result in
low or negative emission savings. To calculate the emissions savings one has to add to the land use
change emissions the emissions caused in the production process ( ). These emissions
include all emissions from well-to-wheel (WTW), meaning all emissions from the production of the
feedstock until the transportation of the biofuel to the gas station. The total resulting emissions are
then compared to 83.8gCO2/MJ emissions the fossil fuel alternative and emission savings are derived
in %. These calculation steps are summarized in equation 7.
As the energy yield per hectare ( ), the emission caused in the production process ( ) or the
fraction of the biomass that is allocated to the biofuel production are specific for each biofuel option
( ), emission savings are also specific for each biofuel option(see Table1 for the values used for
equation 6 and 7 in the carbon maps). I use the default values for production emission from
the EU-RED for different biofuel production pathways and take average values for energy yields from
FNR (2012). I consider an allocation factor ( ) for the main co-products according to their heating
value11 based on EU-JRC Data (IES 2008).
11
The lower heating value is used as an indicator for the heating energy contained in a fossil fuel or organic
material. The EC decided to use this value as a unit to base on the allocation of emission on different co-
products.100
% ∗ 83.8 7
83.8
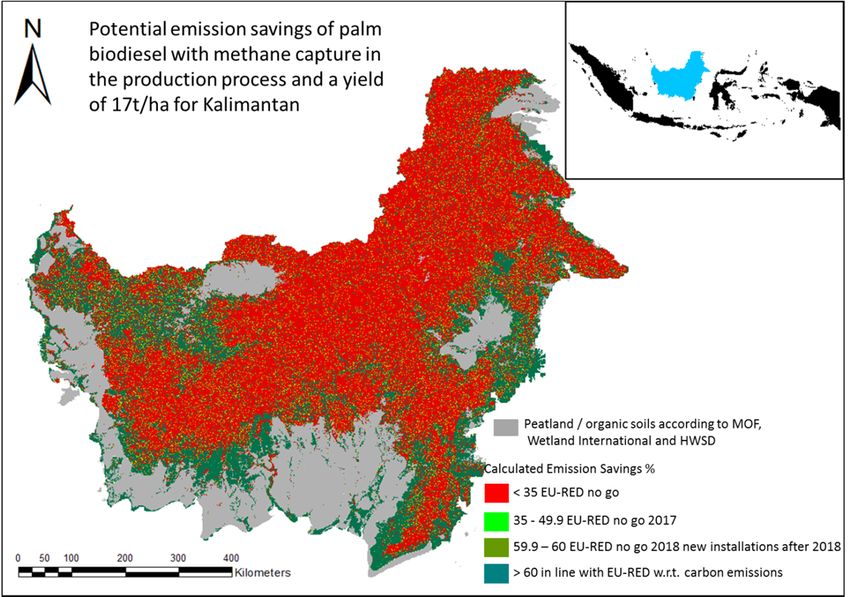
I calculate the emission savings of 3 different palm production processes which are shown in the maps
below: First, palm oil production with methane capture in the production process and an average yield
of 17t/ha (Pancheco 2012)12, second, palm oil production without methane capture in the production
process and an average yield of 17t/ha and, third, palm oil production with methane capture in the
production process and an average yield of 20t/ha (FNR 2012). I do this in order to check the results
on sensitivity with respect to efficiency in the production process and productivity assumed in the
calculation. 17t/ha is the average yield on Indonesian palm plantations. A yield of 20t/ha can be found
on more modern an productive plantations (FNR 2012).
The methane emissions in the production process result from the storage of the palm oil mill effluent
(POME). POME is the liquid residue when fresh palm fruit bunches are processed into crude palm oil.
In many mills, POME is stored in a chain of open lagoons during a certain period of time, where it is
cooled and where part of its organic matter content is degraded biologically which causes emissions of
biogas (Waarts and Zwart 2013). Beside carbon dioxide, methane is a major component of this biogas.
If the biogas escapes uncontrolled from the pond into the atmosphere it can strongly worsen the carbon
balance of palm based biofuel since methane is 21 times more effective as a greenhouse gas than
carbon dioxide (Waarts and Zwart 2013). In more modern palm oil mills methane is captured and can
be used for power generation.
In terms of the minimum emission saving threshold, it is allowed to use and convert land when the
final biofuel option does not cause less than 35% emission savings. Thus, according to the EU-RED,
all areas that result in 35% or more emission savings would be potentially eligible for certification
with respect to carbon emissions when converted for biofuel production. However, I do not consider
biodiversity or other sustainability criteria here and consequently do not call these areas “go-areas”.13
As the minimum emission savings threshold is about to rise to 50% for new installations from 201714
on, and to 60% in 2018 for installations built after 2017, I also indicate these thresholds in the maps of
Figure 13-18 which show the emission saving maps for Sumatra and Kalimantan and the 3 assumed
palm production processes. All green areas are sustainable production areas under the minimum
emission saving criterion. The different shades of green indicate the different levels of the minimum
emission saving threshold. Based on the total carbon map derived above, it is only logical that areas
with high carbon stocks are less likely to achieve the 35% minimum emission saving threshold than
areas with low carbon stocks.
12
Methane capture means the capture of methane gas from the anaerobic digestion of palm oil mill effluent in
open ponds.
13
Hadian et al. 2013 map several biodiversity indicators for Sumatra and Kalimantan. Forthcoming on
www.globallandusechange.org
14
The threshold might be increased already in 2014.Table 2: Area achieving the minimum emission saving threshold in Sumatra (47.3 million ha
total island area)
Area achieving the minimum emission saving
threshold under different emission saving
Palm oil thresholds
Areas excluded from
production
analysis Neutral
process
Emission 35% 50% 60%
Balance
No
methane peatland soils / swamp areas
16.7 16.7 16.7 16.7
capture and (Figure 14)
17t/ha yield
Methane
peatland soils / swamp areas
capture and 20.5 16.7 16.7 16.7
(Figure 15)
20t/ha yield
peatland soils / swamp areas
20.5 16.7 16.7 16.7
(Figure 13)
No-go areas by land cover
definition (forest and peatland
Methane 3.4 3.4 3.4 3.4
areas) and without areas
capture and
already used (Figure 19)
17t/ha yield
No-go areas by land cover
definition (forest and peatland 20.5 16.7 16.7 16.7
areas) (Figure 19)
For Sumatra (Figure 13.-15) results are clear and mainly independent on the production process and
the assumed productivity. This is because the remaining forest areas are is under no assumption in line
with the EU-RED sustainability criteria when converted into palm plantations. These areas are colored
in red in all emission saving maps. It is only the non-forest areas which are in line with the EU-RED
with respect to carbon. The planned increases in the minimum emission saving threshold, indicated
with the different shades of green, only change results in very few hectares. Thus, one can roughly say
that in 2008, the production area that achieves the minimum emission saving threshold in Sumatra is
under all emission saving thresholds 16.7 million ha (see table 2 for an overview of areas achieving
the minimum emission saving threshold). Only when considering a neutral emission balance, which
would mean zero emission savings, methane capture and an increases in yield can slightly increase this
area to 20.5 million ha.
Naturally, palm plantations remaining palm plantations and keeping their management practices have
no LUC emissions. Here, results in Figure 13-15 are purely driven by the process and transport
emissions. Under the EU-RED default WTW values, that means that a production with methane
capture is in line with the 35% emission saving threshold but a production without methane capture is
not.Figure 13 Figure 14
Figure 15

For Kalimantan results are similar to those in Sumatra (Figure 16-18). All forest and forest like
biomass are well beyond the 35% emission saving threshold and in most cases even result in much
higher emissions than those which can be saved in 20 years of biomass production. The different
thresholds can make a difference on the local level which is due to the very high resolution of the
Sarvision (2011) data which also captures small openings, water bodies and degraded areas. Thus, due
to the high range of carbon values within one land cover class it is well possible to find pixel above
and below the 35% emission saving threshold within this class.15

For a production process with methane capture and an average yield of 17t/ha the possible sustainable
production areas under the emission saving threshold criterion range from 19.4 – 15.8 million ha for
the 35% emission saving threshold to the 60% emission saving threshold. Thus, the increase of the
threshold will further reduce the sustainable production area but does not substantially change the
result (see Table 3).
15
   It is interesting that this high variability of results seem to vanish if the resolution of the data decreases. A
comparison of two global carbon maps from Saatchi et al. 2011 (1 km resolution) and Baccini et al. 2012 (500m
resolution) by Ed Mitchard from the University of Edinburgh (http://carbonmaps.ourecosystem.com/interface/
access 10.07.2013) show local differences in results by up to +/- 150 tC and much less variability in values
especially in the continuous forest areas. As more maps derived on active data emerge for this region the
sensitivity of results against methodological differences and scales should be analyzed. This variability in carbon
values are not that important for our results as the land cover map from Sarvision 2011 defines these areas as
continuous forest which are no-go areas by definition in the EU-RED. However, for REDD+ assessments results
should reflect the “real” carbon values as accurate as possible as payments are related to the carbon stored in the
forest biomass.
The production process can have a substantial impact on the areas achieving the minimum emission
saving threshold. If methane is not captured in the production process, it leads to a strong decrease of
production possibilities to roughly ¼ for the 35% emission saving threshold (to 14.1 million ha) and to
roughly 1/3 for the 60% emission saving threshold (to 10.4 million ha). Therefore, the implementation
of methane capture into all production processes could increase the sustainable production area
available under the emission saving criterion for the European market.

The increase in yield to 20t/ha, however, does only have an effect on available area under the 35%
emission saving threshold. It slightly increases the available area to 20.9 million ha. Under the higher
emission saving thresholds the higher yields do not reduce sustainable production areas compared to a
yield of 17t/ha because both examples result in negative emission savings for areas with high biomass
cover. Thus, increasing yields and implementing methane capture into the production process
increases the sustainable production area in regions with a medium biomass cover but will not change
the fact that an expansion into forest or forest like areas will never be sustainable in terms of carbon
emissions.

Table 3: Area achieving the minimum emission saving threshold in Kalimantan (61.5 million
ha total island area)
                                                    Area achieving the minimum emission
                                                               saving threshold
      Palm oil
                      Areas excluded from analysis Neutral
production process
                                                   Emission   35%         50%       60%
                                                   Balance
No methane capture      peatland soils / swamp areas
                                                          19.3        14.1        12.4         10.4
 and 17t/ha yield               (Figure 16)
Methane capture and     peatland soils / swamp areas
                                                          26.8        20.9        17.9         15.8
   20t/ha yield                 (Figure 17)
                        peatland soils / swamp areas
                                                          25.3        19.4        17.9         15.8
                                (Figure 15)

                      No-go areas by land cover
Methane capture and definition (forest and peatland       12.4        10.9        10.3         9.7
   17t/ha yield           areas)  (Figure 19)

                         No-go areas by land cover
                       definition (forest and peatland
                                                           8.8        7.3         6.7          6.4
                          areas) and without areas
                          already used (Figure 19)
Figure 16 Figure 17
Figure 18

As a last step I want to raise the question of the overall implications of my results on possible land use
change effects Indonesia. This is, first of all, a question on how much area for expansion still does
exist which is not yet used for agricultural production but still achieves the minimum emission saving
threshold. Thus, this is area where an expansion would cause DLUC emissions but still produce
sufficient emission savings to be eligible under the EU-RED criteria. Thus, one needs to subtract the
area already used for agricultural production from the sustainable production areas.

This is the basis for the analysis of ILUC implications of the EU-biofuel mandate from palm oil
demand. Because, if palm oil for the EU biofuel mandate is produced on already existing plantation
areas or on areas used for other agriculture production before, and the demand for palm oil from other
sectors remains stable or increases, palm oil plantations will expand into natural areas due to
increasing prices. This expansion of palm plantations producing palm oil for other markets than the
EU-biofuel market is possible because no binding sustainable criteria exist for these markets.16 These
ILUC mechanisms can only be avoided if there are expansion areas in Indonesia which are both in line
with the EU-RED sustainability criteria and not yet used for agricultural production.

16
  The same mechanism is in place if another vegetable oil than palm oil is used for European biofuel production
and the “missing” oil in the food market (indicated by increasing prices for vegetable oils) is replaced with palm
oil from Indonesia.
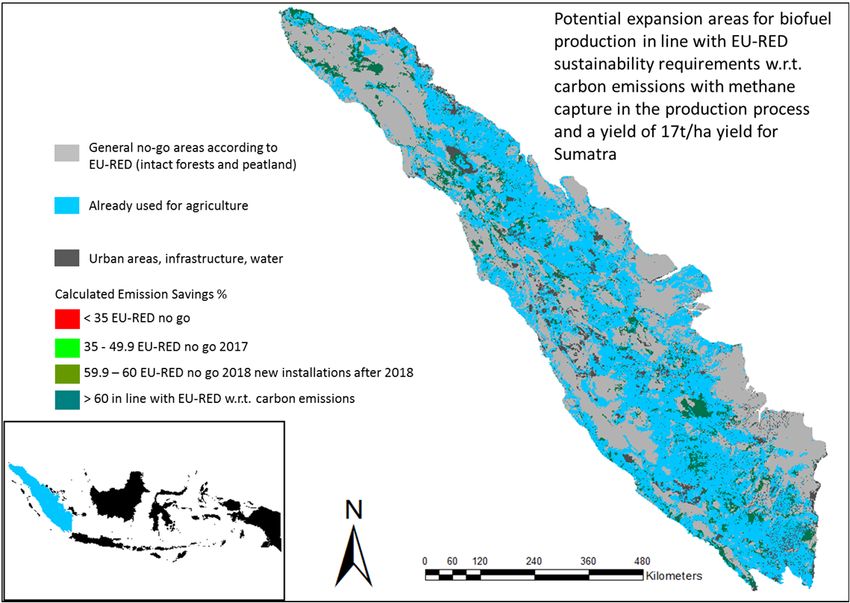
With respect to carbon I can determine these areas. Thus, in addition to Figure 13-18 where I already
excluded wetland areas as well as peatswamp areas, I know exclude all forest areas (over 30% canopy
cover) as they are no-go areas by definition in the EU-RED (light grey). This calculation step only
changes the results for Kalimantan, as the Sarvision approach allows different carbon values within
one land cover class (see Table 2 and 3). For Sumatra, the carbon value for forest is the same for all
forest areas, which is clearly beyond the 35% emission saving threshold such that this area is already
excluded in the emission saving maps for Sumatra (Figure 13.-15.). In addition, I mark the areas which
are already used for agricultural production in light blue and indicate the emissions saving threshold as
in the previous set of maps. The results of this exercise are shown in Figure 19 for Sumatra and Figure
20 for Kalimantan.

Figure 19

It becomes evident that there are not many areas left for expansion into unused areas. For Sumatra the
subtraction of the areas already used for agricultural production has the highest impact as in 2008 large
areas of the island are already deforested and used for production. Expansion areas under the emission
saving criterion decrease to only 3.4 million ha (see Table 2).
Figure 20

For Kalimantan this calculation step is less substantial as less area is already used for agricultural
production. However, the general exclusion of forested areas excludes pixels which are in forest areas
but have low biomass due to degradation or small openings. However, as these pixels can be at very
remote areas and normally do not represent a large contiguous area which would be needed for the
installation of a palm plantation, they are likely to be not suitable expansion areas, even when only
applying the emission saving threshold. Thus, for Kalimantan, after this calculation step, expansion
areas under a production process with methane capture and a yield of 17t/ha reduce to 7.3 million ha
(see Table 3). This further reduces to 6.4 million ha when the 60% emission saving threshold is
implemented. This is only ~ 10% of the island area.

    5. Discussion of results

For the evaluation of results one has to keep in mind that these maps do not include biodiversity
factors and areas needed for other infrastructure, settlements etc. They further do not account for the
suitability or productivity of the land for production which will further decrease suitable areas. Thus,
even though this conclusion is tempting, the10% will not be the whole available expansion area for
palm oil production in Kalimantan, keeping in mind that in addition, all production would need to
achieve a yield of 17t/ha and apply methane capture for this number to hold. Moreover, this area is
only freely available if all other production remains constant.
If demand for palm oil and other agricultural products from Indonesia increases as well, and if production other than for the European fuel market remain under no sustainability regulation, the impact of the carbon maps will be limited. Palm oil for the European fuel market would be produced on certifiable areas and other production will freely expand into forest areas. Thus, the small amount of available area for a sustainable expansion increases the risk of ILUC. Therefore to evaluate the impact of the EU-RED and carbon maps on decreasing carbon emissions in Indonesia, the overall national development needs to be considered. The OECD expects an increase in global consumption of vegetable oils of 30% till 2021 compared to 2009 (OECD Agricultural Outlook). In this context Indonesia wants to reach a production of 40m tonnes palm oil a year by 2020. In 2012 Indonesia produced roughly half of the global production of 50m tonnes. Thus, Indonesia’s production is important to supply the world with cheap palm oil on the one hand. On the other hand, the sector accounts for 11% of total export earnings, second only to oil and gas and generates $5.7bn in export taxes for the government (McClanahan 2013). Therefore, the development of the sector has also national importance. Even though the government wants to achieve the goals in a sustainable manner, environmentalists doubt that it can be achieved without further forest destruction (McClanahan 2013). My results supports this in the context of EU-RED biofuel policies. Thus, Indonesia can be considered a key example of the challenge many developing countries face regarding the balance between protection of their natural resources and developing of their agricultural sector. A sustainable expansion path without ILUC or leakage effects can only be achieved if all productions are subject to sustainability criteria. The implementation of a sustainable land use planning based on carbon maps that define areas for expansion and protection binding for all agricultural production is one strategy to achieve such sustainable expansion path. However the implementation of such maps into the official spatial planning processes is challenging when it hinders and sets limits to national development plans. This is especially true, when international increases in demand continue to set incentives for expansion of production as prospected by the OECD. However, an important aspect to consider is the fact that not all area already used in the country is used in an efficient manner but can be degraded or with low productivity. Koh and Ghazoul (2010) show that a sustainable expansion of palm plantations without further substantial forest loss is possible with a suitable land use planning and development strategy that particularly accounts for a restoration of degraded areas. Thus, given the appropriate set of incentives, according to Koh and Ghazoul (2010) oil palm producers could completely abandon expansion in areas of high biomass and have plenty of growth opportunities in low biomass zones. Thus in order to achieve an expansion of production without leakage effects on natural areas, a sustainable land use management that includes the reactivation of degraded areas should be implemented. Consequently, if the EU wants to reduce the ILUC risk of its biofuel mandate, it should support the implementation of such policy. The feasibility of such policy in a country where weak institutions and corruption as part of the deforestation problem
are not content of this analysis but represent a further hurdle to take for a sustainable production of
biofuel feedstock in Indonesia (Lange and Bertelmann 2013).

It is therefore evident that the EU-RED sustainability requirements for biofuels alone will not
substantially change the land use change development in Indonesia. However, my results show that the
European Commission is right in being concerned about ILUC even if producers fulfil the
sustainability requirements for DLUC. This is because ILUC in Indonesia can only be overcome if
deforestation in general is reduced. In order to decrease the ILUC impact of the EU biofuel mandate in
Indonesia, the EC should support the country to recover degraded areas for palm oil production and to
enforce forest protection via a sustainable land use planning. My carbon maps can serve as a basis for
such sustainable land use planning.

    1. Conclusion

I show how to calculate a carbon map according to the sustainability requirements of the EU-RED for
biofuel production with the example of Kalimantan and Sumatra in Indonesia. Based on the carbon
map I derive maps showing the emission savings for biodiesel based on palm assuming different
production processes and productivity. It was important to fill this gab as Indonesia is the largest
producer of palm oil, the most important vegetable oil in the world. My maps can be used for a low
carbon development policy of the agricultural sector in Indonesia.

My maps can further serve as a basis for investors which want to produce biofuels for the European
market. However, the results clearly indicate that, even though the implementation of methane capture
in the production process and an increase in yield might have a small impact on possible expansion
areas, there seem to be not too much area left for a sustainable expansion of the palm oil sector for the
European market. This increases the risk of ILUC. It further points out the importance of a sustainable
land use planning and sustainability regulation for all production in Indonesia.

The impact of a regulation such as EU-RED is ineffective if all other production does not underlie any
sustainability regulation. Thus, the problem of ILUC regulation is only a problem of an incomplete
emission accounting of land use practices when only biofuel production is subject to such accounting,
but food, feed and bioenergy production other than biofuel production are not. To avoid indirect
effects, the carbon map can be the basis for a sustainable land use planning with a strategy to
reactivate degraded areas that is binding for all agricultural production in the country.
You can also read