GREENING CONSTRUCTION - The Role of Carbon Pricing - Squarespace
←
→
Page content transcription
If your browser does not render page correctly, please read the page content below
GREENING
CONSTRUCTION
  The Role of Carbon Pricing

About IFC
IFC—a sister organization of the World Bank and member of the World Bank
Group—is the largest global development institution focused on the private sector
in emerging markets. We work with more than 2,000 businesses worldwide,
using our capital, expertise, and influence to create markets and opportunities
in the toughest areas of the world. In fiscal year 2018, we delivered more than
$23 billion in long-term financing for developing countries, leveraging the power
of the private sector to end extreme poverty and boost shared prosperity. For
more information, visit www.ifc.org

About CPLC
A unique initiative, the Carbon Pricing Leadership Coalition (CPLC) brings together
leaders from national and sub-national governments, the private sector, academia,
and civil society with the goal of putting in place effective carbon pricing policies
that maintain competitiveness, create jobs, encourage innovation, and deliver
meaningful emissions reductions. The Coalition drives action through knowledge
sharing, targeted technical analysis and public-private dialogues that guide
successful carbon pricing policy adoption and accelerate implementation. The
Coalition encourages private sector climate leadership through sector-specific
task teams, including for the construction industry and the banking sector.

The Coalition was officially launched at COP21 in Paris in December 2015. As
of 2018, CPLC comprises 32 national and sub-national government partners,
150 private sector partners from a range of regions and sectors, and 67 strategic
partners representing NGOs, business organizations, and universities. More
information: https://www.carbonpricingleadership.org/
GREENING
CONSTRUCTION
The Role of Carbon Pricing
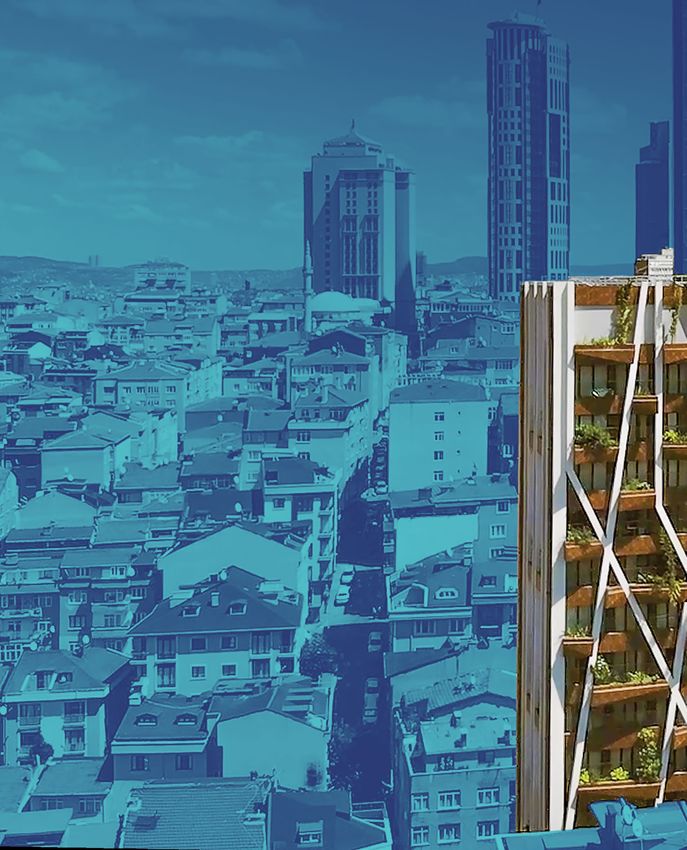
© International Finance Corporation 2019. All rights reserved.
2121 Pennsylvania Avenue N.W.
Washington, D.C. 20433
Internet: www.ifc.org

IFC, a member of the World Bank Group, creates opportunity for people to escape poverty and improve their
lives. We foster sustainable economic growth in developing countries by supporting private sector devel-
opment, mobilizing private capital, and providing advisory and risk mitigation services to businesses and
governments. This report was commissioned by the Carbon Pricing Leadership Coalition (CPLC) through IFC’s
Climate Business Department. The CPLC Secretariat is administered by the World Bank Group.

The conclusions and judgments contained in this report should not be attributed to, and do not necessarily
represent the views of, IFC or its Board of Directors or the World Bank or its Executive Directors, or the coun-
tries they represent. IFC and the World Bank do not guarantee the accuracy of the data in this publication and
accept no responsibility for any consequences of their use.

The material in this work is copyrighted. Copying and/or transmitting portions or all of this work without
permission may be a violation of applicable law. IFC encourages dissemination of its work and will normally
grant permission to reproduce portions of the work promptly, and when the reproduction is intended for
educational and non-commercial purposes, without a fee, subject to such attributions and notices as we may
reasonably require.

Cover photo: Greenox Residence, located in Istanbul, Turkey, and developed by Aycan-Feres Joint Venture, has received
final EDGE certification from thinkstep-SGS.
Contents
    Acknowledgements.  .  .  .  .  .  .  .  .  .  .  .  .  .  .  .  .  .  .  .  .  .  .  .  .  .  .  .  .  .  .  .  .  .  .  .  .  .  .  .  .  .  .  .  .  .  .  .  .  .  .  .  .  .  .  .  .  .  .  .  .  .  .  .  .  .  .  .  .  .  . v

    Acronyms .  .  .  .  .  .  .  .  .  .  .  .  .  .  .  .  .  .  .  .  .  .  .  .  .  .  .  .  .  .  .  .  .  .  .  .  .  .  .  .  .  .  .  .  .  .  .  .  .  .  .  .  .  .  .  .  .  .  .  .  .  .  .  .  .  .  .  .  .  .  .  .  .  .  .  .  .  .  .  . vii

    Foreword. .  .  .  .  .  .  .  .  .  .  .  .  .  .  .  .  .  .  .  .  .  .  .  .  .  .  .  .  .  .  .  .  .  .  .  .  .  .  .  .  .  .  .  .  .  .  .  .  .  .  .  .  .  .  .  .  .  .  .  .  .  .  .  .  .  .  .  .  .  .  .  .  .  .  .  .  .  .  .                viii

    Executive
    Summary.  .  .  .  .  .  .  .  .  .  .  .  .  .  .  .  .  .  .  .  .  .  .  .  .  .  .  .  .  .  .  .  .  .  .  .  .  .  .  .  .  .  .  .  .  .  .  .  .  .  .  .  .  .  .  .  .  .  .  .  .  .  .  .  .  .  .  .  .  .  .  .  .  .  .  .  .  .  .  .  .  .               1

    Introduction                         .  .  .  .  .  .  .  .  .  .  .  .  .  .  .  .  .  .  .  .  .  .  .  .  .  .  .  .  .  .  .  .  .  .  .  .  .  .  .  .  .  .  .  .  .  .  .  .  .  .  .  .  .  .  .  .  .  .  .  .  .  .  .  .  .  .  .  .  .  .  .  .  .  .  .  .  . 4

    Carbon Pricing in the Construction Value Chain .  .  .  .  .  .  .  .  .  .  .  .  .  .  .  .  .  .  .  .  .  .  .  .  .  .  .  .  .  .  .  .  .  .  .  .  .  .  .  .  .  .                                                                                             8
               The construction industry setting. .  .  .  .  .  .  .  .  .  .  .  .  .  .  .  .  .  .  .  .  .  .  .  .  .  .  .  .  .  .  .  .  .  .  .  .  .  .  .  .  .  .  .  .  .  .  . 8
               Carbon pricing mechanisms .  .  .  .  .  .  .  .  .  .  .  .  .  .  .  .  .  .  .  .  .  .  .  .  .  .  .  .  .  .  .  .  .  .  .  .  .  .  .  .  .  .  .  .  .  .  .  .  .  . 12
               CPM influence heatmap .  .  .  .  .  .  .  .  .  .  .  .  .  .  .  .  .  .  .  .  .  .  .  .  .  .  .  .  .  .  .  .  .  .  .  .  .  .  .  .  .  .  .  .  .  .  .  .  .  .  .  .  .  . 15

    Case Studies . .  .  .  .  .  .  .  .  .  .  .  .  .  .  .  .  .  .  .  .  .  .  .  .  .  .  .  .  .  .  .  .  .  .  .  .  .  .  .  .  .  .  .  .  .  .  .  .  .  .  .  .  .  .  .  .  .  .  .  .  .  .  .  .  .  .  .  .  .  .  .  .  .  .  .  . 16
               Methodology.  .  .  .  .  .  .  .  .  .  .  .  .  .  .  .  .  .  .  .  .  .  .  .  .  .  .  .  .  .  .  .  .  .  .  .  .  .  .  .  .  .  .  .  .  .  .  .  .  .  .  .  .  .  .  .  .  .  .  .  .  .  .  .  .  .  .  .  .  .  .  .  . 17
               Carbon price . .  .  .  .  .  .  .  .  .  .  .  .  .  .  .  .  .  .  .  .  .  .  .  .  .  .  .  .  .  .  .  .  .  .  .  .  .  .  .  .  .  .  .  .  .  .  .  .  .  .  .  .  .  .  .  .  .  .  .  .  .  .  .  .  .  .  .  .  .  .  .  . 17
               Case study profiles .  .  .  .  .  .  .  .  .  .  .  .  .  .  .  .  .  .  .  .  .  .  .  .  .  .  .  .  .  .  .  .  .  .  .  .  .  .  .  .  .  .  .  .  .  .  .  .  .  .  .  .  .  .  .  .  .  .  .  .  .  .  .  .  .  . 17

    Applying Existing Mechanisms to the Construction Value Chain .  .  .  .  .  .  .  .  .  .  .  .  .  .  .  .  .  .  .  .  .  .  .  .  .                                                                                                                              22
               Internal carbon price .  .  .  .  .  .  .  .  .  .  .  .  .  .  .  .  .  .  .  .  .  .  .  .  .  .  .  .  .  .  .  .  .  .  .  .  .  .  .  .  .  .  .  .  .  .  .  .  .  .  .  .  .  .  .  .  .  .  .  .  .  .  .  . 22
               Emission reduction credit scheme.  .  .  .  .  .  .  .  .  .  .  .  .  .  .  .  .  .  .  .  .  .  .  .  .  .  .  .  .  .  .  .  .  .  .  .  .  .  .  .  .  .  .  .  .  .  .  .  .  .  . 29
               Emissions trading systems .  .  .  .  .  .  .  .  .  .  .  .  .  .  .  .  .  .  .  .  .  .  .  .  .  .  .  .  .  .  .  .  .  .  .  .  .  .  .  .  .  .  .  .  .  .  .  .  .  .  .  .  .  .  .  .  .  .  . 31
               Hybrid scheme.  .  .  .  .  .  .  .  .  .  .  .  .  .  .  .  .  .  .  .  .  .  .  .  .  .  .  .  .  .  .  .  .  .  .  .  .  .  .  .  .  .  .  .  .  .  .  .  .  .  .  .  .  .  .  .  .  .  .  .  .  .  .  .  .  .  .  .  .  . 35
               Carbon tax .  .  .  .  .  .  .  .  .  .  .  .  .  .  .  .  .  .  .  .  .  .  .  .  .  .  .  .  .  .  .  .  .  .  .  .  .  .  .  .  .  .  .  .  .  .  .  .  .  .  .  .  .  .  .  .  .  .  .  .  .  .  .  .  .  .  .  .  .  .  .  .  .  . 38
               Command and control mechanism. .  .  .  .  .  .  .  .  .  .  .  .  .  .  .  .  .  .  .  .  .  .  .  .  .  .  .  .  .  .  .  .  .  .  .  .  .  .  .  .  .  .  .  .  .  .  .  .  .  . 42
               Discussion .  .  .  .  .  .  .  .  .  .  .  .  .  .  .  .  .  .  .  .  .  .  .  .  .  .  .  .  .  .  .  .  .  .  .  .  .  .  .  .  .  .  .  .  .  .  .  .  .  .  .  .  .  .  .  .  .  .  .  .  .  .  .  .  .  .  .  .  .  .  .  .  .  . 45

    Developing an Integrated Carbon Pricing Mechanism for the Construction Value Chain . . 51
               Overview .  .  .  .  .  .  .  .  .  .  .  .  .  .  .  .  .  .  .  .  .  .  .  .  .  .  .  .  .  .  .  .  .  .  .  .  .  .  .  .  .  .  .  .  .  .  .  .  .  .  .  .  .  .  .  .  .  .  .  .  .  .  .  .  .  .  . 51
               Governance.  .  .  .  .  .  .  .  .  .  .  .  .  .  .  .  .  .  .  .  .  .  .  .  .  .  .  .  .  .  .  .  .  .  .  .  .  .  .  .  .  .  .  .  .  .  .  .  .  .  .  .  .  .  .  .  .  .  .  .  .  .  .  .  .  .  .  .  .  .  .  .  . 54

                                                                                                                                                                                                                                                                                  iii
Operation . . . . . . . . . . . . . . . . . . . . . . . . . . . . . . . . . . . . . . . . . . . . . . . . . . . . . . . . . . . . . . . . . . . . . . . . . . . 54
           Revenue .  .  .  .  .  .  .  .  .  .  .  .  .  .  .  .  .  .  .  .  .  .  .  .  .  .  .  .  .  .  .  .  .  .  .  .  .  .  .  .  .  .  .  .  .  .  .  .  .  .  .  .  .  .  .  .  .  .  .  .  .  .  .  .  .  .  .  .  .  .  .  .  .  .  .  . 55
           Reporting .  .  .  .  .  .  .  .  .  .  .  .  .  .  .  .  .  .  .  .  .  .  .  .  .  .  .  .  .  .  .  .  .  .  .  .  .  .  .  .  .  .  .  .  .  .  .  .  .  .  .  .  .  .  .  .  .  .  .  .  .  .  .  .  .  .  .  .  .  .  .  .  .  .  . 56
           Reporting operational emissions. .  .  .  .  .  .  .  .  .  .  .  .  .  .  .  .  .  .  .  .  .  .  .  .  .  .  .  .  .  .  .  .  .  .  .  .  .  .  .  .  .  .  .  .  .  .  .  .  .  .  .  . 56
           Relationship with wider carbon pricing markets .  .  .  .  .  .  .  .  .  .  .  .  .  .  .  .  .  .  .  .  .  .  .  .  .  .  .  .  .  .  .  .  .  .  .  .  . 57

Moving Forward.  .  .  .  .  .  .  .  .  .  .  .  .  .  .  .  .  .  .  .  .  .  .  .  .  .  .  .  .  .  .  .  .  .  .  .  .  .  .  .  .  .  .  .  .  .  .  .  .  .  .  .  .  .  .  .  .  .  .  .  .  .  .  .  .  .  .  .  .  .  .  .  .                59
           Adapting existing CPMs for the CVC. .  .  .  .  .  .  .  .  .  .  .  .  .  .  .  .  .  .  .  .  .  .  .  .  .  .  .  .  .  .  .  .  .  .  .  .  .  .  .  .  .  .  .  .  .  .  .  . 59
           Further research on carbon pricing in the CVC .  .  .  .  .  .  .  .  .  .  .  .  .  .  .  .  .  .  .  .  .  .  .  .  .  .  .  .  .  .  .  .  .  . 62

Appendix .  .  .  .  .  .  .  .  .  .  .  .  .  .  .  .  .  .  .  .  .  .  .  .  .  .  .  .  .  .  .  .  .  .  .  .  .  .  .  .  .  .  .  .  .  .  .  .  .  .  .  .  .  .  .  .  .  .  .  .  .  .  .  .  .  .  .  .  .  .  .  .  .  .  .  .  .  .  .   67
           Worked example of integrated concept. .  .  .  .  .  .  .  .  .  .  .  .  .  .  .  .  .  .  .  .  .  .  .  .  .  .  .  .  .  .  .  .  .  .  .  .  .  .  .  .  .  .  .  .  . 67
           Scope of Carbon Pricing Mechanisms in Buildings and Infrastructure. .  .  .  .  .  .  .  .  .  .  .  .  .  . 71
           Endnotes. .  .  .  .  .  .  .  .  .  .  .  .  .  .  .  .  .  .  .  .  .  .  .  .  .  .  .  .  .  .  .  .  .  .  .  .  .  .  .  .  .  .  .  .  .  .  .  .  .  .  .  .  .  .  .  .  .  .  .  .  .  .  .  .  .  .  .  .  .  .  .  .  .  .  . 73
Acknowledgements

            This report was commissioned by IFC’s Climate Business Department (Alzbeta Klein,
            Director), Climate Finance and Policy Group (Vikram Widge, Global Head), as part of the
            Secretariat of the Carbon Pricing Leadership Coalition (CPLC). The work was led by Aditi
            Maheshwari and Ayesha Malik. This effort was made possible with the support of Neeraj
            Prasad and Angela Naneu Churie Kallhauge (World Bank).

            The CPLC is grateful to the project team that undertook this analysis: Dr. Matthew Free,
            Dr. Kristian Steele, Dimple Rana, Harriet O’Brien, Esme Stallard, Jonny Whiting, Dr. Heleni
            Pantelidou, Filippo Gaddo, and Tim Chapman (Arup); Dr. Jannik Giesekam (University of
            Leeds); Hector Pollitt (Cambridge Econometrics); and Damien Canning (Costain).

            This analysis could not have been done without the essential support of CPLC partners,
            especially Cedric de Meeus and Elodie Woillez (LafargeHolcim); Rocio Fernandez (Acciona);
            and Dinara Gershinkova (Rusal). Other CPLC partner companies also involved in the
            Construction Value Chain task team have been key to shaping this project from the outset,
            including Cemex, Dalmia Cement, EllisDon, Groupe ADP, Mahindra & Mahindra, Siemens, and
            Tata Group. We are also grateful to Philippe Fonta (Cement Sustainabiliity Initiative), Nicoletta
            Piccolravazzi (Dow), Mark Crouch (Mott MacDonald), Miroslav Petkov (S&P Global), Nicolas
            Baglin (Saint-Gobain), and Thomas Sanders (thinkstep) for their inputs during the project
            workshop, and to Voight Uys (Kale Developments) for his assistance with the case studies.

            The report has benefited greatly from the inputs of the Sounding Board, which comprised
            a number of industry experts: Rehema Muniu (Green Building Council—Kenya); Samir
            Traboulsi (Green Building Council—Lebanon), Anila Hayat (Green Building Council—
            Pakistan); Francesca Mayer Martinelli (Green Buildings Council—Peru); Chris Bayliss
            (International Aluminium Institute); Araceli Fernandez Pales (IEA); Michel Folliet, Stefan
            Johannes Schweitzer, Prashant Kapoor, Rozita Kozar, Henri Rachid Sfeir, Ommid Saberi, Jigar
            Shah, and Alexander Sharabaroff (IFC); Luca De Giovanetti and Roland Hunzikar (WBCSD);
            and Terri Wills (World Green Building Council). Their collective expertise and inputs have
            greatly enhanced the comprehensiveness of this work.

ACKNOWLEDGEMENTS                                                                                                v
vi GREENING CONSTRUCTION

Acronyms

           AKH     Awash-Kombolcha/Hara Gebeya Railway
           BRICS   Brazil, Russia, India, China, and South Africa
           CPLC    Carbon Pricing Leadership Coalition
           CPM     Carbon pricing mechanism
           CVC     Construction value chain
           DBB     Design-Bid-Build
           DBFOM   Design-Build-Finance-Operate-Maintain
           ERC     Emissions reduction credit
           ETS     Emissions trading system
           EU      European Union
           ICE     Inventory of Carbon and Energy
           IEA     International Energy Agency
           IFC     International Finance Corporation
           LEED    Leadership in Energy and Environmental Design
           NDCs    Nationally Determined Contributions

ACRONYMS                                                            vii
Foreword

                                            By 2050, 70 percent of the global population is expected
                                            to reside and work in cities, where there is a concentra-
                                            tion of people, assets, financing, and opportunities. In
                                            parallel, 60 percent of the area expected to be urban
                                            by 2050 remains to be built, signifying the large scale
                                            of construction activity that the world will see in the
                                            decades leading up to then. Much of this growth will be
                                            in emerging markets.

                                           Since so much of the urban area expected to exist in the
                                           coming decades is yet to be built, there is an opportunity
                                           for cities to leapfrog historic urbanization approaches
                                           and divert scare resources to low-carbon, resilient,
                                           efficient construction, and avoid the pitfalls of locking
                                           in high-carbon infrastructure in their urban landscape.
       Carbon pricing has emerged as a key tool to help construction sector companies choose
       lower-emission alternatives, manage carbon risk, and reduce emissions.

       The private sector is already recognizing that there is a huge business opportunity associ-
       ated with green construction – almost $25 trillion in emerging market cities alone to 2030
       according to IFC estimates – and is approaching sustainable construction in a variety of ways.
       Companies across the construction value chain are using internal voluntary carbon pricing
       as well as signals from external carbon regulations, including taxes and emissions trading
       systems, to incentivize low-carbon decision-making in their own operations. Their broad
       range of interests in applying carbon pricing include using it as an incentive for individual
       business units to reduce their emissions, developing low-carbon construction material and
       other products, and engaging with their supply chains to encourage the use of low-carbon
       and sustainable alternatives, to name a few.

       While these individual initiatives are essential and commendable, the efforts of construction
       sector companies to reduce the industry’s carbon emissions can be made significantly more
       effective by working in a collaborative manner. This last finding is a key takeaway from this
       report – that companies along the construction sector need to work together and with other
       stakeholders, such as contracting authorities, suppliers, and consumers, to align approaches
       to carbon pricing and to sustainability more broadly.

viii                                                                                           GREENING CONSTRUCTION
By bringing together the various companies and other stakeholders along the construc-
tion value chain for this work, the Carbon Pricing Leadership Coalition is helping drive this
agenda. The goal is for all these different stakeholders and initiatives to come together and
work with governments to deploy well-designed carbon policies that will help reduce the
construction industry’s total emissions and meet climate targets. IFC stands ready to explore
the development of such an integrated approach, and work with its clients and partners, both
within the CPLC and outside, to design and implement it in the most effective manner. We are
also working with stakeholders such as industry associations and construction sector compa-
nies to ensure the inclusion of all perspectives in this effort.
The construction industry already accounts for between 25 and 40 percent of global carbon
emissions, and it is imperative that the footprint of this expected construction is managed if
we are to meet the goals of the Paris Agreement and restrict the rise in temperatures to less
than 1.5˚ Celsius. We must act to ensure that all this forthcoming construction is built in a
sustainable manner and recognize the role of the private sector in achieving this as well as
the business opportunity associated with green construction.
Alzbeta Klein
Director, Climate Business Department, IFC
FOREWORD ixx GREENING CONSTRUCTION
EXECUTIVE
 SUMMARY
 T
        his report examines how to design effective car-
        bon pricing mechanisms (CPMs) for the construc-
        tion industry. As the world’s largest consumer of
 raw materials, it accounts for a significant proportion of
 final energy demand and is responsible for 25 percent to
 40 percent of global carbon-related emissions.1

 Demographic trends underline the need for the con-
 struction industry to do more to address its contribution
 to climate change. The world’s population is predicted
 to reach nearly 10 billion by 2050, with the major-
 ity expected to live in urban areas.2 This will increase
 demand for buildings and infrastructure; some estimates
 suggest that 75 percent of the infrastructure we will need
 by 2050 must still be built.3

                                                              1
Putting a price on carbon can be an effective on different life-cycle stages, asset classes,
way for governments and organizations to construction delivery methods, and market
plan for a low-carbon future. Applying a cost contexts. The strengths and deficiencies of each
to emissions encourages sectors and supply CPM were analyzed, and ideas for refinement
chains to alter behavior in favor of lower- and improvement were explored.
carbon choices. However, to date, CPMs have
yet to achieve their potential when it comes to The study findings suggest that there is no
driving behavior change in construction. single fix. If carbon prices were increased to
“midpoint” levels of $25/tCO2e used for this
The construction value chain (CVC) is a com- analysis (with a lower limit of $10/tCO2e and
plex mix of life-cycle stages, delivery models, an upper limit of $53/tCO2e), then project costs
and stakeholders. Large projects with long could potentially change the behavior of both
life cycles and multiple actors can be highly polluters and downstream CVC actors, includ-
fragmented; accountability or incentives to ing clients, designers, and users. This indicates
consider climate change impacts are often lack- that simply raising carbon prices within
ing. These constraints make the application of existing CPMs may bring about the refocus
CPMs to construction particularly challenging. needed to change behaviors. Whether or not
this is possible in political and practical terms
This study explores how CPMs can be designed depends very much on the context.
better to more effectively account for emis-
sions from the CVC. To date, carbon pricing has Established CPMs fail to influence the CVC
tended to apply to carbon-intensive production actors commonly associated with early stage
activities. In the CVC, this commonly includes project-making, including funders, developers,
raw material extraction, product manufac- and designers. This represents a failure in the
ture, and energy generation. However, this is way the mechanisms are designed and func-
ineffective at influencing construction design, tion. In practice, many of these actors retain
where carbon emissions are locked in for the significant power and influence over a proj-
duration of an asset’s life. ect’s whole-life carbon emissions by defining
material supply chain, operational, and in-use
The study used scenario modeling of four carbon emissions. To reduce total emissions
case studies to examine the impacts of CPMs
2 GREENING CONSTRUCTIONover an asset’s life, an effective CPM needs to activities and regulated energy in use. By
influence the early stages of project-making. accounting for the whole-life carbon perfor-
mance at the point of project-making, the CPM
One way of capturing CVC emissions more concept creates an incentive to tackle carbon at
comprehensively is to include constructed the beginning of the asset’s life cycle by those
assets within CPMs. Depending on the charged with its design, thus cascading low-
approach, this might extend in scope to carbon objectives along the value chain.
include everything from the asset’s embodied
carbon emissions to those arising from opera- In the development of CPMs, governments and
tion and use, as well as emissions from end of companies must carefully weigh the potential
life. Because CPMs are already well established negative impacts against the benefits, provid-
around the world, expanding them to include ing solutions to help those who cannot easily
CVC assets may be viable and acceptable to the alter their behavior while challenging those
industry and consumers. who can through stricter targets and penal-
ties. Schemes must engage and align with their
Of the existing CPMs applied, hybrid models regional and international counterparts to cre-
are likely to provide the flexibility needed ate a more level playing field, share learning,
to maximize the capture of emissions while and minimize threats to competitiveness.
reducing the impact on welfare and competi-
tiveness. The value of this model lies in its As economies in emerging markets grow and
adaptability, accommodating variances in demand for infrastructure increases, significant
asset class, scale, project delivery method, and opportunities and benefits from implementing
market type. Hybrid models could also help to carbon prices arise. In these locations, carbon
minimize price volatility, which would appeal pricing may be used to incentivize and drive
to investors and governments. the market towards low-carbon infrastructure,
raise revenues that may be used to support low-
Where existing CPMs cannot be adjusted, this carbon initiatives, and help to fulfil local and
study proposes a new integrated CPM for the global climate commitments.
CVC. Devised to apply to projects, the proposed
CPM would use a threshold or blanket carbon
price and cover the supply chain construction
FOREWORD 3Introduction
I
n recent years the construction industry has made notable progress to reduce its
carbon emissions, developing and regulating energy efficiency requirements and
implementing low-carbon technologies in buildings and along the supply chain.
However,the industry remains highly energy and carbon intensive, producing 25 percent
to 40 percent of the world’s total carbon emissions,4 which is likely to be compounded by
the expected increase in demand for built assets.5
The industry recognizes that it needs to take are currently being used in 45 national and 25
further action if the world is to meet the Paris subnational jurisdictions around the world,
Agreement target of limiting global tem- double the number in place a decade ago.
perature rise this century to below 2oC above These account for 11 GtCO2e, or 20 percent of
pre-industrial levels.6 To this end, carbon pric- global greenhouse gases, representing a value
ing is emerging as an important tool to help the of $81 billion.7 The value of the fossil fuel
industry reduce its carbon emissions. industry is about $4.65 trillion, suggesting that
there is still significant potential to be seized.8
The scope, influence, and complexity of carbon
pricing mechanisms (CPMs) is growing. CPMs
TACKLING CARBON EMISSIONS IN THE BUILT ENVIRONMENT
●● By 2050, six of the seven largest economies ●● Emerging economies account for nearly
in the world could be emerging markets.9 60 percent of the global construction
●● Seventy-five percent of the infrastructure sector’s total CO2e emissions.13
that will be in place by 2050 must still be ●● CO2e emissions from buildings and
built.10 construction rose by nearly 1 percent per
●● The construction industry is the world’s year between 2010 and 2016, releasing
largest consumer of raw materials. It 76 GtCO2e in cumulative emissions.14
accounts for 50 percent of global steel ●● About 70–89 percent of construction
production and more than 300 billion tons of industry greenhouse-gas emissions
global resource extraction.11 originate from materials, 5–15 percent from
●● Buildings and construction account for transportation, and 6–9 percent from energy
36 percent of global final energy use and consumption during construction.15,16,17
39 percent of energy-related CO2e.12
4 GREENING CONSTRUCTIONCarbon pricing is recognized in Article 6 of the Paris Agreement. The Stern-Stiglitz High-Level
Paris Agreement. To date, 101 countries have Commission on Carbon Prices found that to keep
stated an interest in pursuing carbon pric- global temperatures below 2°C, carbon prices
ing initiatives in their Nationally Determined would need to be between $40 to €80/ tCO2e by
Contributions (NDCs).18 As nations, cities, and 2020 and $50 to €100/tCO2e by 2030.20
companies shift towards a lower-carbon future,
CPMs offer valuable opportunities to incentiv- Nonetheless, CPMs are increasingly being
ize low-carbon investment and establish clear adopted by governments and private sector
and competitive markets for carbon. organizations. Whether to incentivize low-
carbon innovation, stimulate cost-effective
Carbon pricing attributes a cost to the negative emissions mitigation, improve production
impacts associated with the release of green- processes and industrial structures, tackle
house gases. This sends an economic signal climate change, or fund broader social and
to the emitter to either avoid high-emission environmental strategies, the adoption of
activities or pay to continue polluting, creating carbon pricing is growing.21 To date, carbon
incentives to change behavior throughout the pricing has tended to apply to carbon-intensive
supply chain. But carbon pricing is complex production activities. In the construction
and its impacts are often less powerful than value chain (CVC), this includes raw material
anticipated when applied in real-world condi- extraction, product manufacture, and energy
tions. The European Union’s (EU’s) emissions generation. While this has been successful
trading system (ETS), for example, shows that up to a point, this approach is ineffective at
even the most sophisticated mechanism will influencing construction design, where carbon
not always achieve its objectives due to politi- emissions are locked in for the duration of an
cal and external economic factors, loopholes, asset’s life.
and gamification.19
To address this issue, some jurisdictions are
Although many carbon prices around the world experimenting with applying CPMs at the point
have increased year on year (see Figure 1), of carbon “consumption” (for example, Japan
their trajectories remain lower than the values is applying a CPM to retail electricity). In the
needed to meet the temperature goal of the CVC, this approach has the potential to more
INTRODUCTION 5successfully address emissions associated with Section 4 (Applying Existing Mechanisms to the
design choices and asset performance in use. Construction Value Chain) provides a detailed
assessment and discussion of how established
This study examines how existing CPMs can CPMs might be refined to better capture and
be adapted to more successfully lower whole- influence carbon emissions across the CVC.
life carbon emissions (all the emission sources
associated with constructing and using a build- Section 5 (Developing an Integrated Carbon
ing over its life). Where this is not practical, Pricing Mechanism for the Construction Value
the study proposes adopting an integrated CVC Chain) outlines the concept for an integrated
CPM that can be applied to both buildings and CVC CPM as an alternative model to consis-
infrastructure. tently influence carbon emissions across the
CVC for both the building and infrastructure
Section 2 (Carbon Pricing in the Construction construction industries.
Value Chain) of the paper examines the
construction industry setting, including CVC Finally, Section 6 (Moving Forward) discusses
formation, actors, and life-cycle stages. It also next steps and additional research needs.22
reviews six established CPMs.
Section 3 (Case Studies) sets out the case study
scenario and modeling work that has been
undertaken to explore the impact of CPMs.
6 GREENING CONSTRUCTIONFIGURE 1: GLOBAL CARBON PRICES IN 2017/18 RANGED FROM UNDER $10 TO OVER
$140/TCO2.24
US$ 140/
tCO2e 139 Sweden carbon tax
US$ 130/
tCO2e
US$ 120/
tCO2e
US$ 110/
tCO2e
Switzerland carbon tax,
US$ 100/ 101
Liechtenstein carbon tax
tCO2e US$/tCO2e
Spain carbon tax, Ireland carbon tax, 25
US$ 90/ Denmark carbon tax (F-gases)
tCO2e
Alberta CCIR,
23
Alberta carbon tax
US$ 80/
tCO2e Slovenia carbon tax,
77 Finland carbon tax Korea ETS 21
US$ 70/
tCO2e
64 Norway carbon tax (upper)
US$ 60/
tCO2e EU ETS 16
New Zealand ETS,
California CaT,
55 France carbon tax 15
Ontario CaT,
Québec CaT
US$ 50/
tCO2e
US$ 40/
tCO2e
36 Iceland carbon tax
9 Beijing pilot ETS
US$ 30/ Denmark carbon tax Portugal carbon tax,
29 (fossil fuels) Switzerland ETS 8
tCO2e
27 BC carbon tax 7 Shenzhen pilot ETS
Shanghai pilot ETS, Saitama ETS,
Tokyo CaT, Colombia carbon tax, 6
US$ 20/ Latvia carbon tax
tCO2e 5 Chile carbon tax
RGGI, Chongqing pilot ETS,
Norway carbon tax (lower) 4
Fujian pilot ETS,
US$ 10/ 3 Mexico carbon tax (upper),
tCO2e Estonia carbon tax, Hubei pilot ETS, Japan carbon tax
Guangdong pilot ETS 2
Mexico carbon tax (lower), 1 Tianjin pilot ETS
Poland carbon tax, Ukraine carbon taxCarbon Pricing in the
Construction Value Chain
accountable for or incentivized to consider how
The construction their activities affect other parts of the system
(for example, designers do not commonly
industry setting remain accountable for how much energy and
carbon a building may use in operation).
THE CVC Carbon pricing presents an inherent challenge
to the construction industry as many of the
The CVC is complex, consisting of interlinked products and services it offers are energy and
and interdependent processes and actors. carbon intensive and are therefore costlier
Large projects with long life cycles and multiple if emissions are priced. Despite this, many
actors often operate independently, meaning organizations have successfully implemented
that actors along the value chain are not always internal CPMs, and many more are subject to
KEY MESSAGES
●● Although the construction industry is taking ●● This study examines six CPMs identified
action to reduce carbon emissions, carbon through a comprehensive literature review:
pricing is a relatively unexplored tool. This is Internal carbon pricing, emissions reduction
largely due to the nature and structure of the credit schemes, ETS, hybrid schemes,
industry, which is complex, fragmented, and carbon taxes, and command and control
carbon intensive. Carbon pricing presents mechanisms. Their functioning, strengths,
an opportunity to make the industry more and weaknesses are assessed in this
sustainable. section.
●● This report uses a broad conception of ●● A CPM influence heatmap is used to
the CVC, addressing all carbon-emitting compare the influence on carbon reduction
activities at all life-cycle stages, from design each of these CPMs has in relation to the
through to construction, use, operation, and stages of the CVC and the actors involved at
end of life. those stages.
8 GREENING CONSTRUCTIONregulatory ETS and carbon taxes. Thus, with ignored by the decision-making or regulatory
some adjustment, there are more opportunities frameworks used to bring about emissions cuts,
to overcome barriers to applying CPMs along the outcomes will be less successful.
the CVC.
To address these constraints, this study uses a
broader definition of the CVC based on BS EN
THE STRUCTURE OF THE CVC 15804 on Sustainability of Construction Works,23
and adapted by PAS2080 Carbon Management
Although there is no standard industry defi- in Infrastructure.24 This broader definition is
nition of what is included within the CVC, presented in Figure 2, which shows the scope
traditional interpretations have tended to of actors responsible for carbon management
include raw material production and supply, in infrastructure and buildings, and Figure 3,
product manufacture, and construction works. which illustrates the life-cycle stages relevant to
When it comes to considering carbon emissions, carbon emissions sources.
this definition is inadequate as it does not cap-
ture all the value chain actors who have control
and influence over carbon emissions or all the ACTORS IN THE CVC
life-cycle stages where carbon emissions occur.
Many diverse actors operate in the CVC. The
This leads to two inherent challenges. First, if relationship between them is complex and
all relevant actors are not included and targeted changes from project to project. The following
in the industry drive to cut carbon emissions, actors are usually involved in a construction
it will be more difficult to ensure behavior project:
changes throughout the value chain. Second, if
●● Investors and shareholders fund the devel-
life-cycle stages that are responsible for signifi-
opment of an asset.
cant sources of carbon emissions (that is, the
use of a building or an infrastructure asset) are ●● Developers may fund, construct, or own
and manage an asset for profit.
CARBON PRICING IN THE CONSTRUCTION VALUE CHAIN 9FIGURE 2: CVC ACTORS RESPONSIBLE FOR CARBON MANAGEMENT (ADAPTED FROM
PAS2080).82
Government and Regulators National/Sector policy-level
Citizens carbon management
Asset Owners/Managers
Users
Shareholders
Designers
Asset and
program-level
carbon management
Constructors
Employees
Product/Material Suppliers
●● Designers develop the design of the asset position on the matrix indicates the level of
that is to be constructed or maintained. integration, and the extent to which the project
is directly financed by the owner or client.25
●● Constructors undertake work to build,
maintain, or disassemble a constructed
The delivery method applied is usually chosen
asset.
based on project size, budget, client prefer-
●● Product/material suppliers extract, manu- ence, and program. The way a project is
facture, or produce materials or products for delivered may influence how carbon may be
construction or maintenance of an asset. reduced over the life of the project or asset.
For example, the contractor in a traditional
●● Asset owners/managers manage and may
DBB segmented model has little influence
be responsible for providing, operating, and
over the design of a project and no incentive
maintaining assets.
to maximize carbon reduction. Conversely,
●● Users use a constructed asset and the in an integrated model such as design, build,
services it provides during operation. finance, operate, maintain (DBFOM), each
●● Demolition contractors/waste manage- party (designer, builder, investor, operator,
ment demolish, process materials arising, and manager) can be incentivized to maximize
and dispose of waste. carbon reduction at every stage to ensure the
overall project is delivered most efficiently.
PROJECT DELIVERY METHODS The financing of a project will also influ-
ence how and whether carbon emissions are
The CVC collaborates to deliver projects reduced. For example, an owner who directly
in various ways. There are different risks, finances a project may choose to prioritize
strengths, and weaknesses associated with carbon reduction and impose targets that con-
each approach. Figure 4 shows some of the tractors, operators, and managers must meet.
most common project delivery methods. Their In contrast, an owner who does not finance
10 GREENING CONSTRUCTIONFIGURE 3: IN THE CVC, ACTIVITIES ARE CARRIED OUT ACROSS FOUR MAIN LIFE-CYCLE
STAGES.83
PR O D U CT CO N STRUCTION USE END OF LIFE
• Design • Transport • Use • Deconstruction
• Raw material supply • Construction • Maintenance • Transport
• Transport • Installation • Repair • Waste processing
• Manufacturing • Refurbishment • Disposal
• Replacement
• Operational energy
• User utilization of
infrastructure
(or deliver) the project, may not have control for driving low-carbon behaviors. Similarly,
over how carbon emissions are reduced over projects where the owner has control over
the course of the project’s life cycle and/or any funding may increase the likelihood of carbon
incentive to prioritize it. reductions by prioritizing it from the start of
the project. Projects delivered via methods in
Given that in the CVC the operation and use the upper right quadrant (Figure 4) therefore
phases are responsible for a large portion of have the greater theoretical capacity for car-
emissions, integrated project delivery models bon reduction over the asset life cycle.26
that include operation have greater potential
CARBON PRICING IN THE CONSTRUCTION VALUE CHAIN 11FIGURE 4: COMMON CVC PROJECT DELIVERY METHODS. THESE CAN BE CHARACTERIZED
AS SEGMENTED TO INTEGRATED, AND DIRECT TO INDIRECT FINANCING.
PROJECT DELIVERY METHODS Direct Financing
DBB Design-Bid-Build (Traditional)
DBO BOOT
DB Design-Build DBB DB
DBOM BLT
DBO Design-Build-Operate
BOO
DBOT Design-Build-Operate-Transfer
Segmented Integrated
DBOM Design-Build-Operate-Maintain
DBFOM Design-Build-Finance-Operate-Maintain BOT DBOT DBFOM
BOO Build-Own-Operate
BOT Build-Operate-Transfer
BOOT Build-Own-Operate-Transfer
BLT Build-Lease-Transfer Indirect Financing
Carbon pricing mechanisms
Through a literature review and observation of ●● Life-cycle stage: Suitability of CPMs to be
ongoing pricing schemes, the study identified applied to the stages of the construction life
six types of CPM: cycle: product, construction, use, and end
of life.
●● Internal carbon pricing.
●● Asset class: Suitability of CPMs to be
●● Emissions reduction credit schemes.
applied to different asset classes, for
●● Emissions trading systems. example, buildings or infrastructure and
subsectors of these.
●● Hybrid schemes.
●● Project scale: Applicability based on project
●● Carbon taxes.
size.
●● Command and control.
●● Market: Applicability based on market
type, for example, low-, middle-, or high-
Table 1 compares the strengths and weak-
income economy.
nesses of the six CPMs. When compiling the
table and considering how these CPMs could ●● Project delivery method: Project contrac-
better integrate with the CVC, the following tual approach which works most effectively
perspectives were considered: with a CPM, such as DBB.
12 GREENING CONSTRUCTIONTABLE 1: THE STRENGTHS AND WEAKNESSES OF THE SIX CPMS.
Mechanism How it works Strengths and weaknesses
Internal carbon Voluntary mechanisms may be implemented Strengths
pricing by companies looking to manage risks from
• Allows organizations to target specific internal business units with high
future climate policy, identify inefficiencies,
emission levels.
and incentivize shifting from higher to lower
emission technologies.27 There are two main • Allows organizations to set targets to influence their supply chains,
approaches: creating cascading changes throughout the system.
• Shadow pricing, which simulates the effect • Drives innovation, which may lead a company to gain market share and
of an externally imposed tax on internal grow the market for lower-carbon products and services.29
projects by adding a cost to projects. • Acts as a risk management tool to understand how climate regulations
• Internal fees, which are imposed on specific will affect companies, helping them to prepare for an external future
business units based on their emission climate price.30
levels. Fees are centrally collected and • Familiarizes organizations with carbon pricing, helping them to prepare
reinvested, ideally in projects facilitating for a more rigorous and enforceable scheme.
energy efficiency or carbon offsets. 28
Weaknesses
• Voluntariness may limit impact and narrow targeting may limit the effect
across the whole business.
• Lack of external regulation may result in low price setting (by an
organization), limiting the overall impact of the policy.
• May pose a risk to the competitiveness of an organization by raising
costs that are passed on down the supply chain.
• May be difficult to get financial executive buy-in.
• May miss scope 3 (and sometimes even scope 2) emissions.
Emissions Under an ERC scheme31 firms earn credits (or Strengths
reduction credit offsets) by reducing greenhouse gases below • Credits can generate revenues, which may be reinvested in green
(ERC) scheme a predetermined level (for example, historical initiatives.
emissions level or emission intensity). Credits
can then be traded with parties who need to • Encourages efficiencies within high-carbon sectors.
comply with emissions targets regulations • Facilitates reporting of emissions reductions.
or who wish to offset emissions to become
carbon neutral. In this way, ERC schemes can • Provides a framework and rewards for offsetting, and encourages
be integrated with ETS. Unlike ETS, there is parties to consider other low-carbon initiatives.
no fixed limit on emissions, as credits are Weaknesses
generated for each additional project.
• Involves an administrative burden for verifying and vetting projects to
ensure additionality.32
• Potential for unintended incentives to keep business-as-usual emissions
high to keep the baseline high and maximize the number of credits (and
revenue) earned.33
• Requires independent benchmarking.
• Lack of fixed emissions limit may dampen actual emissions reductions.
Emissions ETS, or cap and trade systems, are market- Strengths
trading system oriented schemes that allow parties to • Theoretically creates an efficient market where emissions are reduced
buy and sell permits to emit greenhouse in the most cost-effective way.
gases. ETS are quantity-based instruments
in which an emissions upper limit is set (for • Potential to generate revenues for governments (if emissions
example, x tons/year), and an associated auctioned), which can be used to reduce negative impacts, for example,
number of tradable emission allowances (x increased costs for certain sectors or impacts on competitiveness.
permits to emit 1 ton) are either allocated or • Attractive to business since there is potential for allocated allowances
auctioned to polluters. Parties that do not and related benefits (such as trading or banking allowances).
use up all their permits can sell their surplus
via international trading exchanges, thereby • Potential for global-scale implementation and consequent reduction in
creating an incentive to reduce emissions. the risk of carbon leakage (when businesses shift their production to
countries with less stringent carbon regulations).
• Certainty of emissions limit via a cap, subject to credible penalties and
enforcement for non-compliance.34
CARBON PRICING IN THE CONSTRUCTION VALUE CHAIN 13Mechanism How it works Strengths and weaknesses
Emissions Weaknesses
trading system • Potential for carbon leakage, which may limit overall emissions
(continued) reduction.
• Potential for price volatility, which may affect business confidence.
• Low price setting may limit impacts on emissions reduction.
• Over-allocation of allowances and grandfathering may cause price
crashes and rent-seeking behavior.35
• Creation and oversight of market may be complex and costly.
Hybrid scheme Hybrid schemes combine elements of Strengths
quantity-based ETS instruments and price-
• Price volatility risks associated with market-based ETS are reduced by
based tax instruments.36 For example, a
price floors and ceilings, which typically stabilize prices.37
hybrid option may involve having a cap and
trade with a price floor and ceiling. Or the • Attractive to governments due to potential to raise revenue, assuming
ETS may have an allowance reserve set, quotas are auctioned.
whereby when a permit price exceeds a • Creates flexibility to suit a variety of markets, for example, a price
certain ceiling, companies may buy a limited threshold may be used in lower-income economies to limit welfare
number of permits set aside (the reserve) for impacts.
this purpose, at the ceiling price.
Weaknesses
• May be complicated and onerous to regulate, and may require more
intervention in the permit market.
• May be complex and costly to implement as a new emissions trading
unit must be created and allocated.
Carbon tax Taxation is a price-based instrument that sets Strengths
a fixed price for carbon emissions.38 Taxes • Simple to implement administratively, compared to market instruments.
can be implemented at different points along
the supply chain; for instance, taxes can be • Provides a clear price signal to the market.
levied on fossil fuel suppliers or final emitters. • Potential to capture the majority of emissions with just a few points of
regulation.
• Attractive to governments, as revenue generation may help compensate
for negative impacts (such as raised prices and competitiveness).
Weaknesses
• Inaccurate price setting may limit effectiveness; significant analysis may
be required to achieve the right price.39
• Potential for carbon leakage.
• May be politically unpopular and therefore difficult to implement, unless
tax can be proven to be revenue neutral.40
Command and Although not a CPM, command and control Strengths
control regulations are compulsory policies that • Top-down implementation is simpler to enact and manage as no market
stipulate actions and penalties for non- or associated regulation needs to be formed.
compliance.41 Such policies are generally
applied across the board. Examples include • Compulsoriness provides more certainty about a given target or
emission limits, performance standards, and outcome.
prohibiting the use of certain materials. Weaknesses
• May be costly as regulations do not recognize that some businesses will
face higher abatement costs and tend to have higher implementation
costs than others.
• Does not create an incentive to go beyond a certain level of reductions
signaled by the target.
14 GREENING CONSTRUCTIONCPM influence heatmap
An influence heatmap was developed to indi- comparative influence (high to low) that the
cate the scope and impact of CPMs across CVC CPM applies to value chain actors to reduce
actors and life-cycle stages. It was separately carbon emissions.
applied to each of the CPMs and is presented
throughout the section on applying existing Figure 5 only indicates potential. In practice,
CPMs to the CVC. applying a CPM to a project and CVC context will
show variation. The section on applying exist-
Figure 5 applies the heatmap concept to all ing CPMs to the CVC discusses where it is best to
six CPMs. The image is based on common target a CPM to maximize emissions reductions.
CPM application examples and shows the
FIGURE 5: THE HEATMAP VISUALIZES WHERE CPMS ARE IMPLEMENTED IN THE CVC
AND THE IMPACT ON THE ACTOR BEHAVIORS THEY CAN HAVE (THE COLORED CIRCLES
INDICATE WHICH ACTORS ARE INFLUENCED OVER THE PROJECT LIFE CYCLE).
Stage at which CPM
is commonly applied
1. Internal carbon pricing
2. Emissions reduction
credit (ERC) scheme*
3. Emissions trading
systems (ETS)
4. Hybrid scheme
5. Carbon tax
6. Command and control
A0 Design
A1-A3: Raw
Material, Transport,
Manufacture
A4 Transport
A5 Constr. – Install.
B1 Use
B2 Maintenance
B3 Repair
B4 Replacement
B5 refurbish
B6 Operational
energy, water
B7 User utilization
of infrastructure
C1 Deconstruction
C2-C5 Transport
Waste processing
Disposal
Design Product Construction Use End of life
(A0) (A1-3) (A4-5) (B1-7) (C1-4)
*An ERC scheme often requires the sustainability of the whole project to be evaluated, which is why a CPM is not
placed on one particular stage.
CARBON PRICING IN THE CONSTRUCTION VALUE CHAIN 15Case Studies
T
o understand the potential for maximizing carbon reduction across the CVC, a
scenario modeling exercise was undertaken. The modeling exercise demonstrates
how applying CPMs at different stages in the CVC (product, construction, use)
could influence the behavior of actors operating at those stages. The results indicate
where a CPM should be targeted to maximize carbon reductions over the life of a project,
which in turn helps identify the most suitable CPM, bearing in mind industry consider-
ations and constraints (see above). For example, how CPMs may be modified or applied
differently in high-, middle-, and lower-income economies, how actors in different life-
cycle stages may be incentivized to reduce carbon, and how CPMs should be imple-
mented in relation to other existing carbon reduction schemes and policies.
KEY MESSAGES
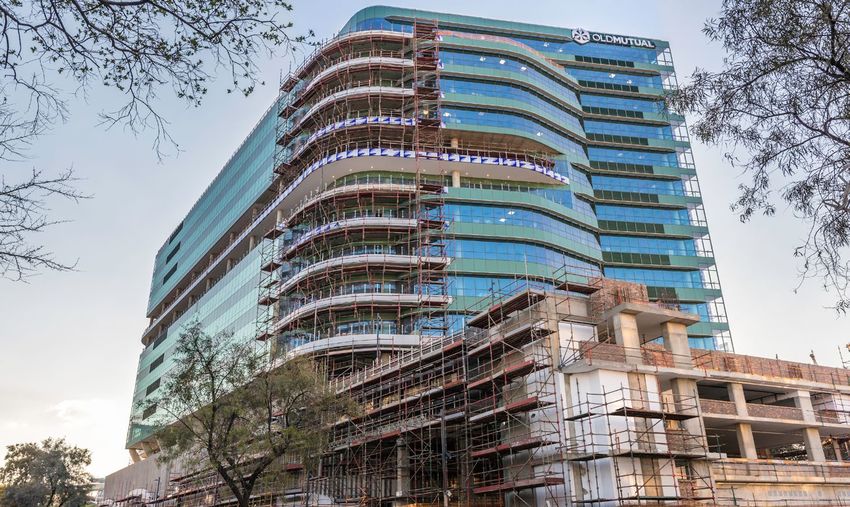
●● Case studies of a road, a residential ●● Guidance. The case studies applied a
development, a commercial building, and a standardized approach to determining
railway were modeled to understand how greenhouse-gas emissions. However,
the application of CPMs at different stages this approach is not standardized in all
in the CVC could influence the behavior of markets and segments. There is also little
actors operating at those stages to reduce guidance on how carbon pricing might be
carbon emissions. The results of the analysis applied to CVC projects. Guidance on such
are examined in Chapter 4. aspects would help practitioners seeking to
●● Identifying the case study materials for this determine project-based carbon costs.
report proved challenging. No case study ●● Capacity. Case study development relied
was immediately available that had applied on engaging with project funders, architects,
carbon pricing to construction projects, engineers, quantity surveyors, costing
perhaps reflecting the topic’s newness within specialists, and suppliers, among many
the industry. This provides useful context to others. In most cases, much coaching
several important lessons learned: was needed on carbon pricing and its
●● Data quality. Project and life-cycle datasets application to the CVC. Skills and knowledge
were difficult to access. Data quality was on carbon pricing remain limited among
poor and incomplete and different projects project stakeholders and will prove most
recorded data inconsistently. To facilitate challenging for smaller projects and
robust carbon pricing across the CVC, such operators who are less likely to have the
variations and data gaps must be resolved. relevant training capacity.
16 GREENING CONSTRUCTIONsets out the generalized structure of these
Methodology stages: product manufacture, construction, use/
operation, and end of life. These terms can,
Four existing projects were chosen and however, shift in interpretation in practice.
selected data from their project life cycles was This is particularly the case when it comes to
modeled: the activities associated with the operation and
use of buildings and infrastructure. To help
●● N340 dual carriageway in Spain
understand these terms, the Appendix includes
●● The Village residential development in a table that sets out what might be identified as
South Africa operational and user carbon emissions in dif-
ferent buildings and infrastructure contexts.
●● One Mabledon Place, commercial building
retrofit in the UK
●● Awash-Weldiya/Hara Gebeya railway line
in Ethiopia.
Carbon price
A carbon price was applied to each ton of CO2e
The projects differ in terms of asset class, project emitted at each stage of the project life cycle.
scale, and market. The analysis used project- Low, medium, and high carbon price scenarios
specific information such as bill of quantities were created and applied to demonstrate how
(detailed a statement of work setting out prices the application of CPMs at different stages in
and quantities of materials required for the the CVC could influence the behavior of actors
project) and complete life-cycle assessments to operating at those stages. The prices reflect the
create datasets on which the scenario modeling range of carbon prices currently implemented
was based. Where information was lacking or through CPMs globally. The low and medium
formats differed, assumptions were made and carbon pricing regimes are intended to reflect
secondary research was carried out. In addi- the range at which most current carbon prices
tion to consulting with Arup experts, external sit, while the high pricing regime represents
sources included the ICE carbon database, UK the carbon price required in 2020 to stay con-
Environment Agency Carbon Calculation sheets, sistent with achieving the temperature goal set
and the HM Treasury Green Book. out in the Paris Agreement.42
●● Low: $10/tCO2e—based on the average EU
The research and assumptions reflect indus-
ETS allowance price over the last year.
try best practice and use expert guidance.
However, it is important to note that with such ●● Medium: $25/tCO2e—based on the IEA new
variety of project types across the construc- policies scenario (2025) for the EU.
tion industry, the case studies cannot capture
●● High: $53/tCO2e—based on the IEA
all life-cycle emission profiles and should
Sustainable Development scenario (2025)
therefore be considered indicative rather than
average of BRICS and advanced economies.
representative of the industry.
LIFE-CYCLE EMISSIONS
Case study profiles
The following profiles provide an overview of
The case studies examine the suitability of
each case study and the analysis carried out
CPMs at different stages of the construction
on them.
life cycle. The section on the CVC's structure
CASE STUDIES 17N340 FOUR-LANE HIGHWAY, SPAIN
The N340 road is a four-lane highway in during its entire useful life. The mode con-
Alicante, Spain. It was developed by Acciona sidered a 1-kilometer stretch; the life cycle
Infrastructure and obtained Environmental considered is to 2050. The project followed a
Product Declaration, which certifies the DBB delivery method.
environmental footprint of the infrastructure
Project characteristics
●● Stages considered in the analysis: ●● Electricity costs ($/kWh): EC – Quarterly
Report on European Electricity Markets,
• Product (manufacturing of raw materials)
Spanish industrial retail electricity price—
• Construction central consumption band assumed.
• Operation (energy consumption of the ●● Discount factor for analysis of net present
lighting along the road) value: 3.5 percent, from HM Treasury – The
Green Book. Industry standard approach
• Maintenance (repair the top layer)
used in discounting future costs to present
• Use (vehicular traffic using road). costs.
●● Data: The road owner, Acciona, provided a ●● Carbon dioxide emissions during usage
range of data, including key material quanti- stage: Based on Arup analysis from previ-
ties from a bill of quantities and life-cycle ous experience working with carriageways
assessment inventory, and the cost per unit in the UK. This provides a proxy for road
of these key materials. Additional research usage, based on similar road characteris-
was carried out to inform the inputs and tics— standardized for 1 kilometer.
assumptions required for the analysis.
●● Carbon emission factor: From Acciona’s
GABi modeling tool.
FIGURE 6: PHOTOGRAPH OF THE N340, SPAIN.
18 GREENING CONSTRUCTIONTHE VILLAGE RESIDENTIAL DEVELOPMENT, SOUTH AFRICA
The Village is a low-rise residential develop- two-bedroom units. This study models data
ment in Tshwane, South Africa, developed by from 66 units. The life cycle considered in the
Kale Developments. The total construction model is to 2050. The project followed a Build-
area is 16,000 m2, comprising 288 one- and Operate-Transfer delivery method.
Project characteristics
●● Stages considered in the analysis: ●● South African grid emission factor:
From UNFCCC and the Institute for Global
• Manufacturing of raw materials
Environmental Strategies, annual release
(provided in bill of quantities)
figures.
• Operation and use (annual energy
●● Gas and electricity costs for use consump-
consumption, both electricity and gas, of
tion ($/kWh): Retail energy costs from South
a user in a typical one-bedroom block).
Africa’s Department of Energy.
●● Data: The developer provided a bill of quan-
●● Discount factor for analysis of net present
tities listing the materials and associated
value: 3.5 percent, from HM Treasury—The
costs across the project. Additional research
Green Book. Industry standard approach used
was carried out to inform the inputs and
in discounting future costs to present costs.
assumptions required for the analysis
(including density figures for raw materials, ●● Carbon dioxide emissions during usage
carbon factors, and average South African stage: From Green Building Council sched-
household consumption levels). ules and DTS Energy Modelling Protocol
Guide. Used to build load profiles based on
●● Carbon emission factors: Taken from ICE
average income.
V2 Emission Factors, University of Bath,
based on kilogram of CO2e per kilogram of
material, converted using EACC database.
FIGURE 7: PHOTOGRAPH OF THE VILLAGE RESIDENTIAL DEVELOPMENT, SOUTH AFRICA.
The Village (Clubview) is a property owned by IFC’s client, International Housing Solutions (IHS). It has received final EDGE certification
from
the Green Building Council of South Africa.
CASE STUDIES 19AWASH-WELDIYA/HARA GEBEYA RAILWAY LINE, ETHIOPIA
The AKH railway project is building a railway with building and operating the railway.
line between the Ethiopian towns of Awash Additional research was carried out to
and Weldiya. The line will be 394 km long and inform the inputs and assumptions required
will carry both passenger and freight traffic for the analysis.
when complete in around a year’s time. The
●● Carbon emission factors: Taken from US
life cycle considered in the model is to 2050.
Environmental Protection Agency—Emission
The project is using an Engineer-Procure-
Factors, used in previous Arup studies of
Construct delivery method.
scope 1 and 2 emissions.
Project characteristics ●● Ethiopian grid emission factor: Taken
from Ecometrica—Electricity-specific emis-
●● Stages considered in the analysis:
sion factors for grid electricity, used in previ-
• Construction (heavy machinery such as ous Arup studies of scope 1 and 2 emissions.
excavators, backhoe loaders, trucks, and
●● Electricity costs ($/kWh): Taken from US
bowsers, and electricity required for
Commercial Service—Ethiopia: Power Sector
powering accommodation, offices, and
Market Factsheet.
portacabins).
●● Discount factor for analysis of net present
• Operation and use (electricity needed for
value: 10 percent, from Asian Development
powering passenger and freight trains
Bank, World Bank Studies. This is an indus-
and diesel for freight transfer).
try standard approach used in discounting
• The product (raw materials) stage was future costs to present costs, relevant to a
not considered in this case study due to a middle-income economy.
lack of robust data.
●● Power requirements during usage stage:
●● Data: The analysis drew on previous Used in previous Arup studies of scope 1 and
Arup estimates of emissions associated 2 emissions.
FIGURE 8: RENDERING OF THE AWASH-WELDIYA RAILWAY, ETHIOPIA.
20 GREENING CONSTRUCTIONYou can also read