Revised National forestry accounting plan for Sweden
←
→
Page content transcription
If your browser does not render page correctly, please read the page content below
Revised
National forestry
accounting plan for
Sweden
Revised 30 December 2019

                           Ministry for the Environment
Table of Contents ....................................................................................................... 1
1. General introduction ............................................................................................... 3
1.1 Sweden’s national climate policy framework ........................................................ 5
1.2 The forest resource in the national climate strategy ............................................. 6
1.3 Definitions of terms used in this report ................................................................. 9
1.4 Guidance by the EU Commission ....................................................................... 10
1.5 General description of the forest reference level for Sweden ............................. 10
1.6 Consideration to the criteria as set out in Annex IV of the LULUCF Regulation 12
2. Preconditions for the forest reference level .......................................................... 25
2.1 Carbon pools and greenhouse gases included in the forest reference level ...... 25
2.2 Demonstration of consistency between the carbon pools included in the forest
reference level .......................................................................................................... 25
2.3 General description of forests and forest management in Sweden .................... 26
2.3.1 Forest management practices 2000-2009 ....................................................... 27
2.4 General description of national policies and legislation with effect on forestry in
Sweden ..................................................................................................................... 27
2.4.1 The Swedish Forestry Act and the Environmental Code ................................. 28
2.5 Description of future harvesting rates under different policy scenarios .............. 30
3. Description of the modelling approach ................................................................. 31
3.1 Description of the general approach as applied for estimating the forest
reference level .......................................................................................................... 31
3.2 Detailed description of the modelling framework as applied in the estimation of
the forest reference level .......................................................................................... 33
3.2.1   Carbon pools and other emissions .................................................................. 33
3.2.2   Heureka RegVis .............................................................................................. 34
3.2.3   The Q-model .................................................................................................... 36
3.2.4   Organic soils .................................................................................................... 38
3.2.5   Harvested wood products ................................................................................ 39
3.2.6   Other emissions ............................................................................................... 39
3.3 Documentation of data sources as applied for estimating the FRL .................... 40
3.4 Documentation of stratification of the managed forest land ............................... 41
3.4.1 Areas ............................................................................................................... 41
3.4.2 Initial conditions 2010 ...................................................................................... 43
3.5 Documentation of sustainable forest management practices as applied in the
estimation of the forest reference level ..................................................................... 45
4. Forest reference level ........................................................................................... 49
4.1 Forest reference level and detailed description of the development of the carbon
pools ......................................................................................................................... 49
4.2 Consistency between the forest reference level and the latest national inventory
report ........................................................................................................................ 52
4.3 Calculated carbon pools and greenhouse gases for the forest reference level . 53
References ............................................................................................................... 54

                                                                                Ministry for the Environment              2 (57)
1. General introduction
Sweden appreciates the comments and questions that the European
Commission has communicated in its technical recommendations of July
2019 as well as the conclusions of the technical assessment of the expert
group (LULUCFEG). This report seeks to add the information requested by
the Commission and respond to the questions posed. Revisions in
comparison with the original Swedish National Forest Accounting Plan
made due to the technical recommendation are described in a separate
technical appendix titled Explanatory Note to the revised National Forest
Accounting Report for Sweden.

Sweden believes that active, sustainable forestry can play an important role
and contribute to mitigation of climate change through replacing fossil fuels
and fossil intensive materials and through increasing the long-term storage
of carbon in forest land, while relevant national environmental quality
objectives must be met. Sufficient availability of sustainable biomass from
the Swedish forest alongside continued profitability and willingness to invest
in the entire forest value chain will be ensured through sustainable forest
management and forest growth and within the framework of the Swedish
environmental quality objectives. Therefore, Sweden will not take any
measures to reduce harvesting levels even if Sweden, due to sharply
increased fellings, would risk reporting emissions from managed forest land.

Instead, possible reported emissions will be offset by the uptake of carbon
dioxide that can be expected to occur in other land categories. If fellings
increase to a level where further measures are required, emissions will be
fully compensated for by other flexibilities in the regulation. Measures for
increased growth can also increase the maximum harvesting levels. Sweden
would like to underline that an ever increasing standing volym in the
production forest land is not reconcilable with long term sustainable forest
policy since mortality from natural disturbances will increase and lead to
comprehensive biomass losses.

It should also be pointed out that although the proposed revised reference
level, following recommendations by the EU Commission, take into account
the forest management intensity during the reference period, Sweden
maintains its position. Sweden is of the opinion that the reference level
should be based on sustainable forest management practices as documented
during 2000-2009, excluding explicit requirements to take into account
historical intensity, as this provides for a sustainable increase in the
production of bio energy and low carbon materials based on forest biomass,

                                                Ministry for the Environment   3 (57)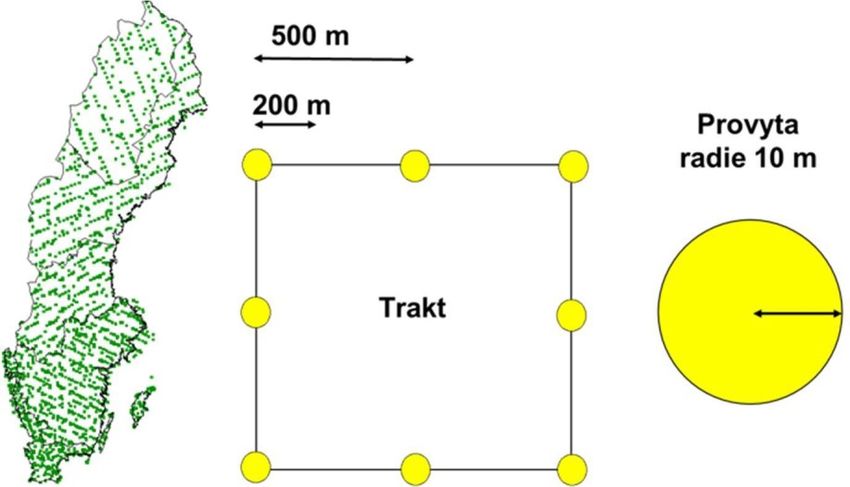
and that the LULUCF-regulation provides for that. Consultations with the
parliament regarding the revised NFAP took place on 17 December 2019.

Forests cover more than 42% of the EU’s land surface and represent a
significant mitigation potential. EU regulation (EU) 2018/841 on the
inclusion of greenhouse gas emissions and removals from land use, land use
change and forestry in the 2030 climate and energy framework adopted in
May 2018 for the first time integrates the greenhouse gas emissions and
removals from forestry and other land use sectors into EU climate policy.
Under the LULUCF Regulation, EU Member States must ensure that
greenhouse gas emissions from land use, land use change and forestry are
offset by at least an equivalent removal of CO₂ from the atmosphere in the
period 2021 to 2030. The regulation implements the agreement of the
European Council in October 2014 that all sectors should contribute to the
EU's 2030 emission reduction target, including the land use sector. The
regulation is also in line with the Paris Agreement, which points out the
important role of the land use sector in reaching our long-term climate
mitigation objectives.

In the long term climate strategy (COM(2018)733) the European
Commission points out that sustainable biomass has an important role to
play in a net zero greenhouse gas emissions economy. The Commission
stresses that the long-term mitigation benefits are greater when the forest is
actively managed and forest products substitute resources with higher
carbon footprint. A net zero emissions economy will require increasing
amounts of biomass compared to today’s consumption and more biomass
need to be mobilized as declared by the Commission. Sweden fully supports
this view. The Effort Sharing Regulation (ESR) on binding annual emission
reductions by EU Member States adopted in 2018 sets the national emission
reduction target for 2030 compared to 2005 for the ESR sector. The
Swedish contribution is 40 percent.

Total greenhouse gas emissions in Sweden excluding LULUCF, expressed in
CO2 equivalent, were about 52.7 million tonnes (Mton) in 2017. This can be
compared to the 71.5 Mton emitted in 1990, resulting in a decrease of total
emissions by about 26% compared to 1990. Total greenhouse gas emissions
including LULUCF in 2017 were about 10 Mton.

                                                Ministry for the Environment   4 (57)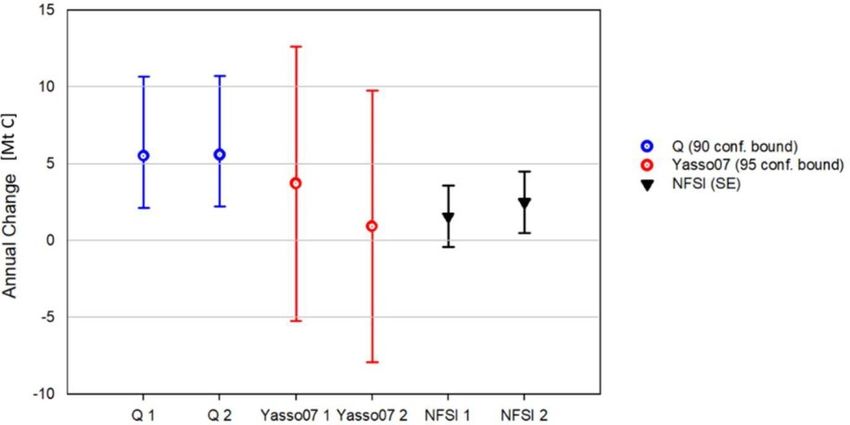
1.1 Sweden’s national climate policy framework
In June 2017, the Swedish parliament adopted a climate policy framework
containing a climate act which lays down principles and timetables for the
Government’s actions, new ambitious climate goals and an independent
climate policy council tasked to review the Government’s policies. The
framework aims to create order and stability in climate policy. It will provide
business and society with the long-term conditions to implement the
transition needed to address the challenge of climate change. The reform is a
key component of Sweden’s efforts to comply with the Paris Agreement.

The framework contains several new climate goals for Sweden:

1. By 2045, Sweden is to have net zero emissions of greenhouse gases into
the atmosphere and should thereafter achieve negative emissions. Negative
emissions will mean that Sweden overall helps to reduce the amount of
greenhouse gases in the atmosphere. That is, the amount of greenhouse
gases emitted by Sweden in ETS (Emissions Trading System) and ESR is
less than the amount of greenhouse gases reduced through enhanced net
removals in the LULUCF sector, through bio-CCS techniques, and through
climate projects pursued by Sweden abroad. In addition, fossil emissions
from activities within Sweden must be at least 85 per cent lower by 2045
than in 1990.

2. By 2030, emissions from domestic transport, excluding domestic aviation,
will be reduced by at least 70 per cent compared with 2010.

3. By 2030, emissions in Sweden in sectors covered by the EU ESR should
be at least 63 per cent lower than in 1990.

4. By 2040, emissions in Sweden in sectors covered by the EU ESR should
be at least 75 per cent lower than in 1990.

The goal of net zero emissions of greenhouse gases by 2045 and the goals
for 2030 and 2040 may, to a limited extent, be achieved through
supplementary measures, such as increased net removals of greenhouse gases
by the LULUCF-sector, bio-CCS or verified emission reductions from
investments in climate projects abroad. Such measures may be used to
achieve a maximum of 8 and 2 percentage points, respectively, of the
emission reduction goals by 2030 and 2040. That is, by 2030, emissions from
activities in Sweden within the ESR sector should be at least 55 per cent
lower than in 1990, and by 2040 at least 73 per cent lower than in 1990.

                                                 Ministry for the Environment   5 (57)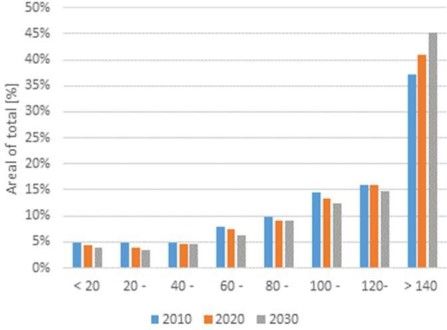
These goals reflect Sweden’s climate leadership, and show that Sweden
undertakes to achieve emission reductions that far exceed Sweden’s required
emission reductions under the EU ESR.

1.2 The forest resource in the national climate strategy
The Swedish forest policy has two equal objectives: the environmental
objective and the production objective, see section 2.4.

Biobased fuels and materials that substitute fossil resources are important
for transition to a low carbon society. More than 100 years of forestry has
resulted in a managed forest landscape characterized by forest with varying
age and stand development making it possible to combine active forest
management with high environmental standards whilst maintaining a
substantial carbon sink.

Sweden places great importance on the continued development of a bio-
economy, since an active and sustainable forest management will achieve the
highest long-term climate benefit. Sufficient and secure access to sustainable
biomass from the Swedish forest and continued profitability and willingness
to invest along the forest value chains shall be ensured through sustainable
forest growth within the framework of the national environmental quality
targets. Sweden has adopted a national forest program with the overarching
vision that forests, the “green gold”, shall contribute to employment and
sustainable growth in all parts of the country and to a growing bioeconomy.

In Sweden, active forest management contributes to an increased forest
stock and increased harvest yield over time compared to the last centuries
when the landscape was more intensively used for agriculture. The forest
stock has more than doubled during the last 90 years. The forest resource is
based on native species where pine, spruce and birch are the tree dominating
species. See figure 1. Only a marginal share of the forest consists of foreign
species.

                                                Ministry for the Environment   6 (57)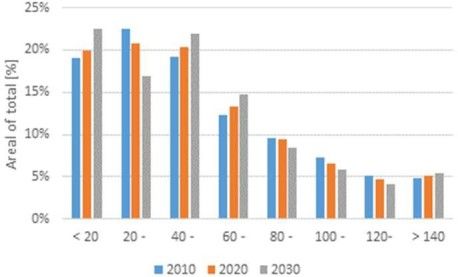
Figure 1 also highlights that the the overall harvest rarely exceeds total
growth. It may happen due to external factors such as the oil crisis in the
beginning of the 1970’s or due to large storms as in 2005.

                             3500                                                                     140

                             3000                                                                     120

                                                                                                            Growth and fellings [Mm3sk]
                             2500                                                                     100
   Standing volume [Mm3sk]

                             2000                                                                     80

                             1500                                                                     60

                             1000                                                                     40

                             500                                                                      20

                               0                                                                      0
                                    1920
                                    1924
                                    1928
                                    1932
                                    1936
                                    1940
                                    1944
                                    1948
                                    1952
                                    1956
                                    1960
                                    1964
                                    1968
                                    1972
                                    1976
                                    1980
                                    1984
                                    1988
                                    1992
                                    1996
                                    2000
                                    2004
                                    2008
                                    2012
                                    Pine   Spruce   Birch   Other decidous        Growth         Fellings

Figure 1. Forest stock development for all forest land per tree species on left y-axis,
development of growth and fellings on the right y-axis. Official statistics from the Swedish Forest
Agency and the Swedish National Forest Inventory.

Due to resource efficiency, residues from harvest operations and forest
industry processes have increased the wood based bioenergy share of the
energy mix considerably over the past decades. The use of bioenergy has
more than doubled since 1990, see figure 2. Wood based bioenergy
constitutes the major part of the bioenergy supply in Sweden.

                                                                  Ministry for the Environment   7 (57)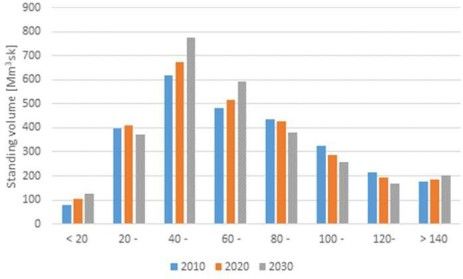
Use of biomass, per sector, from 1983, TWh
          160

          140
                                                                                      Electricity
          120                                                                         production

          100                                                                         District heating
  [TWh]

           80                                                                         Transport

           60
                                                                                      Residential
           40                                                                         and services

           20                                                                         Industry

           0

Figure 2. Use of biomass per sector in Sweden1.

In parallel, until today 1.1 million hectares productive forest have been
designated for nature protection in formally protected areas. 1.2 million
hectares are voluntarily set-aside forests, i.e. forest owners have set-aside
forests for nature conservation due to certification schemes.

In many other parts of the world, harvest operations have developed over
the last decades to create better conditions for biodiversity and various
ecosystem services. Trees and tree groups are left at harvest and dead wood
is saved and created. In Sweden such actions are to be taken at every logging
occasion, according to the law and such measures are also a key part of
certification standards. It is site specific to the elements that need extra
consideration, for example tree retention for buffer zones to watersheds or
sensitive biotopes. But even sites that are less sensitive, tree retention applies
to establish structures of old trees and dead wood in the next stand rotation.
Thus, the not harvested areas at the harvest sites varies from site to site, but
as a national average, the tree retention at harvest sites amounted to about 8
percent of the harvest site area during the reference period, according to an
inquiry made by the Swedish Forest agency. These areas of tree retention
(TR) will in total correspond to about 1.7 million hectares of production
forest land nationally, under a future rotation period.2 Retention forestry

1 Swedish Energy Agency (2018) Energy in Sweden 2018.

2 Claesson S., Duvemo K., Lundström A. and Wikberg P.-E. 2015.

                                                                 Ministry for the Environment     8 (57)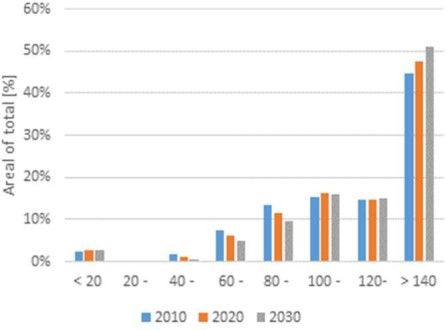
complements other types of conservation measures, i.e. voluntarily set-asides
and nature reserves.

In June 2019, the official Swedish statistics regarding area of tree retention
were reformed3. Only areas of tree retention on production land which has
already been harvested starting from 1993 is included in the reformed
statistics. According to the reformed approach, the area of tree retention
amounts to 0,4 million hectares of production forest land and will gradually
increase over the coming rotation period. However, for the simulation
carried out for this report, the former statistical approach as described above
was applied.

According to the reformed statistical approach, approximately 27% of the
forest land is protected from harvesting through formally protected areas,
voluntarily set-asides, legal protection of low-productive forests and tree
retention areas.

1.3 Definitions of terms used in this report
Productive forest is forest area with a yearly increment > 1 m3/ha/yr.

Production land is productive forest area primarily used for timber
production including tree retention sites.

Tree retention (TR) is a part of Production land where trees are retained
for biodiversity and other considerations at harvest sites.

Productive forest land managed for wood supply is Production land
excluding tree retention sites.

Reserves are areas of productive forest publicly protected areas for nature
conservation.

Voluntary set-asides are productive forest areas protected for nature
conservation on a voluntary basis, often under a forest certification scheme.

Low-productive forest is forest area with a yearly increment < 1 m3/ha/yr.
Includes low-productive forest in reserves.

3
 Skogsstyrelsen 2019. Statistik om formellt skyddad skogsmark, frivilliga avsättningar,
hänsynsytor samt improduktiv skogsmark. Rapport 2019:18.

                                                                  Ministry for the Environment   9 (57)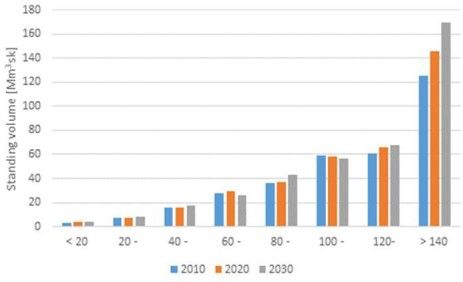
1.4 Guidance by the EU Commission
The Commission presented a guidance for developing and reporting the
forest reference levels on 24 July 2018. The stratified approach of the
guidance is, however, not applicable for the modelling methods that Sweden
utilizes. Therefore, this report has been prepared on the basis of the
LULUCF-regulation and follows the structure of Annex IV of the
regulation, rather that the exact approach of the guidance.

1.5 General description of the forest reference level for Sweden
The Forest Reference Level forest (FRL) for Sweden for the period 2021-
2025 has been estimated to -38 721 kt CO2-equivalents including HWP. The
FRL includes carbon stock changes in carbon pools and other emissions of
greenhouse gases on managed forest land (table 1).

Table 1. Average annual carbon stock changes, other emissions and the resulting FRL for
managed forest land in Sweden 2021-2025.

 [kt CO2-equivalents]                                                                         2021-2025
 Living biomass        Managed forest land, total                                               -30 236
                         Production land (incl. TR) (ca 21300 kha)                               -15 127
                         Productive forests set-aside for nature conservation (ca 2100 kha)       -7 307
                         Low-productive forest land (ca 4000 kha)                                 -3 816
                         Trees with DBH
The proposed forest reference level (FRL) for managed forest land is the
expected average annual net removals in 2021-2025, based on simulations of
the carbon stocks on managed forest land starting from 2010 assuming the
continuation of forest management practices as observed 2000-2009. Both
addition of areas to and subtraction of areas from forest land related to
afforestation (after 20 years from afforestation year) and deforestation have
been considered in the simulation. Climate change effects according to
RCP4.5 are also reflected in the simulations with a positive effect on forest
growth.
The development of carbon stocks has been simulated using the
documented forest management practice 2000-2009, including measures in
forestry and for biodiversity. It was assumed that harvest only takes place in
the forest production land. The general Swedish forest policy including all
long-term forest assessments by the Swedish Forest Agency assumes annual
harvesting volumes equal to the growth in the production land reduced by
the growth in the areas of tree retention integrated in the forest production
land. This is regarded as the growth available for harvest. However, the
annual growth applied for the calulation of the revised Swedish reference
level was adjusted in accordance with the ratio between actual roundwood
harvest during the reference period 2000-2009 and the growth available for
harvest during the same period.. No harvest was assumed in productive
forest land formally protected or voluntarily set-aside for nature
conservation, or in tree retention areas at harvest sites, nor in low-productive
forest land. Given these assumptions, the relative harvest level on managed
forest land during the commitment period 2021-2025 is estimated to 77
percent (annual harvest/annual increment on managed forest land excluding
pre-commercial thinning), see table 12.
In the calculations, data from the same sample plots from the Swedish
National Forest Inventory (NFI) and the Swedish Forest Soil Inventory
(SFSI) as used in the reporting of the LULUCF-sector to the EU and the
UN Framework Convention for Climate Change (UNFCCC) have been
used.
The FRL comprises all forest carbon pools currently reported to the EU and
the UNFCCC (Living biomass above ground, Living biomass below ground,
Dead wood, Litter, Soil organic carbon and HWP) as well as other emissions
associated to managed forest land included in these reports (fertilization,
emissions from drained organic soils, biomass burning).
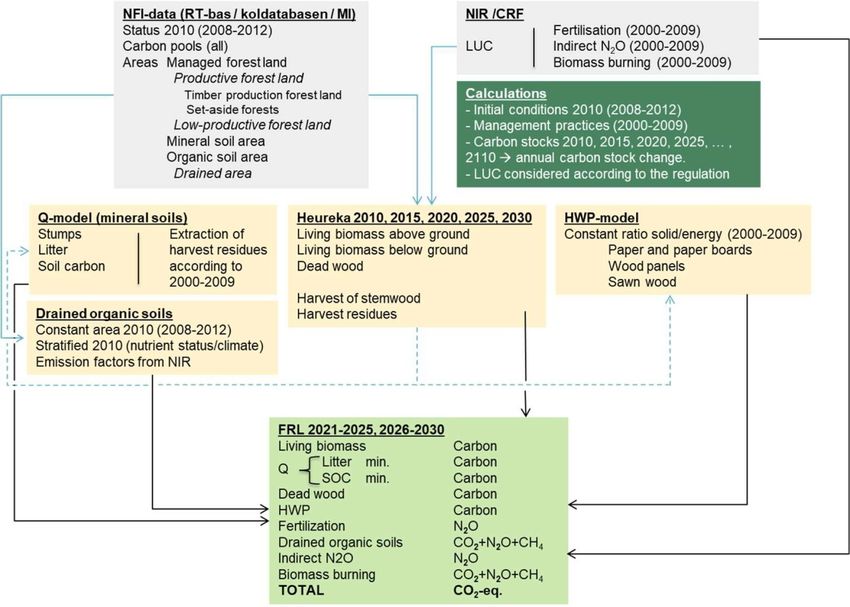
Ministry for the Environment 11 (57)Development of forest carbon stocks have been simulated using well
established models. Biomass is simulated on NFI-plot level using the
Heureka RegVis tool and the litter and soil organic carbon pool on mineral
soils is simulated using the Q-model. Other emissions are based on average
emissions 2000-2009 and the state of forests and areas 2010.
Historical data is presented in the annual greenhouse gas inventory reported
to the EU and the UNFCCC4 whereas the FRL is described (with relevant
references) in this submission and in the final report of a Government
commission5.
1.6 Consideration to the criteria as set out in Annex IV of the LULUCF
Regulation
In the following, we describe how the criteria to determine the forest
reference level (FRL) according to Annex IV, section A and B (where
appropriate), have been met in the establishment of a FRL for Sweden.
Annex IV, section A
(a) the reference level shall be consistent with the goal of achieving a balance between
anthropogenic emissions by sources and removals by sinks of greenhouse gases in the second
half of this century, including enhancing the potential removals by ageing forest stocks that
may otherwise show progressively declining sinks;
On forest land managed for wood supply a sustainable forest management
will provide biomass to meet future demands for energy and timber. The
yield (harvested growth) will substitute fossil based materials and energy.
The Swedish Government has established a national forest program in
which sustainable forest management is the base. The definition in this
program is equivalent with sustainable forest management defined within the
pan-European forest cooperation Forest Europe and adopted in the EU
Forest strategy.
Productive forests not used for wood supply (productive forests set-aside for
nature conservation) are preserved mainly for nature
conservation/biodiversity. In the simulation no harvesting is assumed in
4 National Inventory Report Sweden 2019. 5
SLU 2019.
Ministry for the Environment 12 (57)these areas nor in low-productive forests and the projection of their
development is reflecting their natural development.
The assumptions in the FRL involves a harvest rate below the highest
sustainable level leading to a larger uptake in the forest, whilst reducing the
harvested volumes. The resulting relative harvest level on managed forest
land during the period 2021-2025 is estimated to 77 % (annual
harvest/annual growth on managed forest land excluding pre-commercial
thinning).
In figure 3 we show the development of the standing volume and the
development of gross increment6 and harvest respectively for managed
forest land from 2010 to 2110, and for information also the historical data
representing 1990-2014. It is a continuation of the simulations used for the
reference level calculations. The standing volume (stem volume from stump
height up to top including bark) is steadily increasing while allowing a high
and sustainable harvest level due to a continuous increase in growth. Net
removals in Living biomass is on annual average just above -33 Mt CO2 over
the 100 year period to be compared to net removals in Living biomass in the
FRL which for the period 2021-2025 is estimated to -30.2 Mt CO2.
It should be noted that the model used does not take into account the
increased probility for natural disturbances associated with large standing
volumes per hectare. In fact, to base future management on the intensity
during the historical reference period may be counterproductive to long-
term sustainability. According to the simulation, maintaining the harvest rate
below the available growth in the production land would result in an almost
twofold increase in standing volume in the production forest compared to
the reference period (see figure 3) and thus, especially in southern Sweden,
extremely large standing volumes per hectare. In such a development in
combination with climate change it is very likely that natural disturbances
due to storms, forest fires and bark beetle attacks will increase dramatically,
both in size and frequency, compared to present levels. This can already be
seen in several other Member States, causing large losses of biomass and
reduced growth. The possible negative effects on the Swedish forest
resource from the projected long-term increase in standing volumes will
therefor be given priority in analyses to be carried out by the Forest Agency
in 2020 and 2021.
6 Gross increment is total growth including natural losses.
Ministry for the Environment 13 (57)6 000
Standing volume [Mm3sk]
5 000
4 000
3 000
2 000
1 000
0
1990 2000 2010 2020 2030 2040 2050 2060 2070 2080 2090 2100 2110
Standing volume Simulated standing volume
Growth and harvest [Mm3sk]
150
120
90
60
30
0
1990 2010 2030 2050 2070 2090 2110
Gross increment Simulated gross increment
Harvest Simulated harvest
Figure 3. The development of the standing volume (above), annual gross increment and harvest
in managed forest land (below) during 1990-2014 based on data from the NFI and for 2010-2110
based on the continuation of the simulated FRL.
Annex IV, section A
(b) the reference level shall ensure that the mere presence of carbon stocks is excluded from
accounting
This criterion is compatible with Decision 16/CMP.1 under the Kyoto
protocol7, where the same principle was affirmed. It reflects the objective of
enhancing the carbon stocks and the net carbon sinks where possible,
instead of only preserving existing carbon stocks. It is understood that a pre-
existing carbon stock in terrestrial vegetation such as a forest on a given area
of land does not contribute towards the reduction of atmospheric carbon.
The FRL intends to support accounting for differences in net changes
7 FCCC/KP/CMP/2005/8/Add.3.
Ministry for the Environment 14 (57)(between actual changes and changes in the FRL) in forest carbon stocks,
rather than accounting for total existing carbon stocks in forests.
Annex IV, section A
(c) the reference level should ensure a robust and credible accounting system that ensures
that emissions and removals resulting from biomass use are properly accounted for
Any change in carbon stock on managed forest land are accounted for in the
LULUCF sector (e.g. the harvest is indirectly accounted as an emission from
the living biomass pool). This is needed because combustion of biomass is
excluded from the accounting within the energy sector.
All carbon pools (Living biomass, Dead wood, Litter, Soil carbon and HWP)
are included in the FRL and in the reporting for Sweden, which ensures that
all emissions and removals of carbon dioxide are accounted for. The FRL is
based on a continuation of the forest management practices during the
reference period, including harvesting intensity, to ensure a credible
accounting system.
Annex IV, section A
(d) the reference level shall include the carbon pool of harvested wood products, thereby
providing a comparison between assuming instantaneous oxidation and applying the first-
order decay function and half-life values
In table 1 we report the outcome for the calculation of the FRL. For the
required comparison we present the FRL using either instantaneous
oxidation or the production approach applying the first-order decay function
and half-life values for HWP.
Annex IV, section A
(e) a constant ratio between solid and energy use of forest biomass as documented in the
period from 2000 to 2009 shall be assumed
The average ratios between produced amounts of raw material from
domestic forests and the production of the product categories sawn wood,
wood based panels, paper products and energy were held constant during
the simulations.
The fraction of solid wood (sawn wood and wood based panels) was
calculated separately. The ratio between sawn wood and the entire logs was
0.48 (m3 under bark) on average during 2000-2009. The three other
Ministry for the Environment 15 (57)categories wood based panels, paper products and energy use were
compared to the amount of raw material used by the wood fiber industry
which are chips and saw dust from saw mill waste and pulp wood. The ratios
raw material/pulp was 0.89, raw material/wood based panels was 0.02, and
raw material/energy was 0.09. These ratios were held constant during the
simulations for the FRL and the distribution of the different product
categories was documented.
Annex IV, section A
(f) the reference level should be consistent with the objective of contributing to the
conservation of biodiversity and the sustainable use of natural resources, as set out in the
EU forest strategy, Member States' national forest policies, and the EU biodiversity
strategy;
The Swedish forest policy has during the last decades increased compliance
with the Convention on Biological Diversity and the EU forest strategy. The
policy aims to manage forests in a sustainable way. The Swedish Parliament
already in 1998 adopted a set of national environmental quality objectives
which are considered a cornerstone of Swedish environmental policy.
Recurrent assessments show that further actions are needed to reach the
ambitious objectives regarding forests, climate and biodiversity. Measures
have been taken and to date, more forests have been designated for nature
conservation and sustainable forest management is continuously improving.
The following assumptions were made when developing the FRL. In
December 2010, 780 kha of the productive forests were assumed formally
protected as nature reserves (national parks, nature reserves and habitat
protection). The non-formal protection cover an estimated area of 1 345 kha
voluntarily set-aside areas and 1 487 kha tree retention areas at harvest sites.
All low-productive forest land (around 4 036 kha) were assumed protected,
i.e. no harvest was expected in the calculations.
The area of voluntary set-aside productive forest land in the analysis is based
on an inquiry made by the Swedish Forest Agency8. The inquiry represents
the state of the forest 2009-2010 and a total area of 1 045 kha was
considered as voluntarily set-aside productive forest land. Voluntarily set-
aside productive forest land areas above the limit for mountain forests 200
kha was amended based on assumptions made by the Swedish Forest
8
Ståhl, P-O et.al.. 2012. ,Skogsstyrelsen 2008.
Ministry for the Environment 16 (57)agency9. In addition, 100 kha was amended in the analysis to include
protected areas (ecoparks) within the state owned forest company Sveaskog
(based on geographical information of the ecoparks from Sveaskog). In the
FRL the relative amount of old forests in the productive forest land
managed for wood supply was maintained in the simulations. The total
amount of old forests is increasing as a result of the areas excluded from
harvesting.
Annex IV, section A
(g) the reference level shall be consistent with the national projections of anthropogenic
greenhouse gas emissions by sources and removals by sinks reported under Regulation
(EU) No 525/2013;
The FRL for Sweden is consistent with the reported national projections
when it comes to the coverage of carbon pools, both the FRL and the
projections under regulation (EU) 525/2013 includes all carbon pools
(Living biomass, Dead wood, Litter, Soil carbon and HWP).
The absolute emissions and uptakes in the FRL and the reported national
projections will be different, though. The former is based on forest
management practices during the reference period 2000-2009, while the
latter is constructed as a projection of the reporting for managed forest land
Annex IV, section A
(h) the reference level shall be consistent with greenhouse gas inventories and relevant
historical data and shall be based on transparent, complete, consistent, comparable and
accurate information. In particular, the model used to construct the reference level shall be
able to reproduce historical data from the National Greenhouse Gas Inventory.
For transparency and consistency, the FRL is developed using the same
definitions of carbon pools and based on the same sampling units as the
Swedish reporting of greenhouse gas inventories under EU and UNFCCC.
For both the carbon reporting and the FRL, the reporting is complete.
However, the initial state in 2010 is not exactly the same. For example,
basing the FRL on the average management 2000-2009, makes the different
approaches less comparable after 2010. Finally, the sampling accuracy should
be similar but a projection introduces uncertainty.
9 Skogsstyrelsen 2008.
Ministry for the Environment 17 (57)In order to verify the model, the development for living biomass during
1990-2010 was simulated based on the modelling framework applied for the
FRL (Heureka RegVis). The simulation was based on documented historical
data of forest state and forest management practices (including harvest
intensities), using the same principles for land conversion as the GHG
inventory.
The simulation results are presented as annual changes in GHG emissions
from living biomass as CO2 equivalents during 5-year periods and compared
to the annual historical data from GHG inventory (figure 4). The 5-year time
step in the model makes it difficult to reproduce the relatively large inter-
annual variation in the GHG inventory data, but the average during 2000-
2009 is very close given the uncertainties. The harvests and annual net
increments in the simulation fits very well to the historical NFI data (figure
4).
Ministry for the Environment 18 (57)1 990 1 995 2 000 2 005 2 010 2 015
0
-5
[Mt CO2-eq year-1]
-10
-15
-20
-25
-30
-35
-40
Simulation 1990-2015 NIR 2019
140
Growth and harvest [Mm3sk]
120
100
80
60
40
20
0
1990 1995 2000 2005 2010 2015
Harvest NFI Harvest simulation
Net growth NFI Net growth simulation
Figure 4. Annual changes in GHG emissions as CO2 equivalents in simulations 1990-2015
together with data from GHG inventory (above) and total net growth and harvests in the
simulation and from the NFI data during 1990-2015 (below).
In order to verify the reporting of changes in the soil organic carbon pool a
project was initiated comparing the precision and the uncertainty in the
determination of litter and soil carbon pool changes using different
methods10. Results from two soil carbon models, Yasso07 and Q, were
compared with repeated measurements of the Swedish Forest Soil Inventory
(SFSI) during the years 1994 to 2000. Soil carbon fluxes were simulated with
the two models from 1926 to 2000 with Monte Carlo methodology to
estimate uncertainty ranges. The results from the models agreed well with
measured data regarding the development of the carbon stocks. However,
10 Ortiz CA et.al. 2009.
Ministry for the Environment 19 (57)the annual change in soil organic carbon varied substantially between the
three methods mainly due to different assumptions regarding annual
variation in climate data. The average soil organic carbon change for two
five-year periods indicated that the size and direction of the estimated annual
changes agree reasonable well (figure 5). It was concluded that the models
are particularly useful for projections.
Figure 5. Figure from Ortiz CA et.al. 2009. Change of SOC. Average for two 5-year periods 1994
to 1998 (1) and 1996 to 2000 (2) together with the uncertainty bounds of the modelled change
and the standard error of the repeated measurements
Annex IV, section B
(e) a description of how each of the following elements were considered in the determination
of the forest reference level:
(i) the area under forest management;
(ii) emissions and removals from forests and harvested wood products as shown in
greenhouse gas inventories and relevant historical data;
(iii) forest characteristics, including dynamic age-related forest characteristics, increments,
rotation length and other information on forest management activities under ‘business as
usual’;
(iv) historical and future harvesting rates disaggregated between energy and non-energy
uses.
(i) The area under managed forest land used in the calculation of
the forest reference level is the projected area of managed forest land for the
period 2021-2025. The projected area of managed forest land considers both
an increase in area due to the inclusion of afforested land after 20 years and
an decrease due to deforestation 2021-2025. To avoid double counting, both
the addition of areas due to afforestation and losses of areas due to
deforestation will be recalculated (technical correction) using actual numbers
at the end of the compliance period.
Ministry for the Environment 20 (57)(ii) Emissions and removals from forests and harvested wood
products as reported to the EU and the UNFCCC are shown in figure 6 and
table 211. The total net removals for forest land remaining forest land is
stable over the reported period with tendencies towards a slight increase in
total net removals over time. The carbon stock change estimates reported to
the EU and the UNFCCC are not directly used in the FRL-estimate.
However, the same NFI and SFSI-plots (mainly to estimate Living biomass,
Soil carbon and Areas) are used as the basis for estimating the FRL as for
the reporting to the EU and the UNFCCC. For emissions other than carbon
stock changes, the reported data are directly used in the FRL-estimate.
Either averages for the reference period 2000-2009 or annual estimates for
2010 is applied. Although all pools in the GHG inventory were included in
the FRL, the modelling framework did not allow for the same grouping of
the reported categories. Therefore, the GHG-inventory data presented in
table 2 was reorganized to harmonize with the results for the FRL.
25000
15000
5000
[kt CO2-equivalents]
-5000
-15000
-25000
-35000
-45000
-55000
-65000
-75000
1990
1991
1992
1993
1994
1995
1996
1997
1998
1999
2000
2001
2002
2003
2004
2005
2006
2007
2008
2009
2010
2011
2012
2013
2014
2015
2016
2017
Living biomass Dead wood
Litter Mineral soils
Organic soils 4(I) Fertilisation
4(II) Non-CO2 from drainage 4(V) Biomass burning
HWP Total
Figure 6. Emissions and removals for Forest land remaining forest land as reported to the EU and
the UNFCCC in Submission 2019.
11 National inventory report Sweden 2019.
Ministry for the Environment 21 (57)Table 2. Emissions and removals for Forest land remaining forest land as reported to the EU and
the UNFCCC in Submission 2019. The presented pools deviate from the from the GHG inventory
in order to harmonize with the FRL-simulation results.
[kt CO2-equivalents] 1990 1995 2000 2005 2010 2015 2017
Living biomass -36 014 -35 441 -36 081 -22 035 -36 310 -35 986 -36 309
Mineral soils -7 721 -6 591 -10 454 -11 800 -10 050 -11 409 -11 899
Dead wood (stems) -1 789 -1 786 -2 030 -2 109 -1 053 -2 404 -3 289
Dead wood (stumps) -2 414 -1 258 -4 628 -7 333 -6 216 -4 865 -4 356
Litter+Soil -3 517 -3 547 -3 796 -2 357 -2 781 -4 140 -4 254
Organic soils 7 356 7 345 7 296 7 222 6 567 6 210 6 191
Dead wood * * * * * * *
Litter+Soil+DOC 5 996 5 986 5 946 5 893 5 371 5 057 5 038
Non-CO2 1 360 1 359 1 350 1 330 1 197 1 153 1 153
HWP -5 016 -6 403 -7 777 -10 797 -8 194 -6 658 -6 714
Fertilisation (N2O) 49 18 17 22 56 23 18
Biomass burning (non-CO2) 2 2 4 6 1 2 2
TOTAL WITHOUT HWP -36 328 -34 667 -39 218 -26 584 -39 735 -41 160 -41 997
TOTAL WITH HWP -41 344 -41 070 -46 996 -37 381 -47 929 -47 818 -48 711
* CO2 emissions and uptakes from dead wood on organic soils have been included in mineral soils.
(iii) Here ”Business as usual” is interpreted as the average
management practices in managed forest land during 2000-2009 for
production land (no management for wood supply is considered on other
types of forest land). The projected age distribution is restricted by the initial
state (e.g. the age distribution 2010), the natural conditions (e.g. site fertility),
BAU-management and harvest level (figure 7 to 9). The BAU-management
sets e.g. the distribution between final felling and thinning, harvested species
distribution, regeneration methods, regenerated species distribution,
fertilization which steers the development of the growth (table 3 and 12).
The rotation period length is an indirect result of the simulations. The
minimum stand age when final felling is allowed is regulated by the Forestry
Act and is dependent on site fertility, dominating species and region. A rule
of thumb is that forest companies normally harvest at the minimum age for
final felling plus 10 years. The normal length of the rotation period is
between 45 and 90 years in southern Sweden and between 65 and 100 years
in northern Sweden. Note also that normal forestry practices include
thinning of the forest two to four times during a rotation period.
Ministry for the Environment 22 (57)Figure 7. Age class distribution for production land (including TR), representing 2010 (start of
simulation), 2020 and 2030. Based on standing volume and area respectively.
Figure 8. Age class distribution for productive forest land formally and voluntarily set-aside for nature
conservation representing 2010 (start of simulation), 2020 and 2030. Based on standing volume and
area respectively.
Figure 9. Age class distribution for low-productive forest land representing 2010 (start of
simulation), 2020 and 2030. Based on standing volume and area respectively.
Ministry for the Environment 23 (57)Table 3. Net annual increment for productive forest land managed for wood supply, including tree
retention patches, 1988-2033 according to the NFI, five year average, and according to the projections
for 2013 to 2033.
1993 1998 2003 2008 2013 2018 2023 2028 2033
Net growth [Mm3sk] 85 88 93 100 98 101 101 105 108
(iv) Historical and future harvesting rates disaggregated between
energy and non-energy uses are shown in figure 10. The allocation of
harvested round wood to different product categories such as solid wood
products, paper products and energy use was calculated using data from the
Swedish Forest Agency. The peaks of 2005 and 2007 are due to large storms.
120
100
80
[Mm3sk]
60
40
20
0
1990 1995 2000 2005 2010 2015 2020 2025 2030
Sawlogs Pulpwood Fuelwood Total
Figure 10. Observed annual net harvest 1990-2017 and simulated net harvest for the periods 2015-
2020, 2020-2025 and 2025-2030. Dashed lines represent averages during the reference period 2000-
2009.
Ministry for the Environment 24 (57)2. Preconditions for the forest reference level 2.1 Carbon pools and greenhouse gases included in the forest reference level The forest reference level for Sweden includes changes in the carbon pools Living biomass (above and below ground), Dead wood, Litter, Soil organic carbon and Harvested wood products. No carbon pools have been omitted in the forest reference level for Sweden. The forest reference level also includes emissions from forest fertilization (N2O), from drained organic soils (N2O, CH4 and DOC), mineralization (N2O) and biomass burning (CO2, N2O and CH4). 2.2 Demonstration of consistency between the carbon pools included in the forest reference level Living biomass refer to the biomass of all living trees with a height of at least 1.3 m. Thus, small trees, shrubs and other vegetation, such as herbs are not included in the biomass estimates. Both the aboveground and belowground biomass pools are reported. Aboveground biomass is defined as living biomass above stump height (1 % of tree height). Belowground biomass is defined as living biomass below stump height (1 % of tree height) down to a root diameter of 2 mm (fine roots,
soils classified as Histosols. The carbon pool considered is soil organic
carbon down to a depth of 0.5 m measured from top of the mineral soil.

Harvested wood products are defined as wood material leaving the harvest
site. Emissions from the HWP-carbon pool are based on pool changes of
three product categories; sawn wood, wood based panels, and paper
products.

2.3 General description of forests and forest management in Sweden
 In total Sweden’s forest land amounts to about 28 Mha of which 23.4 Mha
is regarded productive forest. There are 4.7 Mha low-productive forests.
Until today 1.1 million hectares have been designated for nature protection
in formally protected areas. The amount of voluntarily set aside forests is
about 1.2 million hectares according to an inquiry made by the Swedish
Forest Agency12. In addition, an inquiry made by the Swedish Forest agency
shows there are about 8 percent of forest land tree retention at final felling
sites. These areas are assumed to in total consist of 1.6 million hectares of
productive forest land, under a future rotation period13.
Of the productive forests, 48% are owned by individuals, 24% by private
companies, 6% by other private owners and 21% by state-owned companies,
the central Government and other public owners14.
A continuously increased demand for forest raw materials by the forest
industry has led to an increase in felling during the period 1990–2015 (figure
10). The volume felled varied greatly in two years because of two storms,
Gudrun (2005) and Per (2007). Gudrun, the more severe of the two, brought
down some 80% of the normal annual volume felled in Sweden. Despite
increased felling, the aggregate standing volume of timber rose from some
2 800 M m3 in 1990 to 3 300 M m3 in 2009 and 3 500 M m3 in 2014.

The area of regeneration felling in which harvesting residues are extracted
for energy purposes was small at the beginning of the 1990s. Since then, the
area planned for forest residue extraction notified to the Swedish Forest
Agency has expanded and has varied between 86 and 156 kha since 2006
with no clear trend.

12
     Swedish Forest Agency 2017 (Meddelande 4 2017).
13
     Swedish Forest Agency 2012 (Rapport 10 2015).

14 Swedish Forest Agency 2018.

                                                       Ministry for the Environment 26 (57)
In 2018 the spruce forest in southern Sweden was stressed after an unusually
dry summer. This led to a sharp increase of the spruce bark beetle attacks in
2019. In 2019 the spruce bark beetle caused damage to almost 7 million
cubic meters of forest in southern and central Sweden, which is the highest
measured amount ever due to the spruce bark beetle. Spruce bark beetle
attacks usually occur in cycles of 3–4 years. This is a situation that will
probably continue for several years with major financial losses for the forest
based industry. The industry is now cooperating with the authorities to limit
the spread.
2.3.1 Forest management practices 2000-2009
Information on silvicultural activities in Sweden are based on questionnaire
surveys. Until 2014, the Swedish Forest Agency annually conducted a survey
of nearly all corporate forest holdings and of other large forest holdings and
a sample of private forest owners of different size. Detailed information can
be found in the statistical yearbooks produced by the Swedish Forest Agency
15 (Skogsstyrelsen 2000-2011). The information from these surveys as well as
observations from the NFI (representing the years 2000-2006) forms the
basis for the settings in the simulation of the FRL.
The statistics include annual information on:
• Pre-commercial thinning of young forests (320 kha in average 2000-
2009)
• Soil scarification (160 kha in average 2000-2009)
• Planted area (157 kha in average 2000-2009)
• Fertilized area (33 kha in average 2000-2009)
2.4 General description of national policies and legislation with effect
on forestry in Sweden
Current legislation affects emissions and removals in the sector, mainly due
to regulations on forest management in the Forestry Act and provisions on
nature reserves and habitat protection in the Environmental Code and
nature conservation agreements. The Forestry Act and the Environmental
Code are described in the next section.
A governmental bill on Biological Diversity and Ecosystem Service was
presented in March 2014 including five environmental interim targets linked
15 Swedish Statistical Yearbook of Forestry. 2001-2010.
Ministry for the Environment 27 (57)to already established national environmental quality objectives. These
interim targets include a target stating that at least 20 percent of land areas
should contribute to attain objectives for biological diversity. Protected areas
should increase by at least 1 142 kha between the years 2012 and 2020,
including the additional formal protection of 150 kha of forest land and 200
kha of forest land to be set-aside voluntarily.
To reach the objectives of the environmental and forest policies voluntary
efforts by the landowners are crucial. Advice to the forestry sector from the
central government to promote effective and functional conservation
measures for the environment and improved forest management play a
fundamental role.
On 17 May 2018, the Government adopted a strategy for Sweden’s National
Forest Program. In July 2018, the Government adopted an action plan with
specific measures. The action plan will be updated in dialogue with
interested parties. The core of the National Forest Program is the broad
dialogue on the role forests play to ensure a sustainable society and a
growing bioeconomy. The work is guided by the program’s vision: “Forests
– our ‘green gold’ – will contribute to creating jobs and sustainable growth
throughout the country, and to the development of a growing bioeconomy.”
2.4.1 The Swedish Forestry Act and the Environmental Code
The Swedish Forestry Act has two overarching, equal objectives: a
production objective and an environmental objective.
The production objective means that forests and forest lands should be used
effectively and responsibly in order to produce sustainable yields. The
direction of forest production should be given flexibility in the use of what
the forests produce.
The environmental objective means that the natural productive capacity of
forest land should be preserved. Biodiversity and genetic variation in forests
should be secured. Forests should be managed in a manner that enables
naturally occurring flora and fauna to survive in natural environments and in
viable populations. Threatened species and habitats should be protected.
The cultural heritage of forests and their aesthetic and social values should
be safeguarded.
Under the current Forest policy, production subsidies are abolished, and
forest owners have considerable freedom and responsibility to independently
Ministry for the Environment 28 (57)conduct long-term sustainable forest management. The regulations
concerning wood supply cover the notification of felling allowed, the lowest
age for felling, requirements for reforestation, guidelines for thinning and
measures to limit damage. Special regulations apply to certain types of
forests, such as subalpine forests and deciduous forests. Examples of
regulations concerning nature conservation and cultural heritage include not
disturbing important biotopes, buffer zones and arable land, and leaving
older trees, high stumps and dead wood in situ. Sustainable forest
management influences carbon dioxide removals and emissions in various
ways, through the production of renewable raw materials that can replace
fossil fuels and materials that generate emissions of greenhouse gases while
maintaining or increasing carbon stocks in biomass, soils and harvested
wood products.
The Swedish Environmental Code is a coordinated, broad and strict
environmental legislation aimed at promoting sustainable development so
that present and future generations can live in a good, healthy environment.
For example, the Code contains regulations on land drainage. In central
parts of the southern Swedish highlands and north of the Limes Norrlandicus
(north of 60°N), drainage – defined as drainage intending to permanently
improve the suitability of a property for a certain purpose – may only be
undertaken with a permit. In the rest of the country, and on sites specially
protected under the RAMSAR Convention, such measures are prohibited.
Protection and restoration of peatlands with high carbon stocks can reduce
emissions of carbon dioxide to the atmosphere.
Conservation measures (site protection, nature conservation agreements and
voluntarily set-aside of land) not only preserve biodiversity, but also
positively impact carbon stocks in forest biomass and soil carbon, by
allowing them to be maintained or to continue to increase. Protected forest
ecosystems have a large capacity to sequester carbon, even long after a
conservation measure is implemented, although there are exceptions in areas
where natural disturbances like forest fires are frequent. There are also
targets for the conservation and protection of areas containing both
wetlands and forest land. Since such areas are usually excluded from felling,
their stocks of carbon in biomass and soil will, in most cases, be larger than
those of productive forests.
Ministry for the Environment 29 (57)2.5 Description of future harvesting rates under different policy
scenarios
Several projects have studied the development of the forest resources in
Sweden under different scenarios. The latest national forest resource
assessment16 included four scenarios representing different assumptions
regarding the demand for timber and the level of implementing strategies for
protecting forest land. The reference (business as usual) scenario represents
the development of the forests on productive forest land under current
forest management practices assuming highest sustainable harvests. One
scenario studied the development with a lower demand for timber (-10%)
and another assuming higher demand for timber (+10%). The last scenario
included an expansion of the set-aside areas for nature conservation by
100%, the rest of the forests were managed as in the reference scenario.
Another recent study used these scenarios to study the total climate benefit
of forests and forest products under different forest strategies17 including
also a scenario where measures to increase the production was implemented
including increase of the use of fertilizers, more efficient thinning operations
etc. The scenario uses the same principles for harvest as in the reference
scenario. Finally, the harvest level used as reference scenario in the reporting
of scenarios to the EU is presented18. The development of the harvest level
is assumed to develop from lower than the current levels to meet the
gradually increase in demand of timber from society.
In figure 11 below we present these six scenarios. The business as usual
scenario (DS) is the development under the continuation of current forestry
with highest sustainable harvest. DS90 and DS110 represent the scenarios
with lower or higher demand for timber, respectively. The scenario studying
the development when the set-aside area is doubled compared to the current
area is denoted DN, the scenario PROD represents the scenario with focus
on increased production and TREND the scenario reported to the EU. All
scenarios results in higher harvest levels in the end of the century compared
to the harvest level at the start of the simulation (today’s situation). It can be
noted that even the scenario with double set-aside areas have an increase in
harvest that exceeds the harvest for the reference scenario at the beginning
of the period.
16 Skogliga konsekvensanalyser 2015 – SKA 15, Skogsstyrelsen Rapport 10 2015.
17 Underlag till nationella skogsprogrammet.
18 Report for Sweden on assessment of projected progress, March 2017.
Ministry for the Environment 30 (57)You can also read