Mexico's electricity grid and fuel mix: implications of a fifteen-year planning horizon on emissions and air quality - IOPscience
←
→
Page content transcription
If your browser does not render page correctly, please read the page content below
LETTER • OPEN ACCESS

Mexico’s electricity grid and fuel mix: implications of a fifteen-year
planning horizon on emissions and air quality
To cite this article: Elena C McDonald-Buller et al 2021 Environ. Res. Lett. 16 074050

View the article online for updates and enhancements.

                               This content was downloaded from IP address 46.4.80.155 on 19/09/2021 at 14:12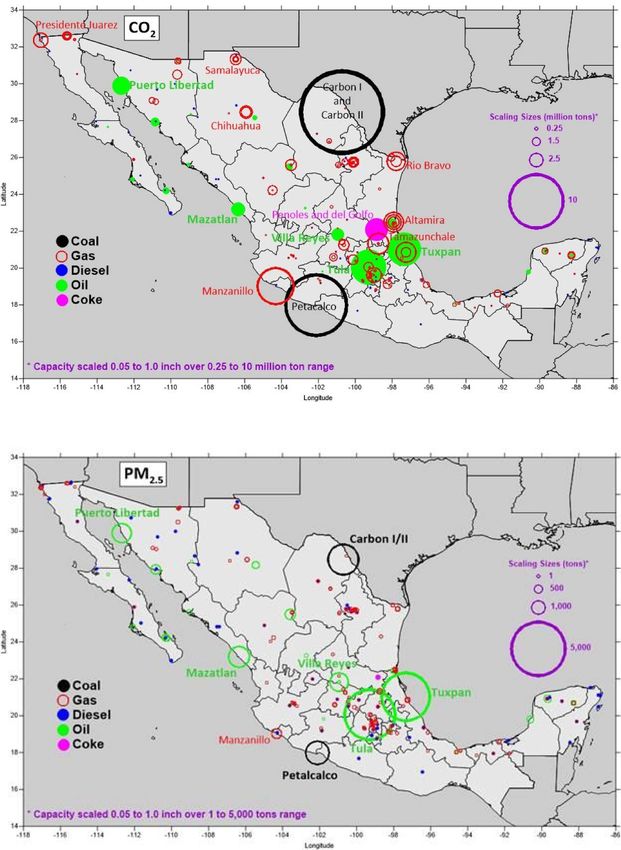
Environ. Res. Lett. 16 (2021) 074050 https://doi.org/10.1088/1748-9326/ac0fa5
LETTER
Mexico’s electricity grid and fuel mix: implications of a fifteen-year
OPEN ACCESS
planning horizon on emissions and air quality
RECEIVED
8 April 2021 Elena C McDonald-Buller1,∗, Gary R McGaughey1, Tejas Shah2, John Grant2, Yosuke Kimura1
REVISED
21 June 2021
and Greg Yarwood2
1
ACCEPTED FOR PUBLICATION Center for Energy and Environmental Resources, The University of Texas at Austin, 10100 Burnet Road, Building 133, Mail Code R7100,
29 June 2021 Austin, TX 78758, United States of America
2
PUBLISHED
Ramboll, 7250 Redwood Boulevard, Suite 105, Novato, CA 94945, United States of America
∗
14 July 2021 Author to whom any correspondence should be addressed.
E-mail: ecmb@mail.utexas.edu
Original content from
this work may be used Keywords: Mexico, electricity sector, air quality, energy reform, energy systems, emissions inventory
under the terms of the
Creative Commons
Supplementary material for this article is available online
Attribution 4.0 licence.
Any further distribution
of this work must
maintain attribution to
Abstract
the author(s) and the title Energy reform that required amendments to the Mexican Constitution in 2013 and implementing
of the work, journal
citation and DOI. legislation aimed to increase the efficiency, economic competitiveness, and decarbonization of
Mexico’s electricity sector. Emissions inventories were developed for the 2016 base year and a
capacity development pathway established by Mexico over a 15-year planning horizon to 2031.
Between 2016 and 2031, steep declines in generation from fuel oil-fired thermoelectric, turbogas,
and coal plants in favor of a buildout of natural gas combined cycle and clean energy technologies
were predicted to drive reductions in emissions of sulfur dioxide (SO2 ), fine particulate matter
(PM2.5 ), carbon dioxide (CO2 ) and nitrogen oxides (NOx ) of 68%, 61%, 13% and 7%, respectively,
with an increase in carbon monoxide (CO) of 4%. Retirement of fuel oil-fired thermoelectric and
coal generation contributed to substantial reductions in 24 h average PM2.5 concentrations in
Mexican and U.S. border states even with rising demand. In contrast, little change in maximum
daily average eight-hour ozone concentrations was predicted with expansion of natural gas
combined cycle generation, which is a source of NOx and CO. Mexico’s electricity sector planning
process has been highly dynamic since the reform. Insights indicate how changes in national
strategies could affect emissions and air quality outcomes.
1. Introduction and trade was allowed in a new wholesale elec-
tricity market and for supply services [6, 7]. The
Mexico initiated transformational changes to its Energy Transition Law and General Climate Change
electricity sector during the last decade aimed at Law established minimum targets for clean energy
increasing its efficiency, economic competitiveness, power generation of 30% by 2021 and 35% by 2024
and decarbonization [1–4]. Energy reform was part [4, 8, 9]. Pursuant to these goals, Mexico introduced
of the Pacto por Mexico implemented under the an obligations market for the acquisition of clean
administration of Enrique Peña Nieto that required energy certificates by suppliers and qualified con-
ratification of amendments to the Mexican Consti- sumers representing generation from clean power
tution in December 2013 [1]. Secondary implement- sources [3, 4, 10, 11] and auctions for long-term clean
ing legislation included the Electricity Industry Law energy capacity projects [12].
and Federal Electricity Commission (CFE) Law in Mexico’s national strategies for its electricity
2014 and Energy Transition Law in 2015 [2–4]. The sector have been highly dynamic. No changes to
reform unbundled electricity generation, transmis- the Mexican Constitution have been made regard-
sion, distribution, and supply activities of the CFE ing energy reform; however, the administration
and transformed it to a productive state enterprise of Andrés Manuel López Obrador that began in
[2, 5]. Private participation in electricity generation December 2018 has emphasized energy sovereignty,
© 2021 The Author(s). Published by IOP Publishing Ltd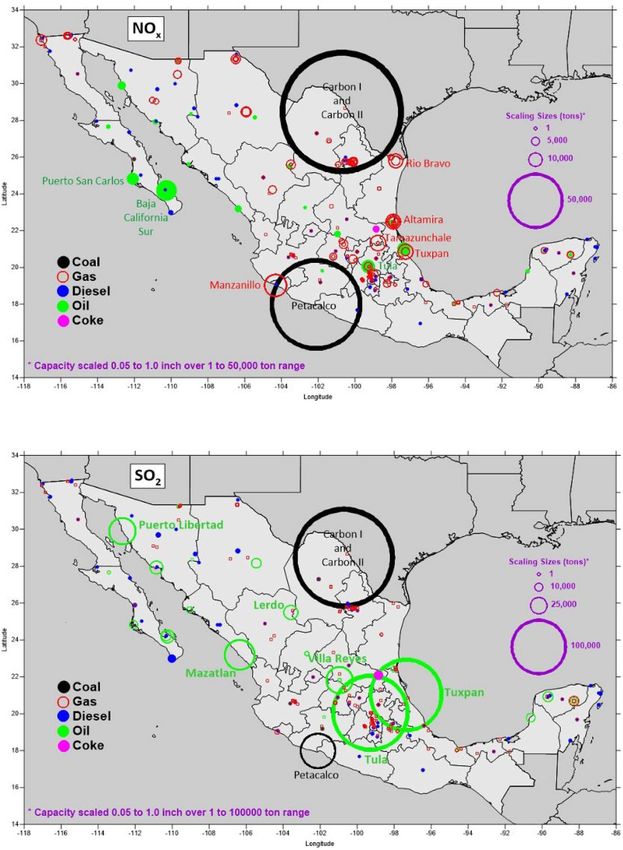
Environ. Res. Lett. 16 (2021) 074050                                                         E C McDonald-Buller et al

prioritization of CFE over the private sector, and          capacity planning for the National Electric System
use of fossil fuels over renewable energy sources           (SEN). A bottom-up approach was used to develop
[13]. On 9 March 2021, Mexico altered provisions            plant-level estimates of CO2 , NOx , CO, SO2 , volat-
of the 2014 Electric Industry Law [14] and man-             ile organic compound (VOC), and PM2.5 emissions
dated an order of dispatch regardless of economic           in 2016, which was the base year of the National Col-
merit that prioritizes hydroelectric, nuclear, thermo-      laborative Emissions Modeling Platform developed
electric, and combined-cycle plants owned by CFE            by the U.S. Environmental Protection Agency (EPA)
over privately owned wind, solar, and combined-cycle        and U.S. states [29]. Previous studies in Mexico have
plants. Although a temporary injunction was issued          used bottom-up methods that apply emission factors
shortly thereafter in an amparo (constitutional writ        from the EPA AP-42 compilation [30] with activ-
of protection) proceeding [15], these developments          ity rates based on fuel consumption or generation
raise concerns for Mexico’s international trade agree-      [21, 23, 31–33]. Emission inventories have recently
ments, emissions profiles, and clean energy genera-         been developed for thermal power plants in China,
tion commitments [16, 17].                                  Vietnam, Kuwait, and Brazil using a similar bottom-
     Decreasing the reliance of national electricity sys-   up approach, but with emission factors that had dif-
tems on fossil fuels is integral to achieving reductions    ferent levels of specificity including industry average
in carbon emissions and improvements in air quality         values in the AP-42 compilation, regional or global
and public health. Generation of electricity and heat       estimates, or direct measurements from continuous
accounts for 30% of global greenhouse gas emissions,        emissions monitoring systems [28, 34–36]. Mexico
a share which is similar in Mexico (193.2 Mt CO2e           issued regulatory requirements in 2012 [37] for sup-
or 28% of the 679.9 Mt CO2e of greenhouse gas               pliers to provide annual estimates of emissions per
emissions in 2018) [18]. Fossil fuel combustion is          megawatt-hour (MWh) by technology based on oper-
a source of sulfur dioxide (SO2 ), nitrogen oxides          ating parameters, including fuels, for inclusion in
(NOx ), carbon monoxide (CO), particulate matter            the Costs and Reference Parameters for the Formu-
(PM), and mercury and other heavy metals. Emis-             lation of Investment Projects in the Electricity Sector:
sions from Mexico’s thermoelectric plants that burn         Generation (COPAR). We applied COPAR emission
heavy fuel oil or coal impact local and regional            factors [38] with plant-level annual electricity gener-
air quality [19–22] and have been associated with           ation in 2016 reported by Mexico’s Ministry of Energy
increased adult [23] and infant mortality and reduced       (SENER).
life expectancy [24]. Blackman et al [25] found that            SENER is required to issue annually the Pro-
transport of PM2.5 pollution from power plants oper-        gram for the Development of the National Electrical
ating along the U.S.-Mexico border can exacerbate           System (PRODESEN) which serves as the primary
cross-border health outcomes including respiratory          planning instrument for the generation, transmis-
symptoms and asthma.                                        sion, and distribution of electricity within the SEN.
     National planning for energy transitions and           The PRODESEN incorporates an Indicative Pro-
investments in infrastructure is needed to achieve cli-     gram for the Installation and Removal of Power
mate and air quality objectives. Cory [26] suggests         Plants (PIIRCE) that projects capacity expansions
that electricity sector planning involve both short-        and decommissioning over the following 15 years.
term actions (5–10 years) and long-term strategies          In support of our work, future generation and emis-
(50 years) to allow for course corrections, flexibility     sions were estimated based on the PRODESEN 2017–
to adopt emerging technologies, evolution of mar-           2031 [39]. The Comprehensive Air Quality Model
ket and policy structures, and removal of critical-         with extensions (CAMx) was used to examine the
path barriers. The long-life of fossil fuel technologies    effects of fossil fuel generation in 2016 and 2031 on
can continue reliance on carbon intensive pathways          ozone and PM2.5 concentrations in Mexican and U.S.
[26]. For example, Shearer et al [27] found that con-       border states. Six PRODESEN [39, 40–44] have been
tinued development of coal-fired capacity in India          issued since the reform; none are binding and as
had the potential to ‘lockout’ low carbon infrastruc-       such changes can occur between years. Our findings
ture, which was inconsistent with its national electri-     provide insights on how changes in priorities for Mex-
city sector plan and climate commitments. National          ico’s electricity sector could affect emissions and air
policies can result in differential outcomes for pollut-    quality.
ant emissions. Alhajeri et al [28] found that reduc-
tions in crude oil and heavy fuel oil and growth in         2. Methods
natural gas and gas oil use between 2015 and 2030
would not achieve lower emissions for all air pollut-       2.1. Base year generation and emissions estimates
ants and recommended greater penetration of renew-          Electricity demand in Mexico has increased on aver-
able energy in Kuwait.                                      age 1.6% per year since 2000 [45]. Total installed
     This study examined the emissions and air qual-        capacity across Mexico’s SEN was 73 510 MW in
ity impacts of Mexico’s electricity sector between a        2016 with 52 331 MW corresponding to conventional
15 year time horizon from 2016 to 2031 that reflected       fossil fuel plants (coal, natural gas combined cycle,

                                               2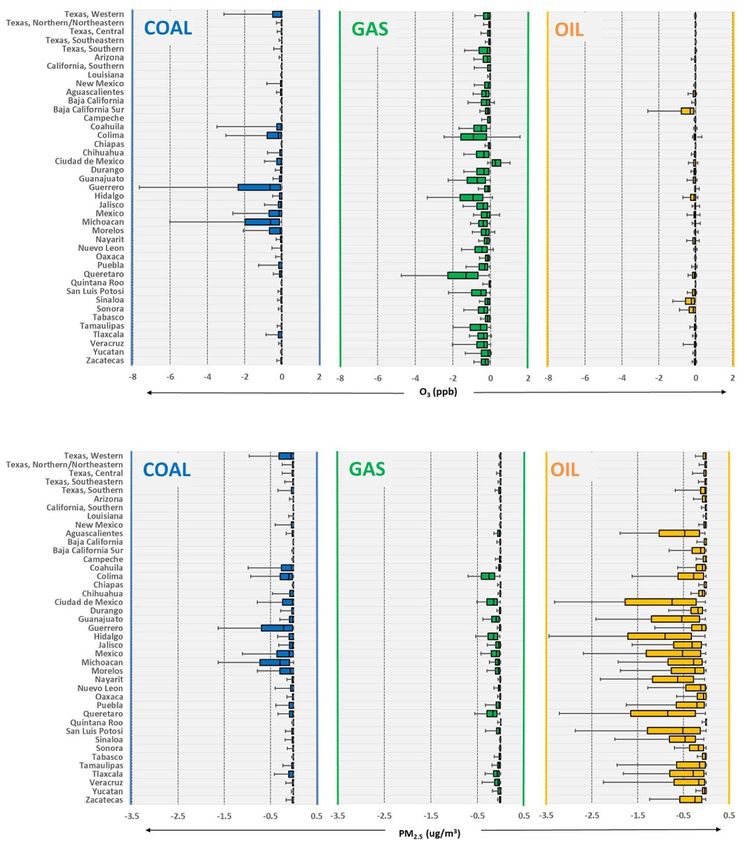
Environ. Res. Lett. 16 (2021) 074050                                                                         E C McDonald-Buller et al

   Figure 1. Annual 2016 and projected 2031 electricity generation from conventional fossil fuel and clean energy by technology type.

fuel oil or gas-fired thermoelectric, turbogas, internal             and EF represents the plant-specific emission
combustion) and the remaining to clean energy                        factor (kg MWh−1 ). Electricity generation in 2016
from renewable (solar, wind, bioenergy, geothermal,                  for each of the 355 plants was obtained from
hydroelectric) and other (nuclear, efficient cogen-                  the PRODESEN 2017–2031 [39]. However, the
eration) technologies [39]. Figure 1 compares                        PRODESEN 2017–2031 provided only aggregate
nationwide 2016 generation from conventional                         emission factors by technology and plant capacity
fossil fuel and clean energy technologies based on                   or fuel based on COPAR data. We applied instead
the PRODESEN 2017–2031 [39]. Mexico’s electri-                       plant-level emission factors directly from the COPAR
city generation was 317 062 GWh in 2016 with                         2015 [38] which was available within the public
252 289 GWh (80%) from conventional fossil fuel                      domain. A total of 89 plants that accounted for 57%
technologies, primarily combined cycle (50%), con-                   of total nationwide generation were included in the
ventional thermoelectric (13%), and coal (11%)                       COPAR. The information in the COPAR did not
plants. The largest contributions from clean energy                  allow us to track how individual plant-level emission
generation were from hydroelectric (10%), nuclear                    factors were derived. Median and maximum values
(3%), and wind (3%) power.                                           of emission factors across COPAR plants by techno-
    Locations of fossil fuel generation by primary                   logy and fuel are shown in table S1 (available online
fuel type, shown in figure 2, were based on facility-                at stacks.iop.org/ERL/16/074050/mmedia). Median
level mappings between PRODESEN [39, 41], North                      emission factors were applied by technology and fuel
American Cooperation on Energy Information [46],                     for 266 plants (43% of generation) that were not
and 2008 Mexico National Emissions Inventory                         included in the COPAR.
(INEM) [47] data. Natural gas, coal, and fuel oil-                       Table S1 indicates that all coal and most fuel oil-
fired electricity generating units (EGUs) contributed                fired plants were included in the COPAR 2015. How-
approximately 72%, 14%, and 13%, respectively, to                    ever, natural gas and diesel-fired generation was less
fossil fuel generation in 2016.                                      complete. The most significant gap was for natural gas
    Individual contributions varied with 83 of 355                   combined cycle plants which constituted a large share
EGUs accounting for 95% of combined fossil fuel gen-                 of nationwide generation. Natural gas combined cycle
eration across Mexico.                                               plants that were included in the COPAR were oper-
    Estimates of NOx , CO, SO2 , VOC, PM2.5 , and                    ated by either the CFE or independent energy produ-
CO2 emissions were developed using a bottom-up                       cers (PIEs). Of those not included, four were owned
approach according to the following:                                 by CFE, the largest of which was the Manzanillo
                                                                     power station (10 412 GWh), and the remaining
                       Ei,j = Aj × EFi,j                      (1)    38 were PIEs, self-supply, cogeneration, or industrial
                                                                     sources (76 062 GWh).
where i and j represent the emitted pollutant                            Stack exit release parameters were not avail-
and plant, A is plant-level generation (MWh),                        able through the PRODESEN 2017–2031 or COPAR.

                                                       3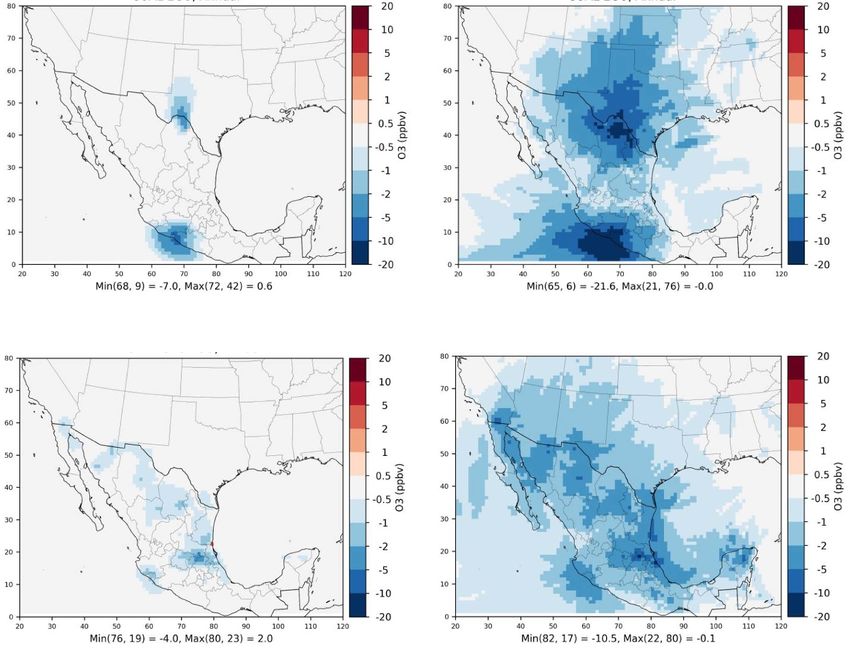
Environ. Res. Lett. 16 (2021) 074050                                                                      E C McDonald-Buller et al

                               Figure 2. Fossil fuel generation (GWh) by primary fuel type during 2016.

Stack parameters from the 2008 INEM were matched                    2031. All clean energy technologies were assumed to
to 156 EGUs identified in the PRODESEN that                         have negligible emissions.
comprised 85% of total electricity generation during                    Statewide estimates of conventional fossil fuel
2016. For the remaining 199 EGUs that accounted                     generation in 2031 were applied with an analysis
for 15% of generation representative values by com-                 of EGU-level infrastructure based on the PIIRCE
bustion category (table S2) were developed based on                 plans and our 2016 emissions inventory to estimate
INEM records.                                                       emissions in 2031. Emissions from a given conven-
                                                                    tional fossil fuel technology were assumed unchanged
                                                                    between 2016 and 2031 if statewide generation was
2.2. Estimates of generation and emissions in 2031
                                                                    unchanged, while reductions in generation were asso-
The PIIRCE development plans within the
                                                                    ciated with an across-the-board downscaling of emis-
PRODESEN 2017–2031 established the chronolo-
                                                                    sions at existing 2016 EGU locations. Specific exist-
gical sequence of capacity additions and retirements
                                                                    ing facilities were retired when inferred from changes
by state with consideration of factors such as gross
                                                                    in statewide capacity. Increases in statewide genera-
domestic product (GDP), fuel price, demand and
                                                                    tion between 2016 and 2031 were assumed to be new
consumption, and the trajectory of clean energy goals
                                                                    capacity buildout. Emissions from the buildout were
[39]. Projections of electricity generation were avail-
                                                                    estimated using median emission factors grouped by
able only nationwide for 2031. Statewide estimates of
                                                                    state and technology shown in table S1. Statewide
fossil fuel generation in 2031 were developed by scal-
                                                                    emissions increases were spatially allocated among
ing existing 2016 to projected 2031 statewide capacity
                                                                    all EGUs during 2016 with similar technology; if
in addition to nationwide 2016 and 2031 generation
                                                                    no activity occurred during 2016, emissions were
by technology.
                                                                    allocated to the state’s centroid. It was conservat-
     Estimates of 2031 generation applied a similar
                                                                    ively assumed that expansion of future capacity would
approach for each clean energy technology. Genera-
                                                                    apply technology with similar emission rates as that of
tion for states that had no changes in capacity by 2031
                                                                    the 2016 base year infrastructure in Mexico.
was set equal to 2016 generation. Excess nationwide
generation for 2031 was calculated as the difference
between projected 2031 and existing 2016 generation.                2.3. Air quality modeling configuration
This additional generation was spatially apportioned                and analyses
across all states that had capacity increases in linear             This study adapted a 2016 CAMx air quality model-
proportion to each state’s contribution to the over-                ing platform from the Texas Commission on Envir-
all nationwide increase in capacity and then added to               onmental Quality [48] that was based on the U.S.
the state’s 2016 generation to estimate generation in               National Collaborative Emissions Modeling Platform

                                                      4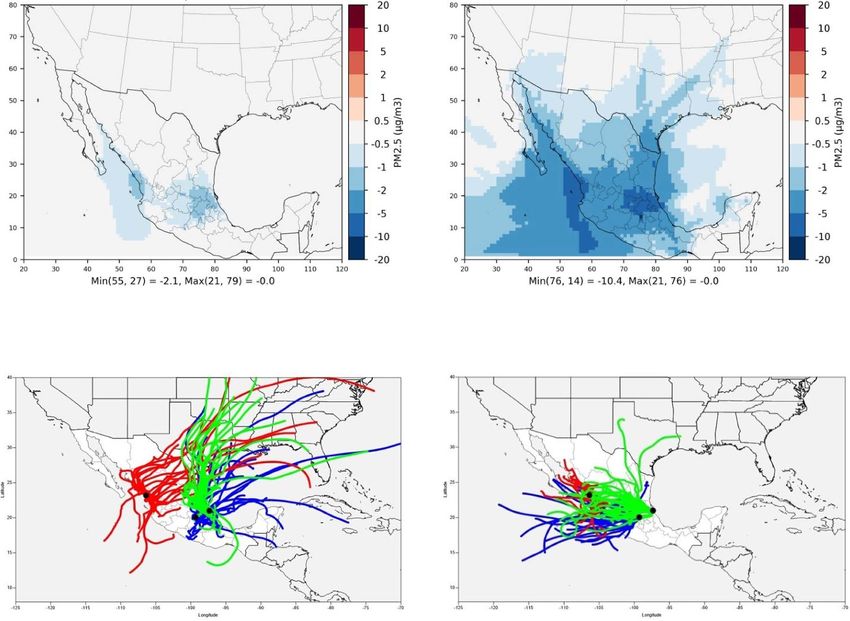
Environ. Res. Lett. 16 (2021) 074050                                                                       E C McDonald-Buller et al

   Figure 3. Annual 2016 and projected 2031 emissions (tons) of NOx , CO, SO2 , VOC, PM2.5 , and CO2 from conventional fossil fuel
   generation in Mexico by technology and fuel type.

[29]. The horizontal grid domain shown in figure                        CAMx simulations applied a zero-out emissions
S1 included most of Canada, the continental United                  approach to conventional fossil fuel plants collectively
States, and almost all of Mexico. The vertical grid                 as well as aggregated separately by fuel type in
structure included 29 vertical layers between 30.8 and              2016 to investigate the effects on maximum daily
17 800 m AGL. CAMx v.7 [49] was applied with                        average eight-hour (MDA8) ozone concentrations
meteorological fields from the Weather Research and                 and 24 h average PM2.5 concentrations in Mex-
Forecasting Model v.3.81 [50] over a time period                    ican and U.S. border states. An additional CAMx
spanning 15 December 2015–1 January 2017, which                     simulation was conducted with the 2031 emissions
included the model ‘spin up’ period. Boundary and                   estimates.
initial conditions were obtained using GEOS-Chem
version 11-02rc [51]. Carbon Bond version 6 revi-                   3. Results and discussion
sion 4 was applied as the gas-phase mechanism
[52–57]. The CF2 (coarse-fine) scheme with the                      3.1. Base year emissions profiles
SOAP2.2 [58] module for secondary organic aerosol                   Figure 3 summarizes nationwide emissions by tech-
chemistry/partitioning and ISORROPIA [59, 60] for                   nology and fuel in 2016. Annual emissions of NOx ,
partitioning of inorganic aerosol constituents were                 SO2 , and PM2.5 were approximately 527 000, 859 000
used as the aerosol chemistry options. A plume-in                   and 29 000 tons, and for CO2 were 138 million tons in
grid algorithm was applied for elevated point sources               2016. Emissions of CO and VOC were approximately
with NOx emissions of ⩾ 5.0 tons per day, which                     83 000 and 3200 tons, respectively. Contributions to
included 61 EGUs representing >90% of Mexico’s                      pollutant emissions from fossil fuel plants varied by
nationwide EGU NOx emissions.                                       technology and fuel. Figure 4 shows the spatial distri-
    The point source emissions inventories for Mex-                 butions NOx , SO2 , CO, VOC, CO2 , and PM2.5 emis-
ico’s electricity generation (NAICS 221110) and                     sions by fuel in 2016. Natural gas combined cycle
upstream and midstream oil and gas sectors (NAICS                   (44%), coal (36%) and fuel oil-fired (7%) thermo-
categories 211110 and 325110) were replaced with                    electric generation contributed 87% of NOx emis-
our emissions estimates. The 2016 and 2031 invent-                  sions. Natural gas combined cycle generation contrib-
ories were prepared for input to CAMx using version                 uted 49% of CO2 emissions followed by coal and fuel
3 of the Emissions Processing System (EPS3) [61] to                 oil-fired generation with 18% each; it accounted for
support atmospheric transport modeling.                             85% of CO emissions. The primary contributions to

                                                      5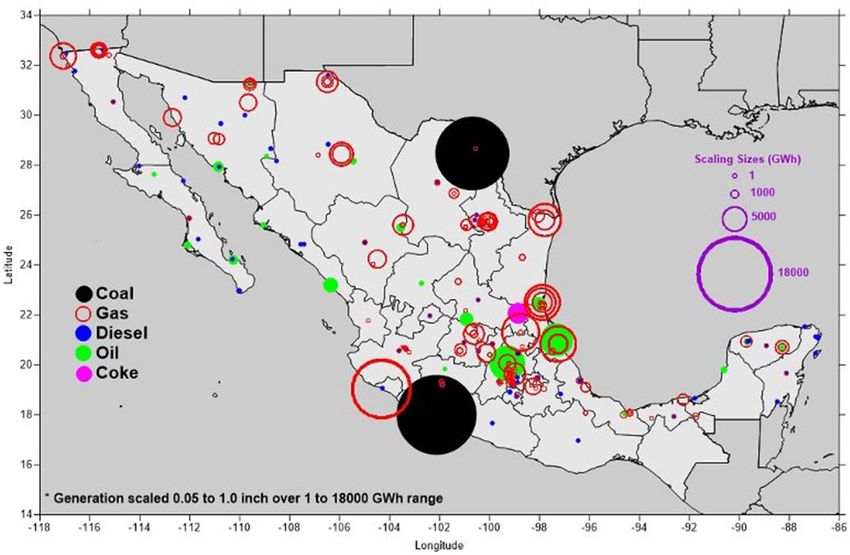
Environ. Res. Lett. 16 (2021) 074050 E C McDonald-Buller et al
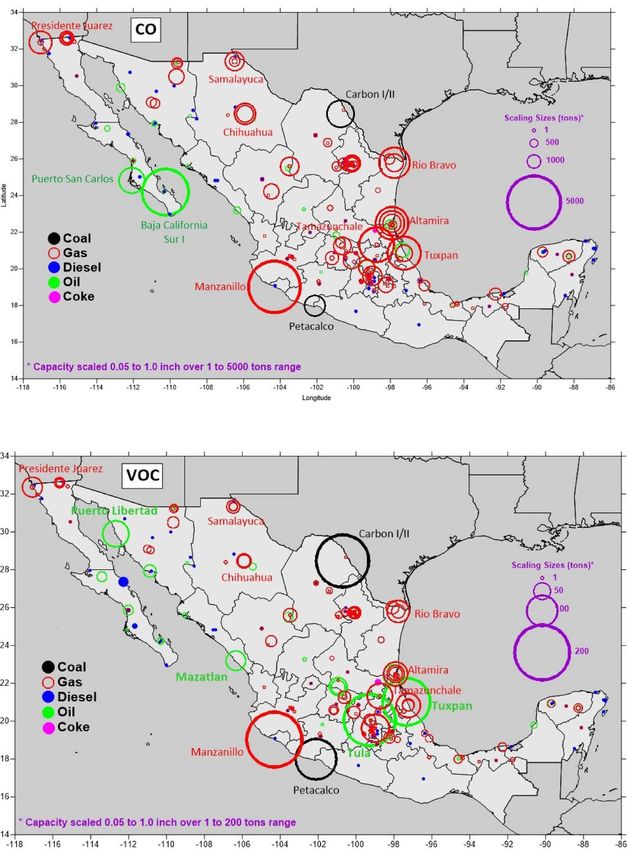
Figure 4. Spatial distributions of 2016 annual (a) NOx , (b) SO2 , (c) CO, (d) VOC, (e) CO2 , and (f) PM2.5 emissions (tons) by fuel
type from conventional fossil fuel generation in Mexico. Note differences in scales between plots and identification of selected
facilities with relatively higher emissions contributions.
6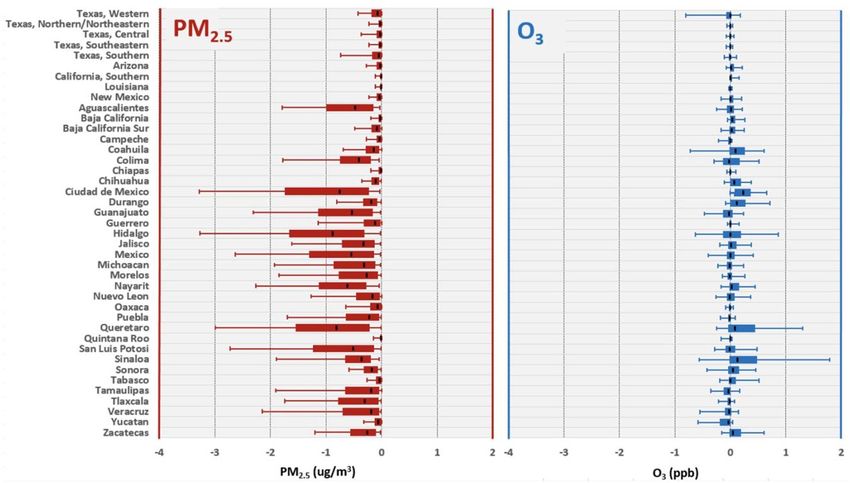
Environ. Res. Lett. 16 (2021) 074050                            E C McDonald-Buller et al

                                       Figure 4. (Continued.)

                                       7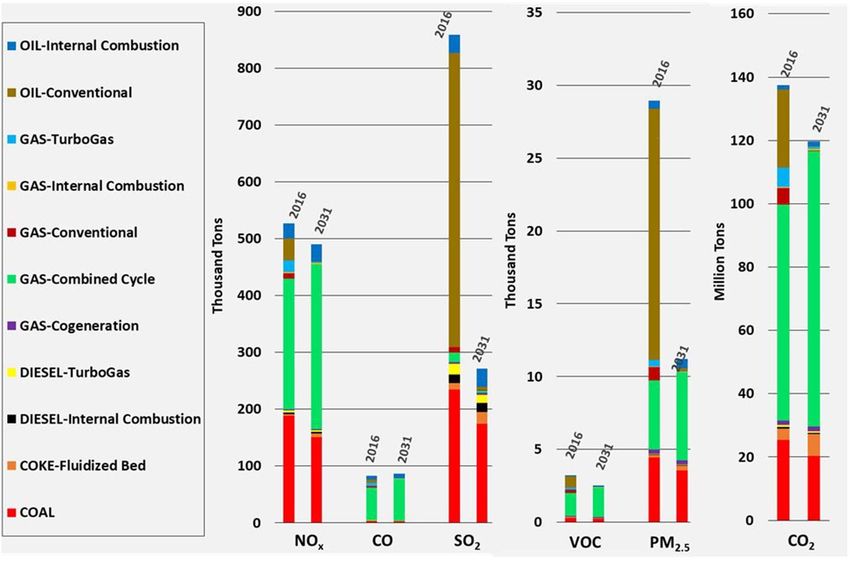
Environ. Res. Lett. 16 (2021) 074050                                                  E C McDonald-Buller et al

                                           Figure 4. (Continued.)

SO2 were from fuel oil-fired thermoelectric genera-    3.2. Fuel mix and generation in 2031
tion (60%), coal (27%), and internal combustion of     The PRODESEN 2017–2031 projected 16 GW of
fuel oil (5%). Fuel oil combustion dominated as a      retiring capacity and 56 GW of additional capacity
source of PM2.5 (62%) emissions, as Mexico’s three     by 2031, resulting in a net increase in capacity from
coal plants have electrostatic precipitators [62].     73 GW to 113 GW [39].

                                          8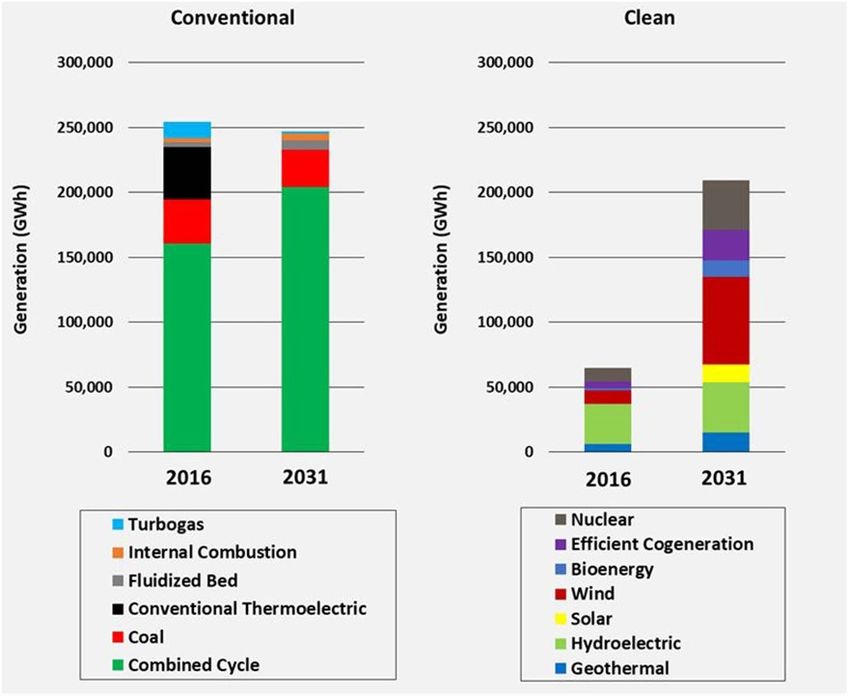
Environ. Res. Lett. 16 (2021) 074050                                                                           E C McDonald-Buller et al

   Figure 5. Annual differences in (a) MDA8 ozone and (b) 24 h average PM2.5 concentrations aggregated by region when emissions
   from coal, natural gas, and oil-fired generation are zeroed relative to the 2016 base case. Boxes show the median and interquartile
   range (25th and 75th percentiles). Left and right whiskers extend from the hinge to the 5th and 95th percentile values, respectively.

    Conventional thermoelectric plants accounted for                   retaining its importance in meeting Mexico’s elec-
11 GW of retiring capacity with additional retire-                     tricity demand but almost entirely through the use
ments from natural gas combined cycle and turbogas                     of natural gas combined cycle technology. Figures
capacity. Figure 1 compares nationwide 2016 genera-                    S2 and S3 show Mexican states and the locations of
tion in the PRODESEN 2017–2031 with our estimates                      statewide expansions and retirements of fossil fuel
of generation in 2031. Between 2016 and 2031, steep                    generation.
declines in installed capacity and generation from                         Installed capacity and generation from clean
Mexico’s fuel oil-fired conventional thermoelectric                    energy technologies approach those of conventional
facilities, turbogas, and coal plants occur in favor of                technologies by 2031. Among the states with marked
a buildout of natural gas combined cycle and clean                     increases in renewable generation (figure S3) are
energy technologies. Conventional fossil fuel gener-                   Tamaulipas, Nayarit, Veracruz, Oaxaca, Coahuila,
ation decreases by only 3% in 2031 relative to 2016,                   Chihuahua, San Luis Potosi, Jalisco, and Yucatan.

                                                        9
Environ. Res. Lett. 16 (2021) 074050 E C McDonald-Buller et al
Figure 6. Predicted annual average (left) and maximum differences (right) in MDA8 ozone concentrations by grid cell when
emissions from coal (a) and (b) and natural gas (c) and (d) generation are zeroed relative to the base case in 2016. Negative values
indicate reductions in concentrations relative to the base case and vice versa.
These areas are geographically coincident with high largest source of NOx and CO emissions in 2016; the
quality renewable resource, including wind and solar, shift toward its greater use as other fossil fuel genera-
availability [39]. tion is retired results in a decrease in NOx emissions
by 7% (37 000 tons) but a slight increase in CO by 4%
3.3. Emissions profiles in 2031 (3550 tons). The differential benefits of fuel switch-
Estimates of annual nationwide emissions during ing were also shown by Sosa et al [21] who found that
2016 and 2031 by technology and fuel are com- the use of natural gas instead of fuel oil at the Tula
pared in figure 3. Decreasing reliance on fuel oil- thermoelectric plant northwest of Mexico City would
fired thermoelectric and turbogas generation along lead to substantial reductions in SO2 and PM, but
with the retirement of the Carbón I coal plant near with no benefit for NOx and CO2 and increases in CO
the Texas-Mexico border drive reductions in emis- emissions.
sions but with variability in impacts between pol- The COPAR did not include information regard-
lutants. Total annual nationwide emissions of SO2 ing emission control devices with the reported plant-
and PM2.5 from Mexico’s electricity sector are estim- level emission factors. Natural gas combined cycle
ated to decrease by 68% (588 000 tons) and 61% plants included in the COPAR that were owned
(18 000 tons), respectively, and VOC emissions by by CFE began operation between 1971 and 2007
21% (700 tons). CO2 emissions decrease by 13% [63] and could represent different efficiencies. We
(18 million tons). Although retirement of approxim- assumed that emission rates for new natural gas com-
ately 2 GW of natural gas combined cycle capacity was bined cycle capacity and existing capacity in 2016 that
planned by 2031 from the Dos Bocas, Gómez Palacio, remains in operation through 2031 would be similar
Huinalá, and Valladolid Felipe Carrillo Puerto power to the median emission rates of CFE and PIE plants
stations that are among the oldest owned by CFE included in the COPAR. As such our findings are
[63], the buildout of new capacity to meet growth in based on a conservative scenario that could be influ-
demand moderated reductions of CO2 achieved from enced by the implementation of best available control
the fuel oil-fired thermoelectric and turbogas retire- technology requirements to achieve lower emissions
ments. Natural gas combined cycle generation was the for Mexico’s new capacity buildout.
10Environ. Res. Lett. 16 (2021) 074050 E C McDonald-Buller et al
Figure 7. Predicted annual (a) average and (b) maximum differences in 24 h average PM2.5 concentrations by grid cell when
emissions from oil-fired generation in Mexico are zeroed relative to the 2016 base case. Negative values indicate reductions in
concentrations relative to the base case and vice versa. Daily HYSPLIT forward trajectories initiated at the Tuxpan (green), Tula
(blue), and Mazatlan II (red) facilities are shown during (c) April and (d) July 2016.
3.4. Contributions to air quality in Mexican coal plant during March and September show sea-
and U.S. border states sonal differences in the spatial extent of downwind
Emissions from fossil fuel generation in Mexico influ- areas as the primarily south-southwesterly wind flow
ence air quality throughout the country as well as pattern in the spring shifts to south-southeasterly
in U.S. states such as Texas, New Mexico, and Ari- or easterly by the early fall. Contributions of nat-
zona and along the Gulf Coast. Figure 5(a) shows per- ural gas generation to MDA8 ozone concentrations
centile differences in predicted MDA8 ozone concen- were widespread due to its geographic distribution
trations from zeroing emissions from coal, natural throughout Mexico.
gas, and fuel oil-fired facilities, respectively, relative Fuel oil-fired facilities had the largest nation-
to the 2016 base case. Spatial patterns of predicted wide contributions to 24 h average PM2.5 concentra-
average and maximum differences in MDA8 ozone tions from Mexico’s electricity sector followed by coal
concentrations from coal and natural gas generation plants in 2016 (figure 5(b)). HYSPLIT forward tra-
are shown in figure 6. These indicate the relative con- jectories initiated at 500 m AGL at 1pm local time
tributions of generation by fuel type to air quality at three of Mexico’s largest oil-fired facilities, Tula,
but are not intended to represent specific emission Tuxpan, and Mazatlan II), in figure 7 highlight large
control strategies. Coal and natural gas generation differences in seasonal long-range transport patterns
had the largest contributions to MDA8 ozone con- across central and northern Mexico and the U.S. Gulf
centrations among all fuel types with the exception of Coast for April compared to July 2016.
fuel oil-fired generation in Baja California Sur. Emis- The changes in fuel mix and emissions between
sions from coal plants most frequently affected air 2016 and 2031 had differential benefits for achiev-
quality within the immediate area and neighboring ing reductions in MDA8 ozone and 24 h average
states downwind. These regions included Coahuila PM2.5 concentrations. Figure 8 indicates that reduc-
and western Texas from the Carbón I and II coal tions in MDA8 ozone concentrations in 2031 relat-
plants and Guerrero, Colima, Michoacán, Morelos, ive to the 2016 base case in Mexican and U.S. bor-
and México from the Petacalco plant. HYSPLIT for- der states were typically less than 0.5 ppb, as natural
ward trajectories shown in figure S4 initiated at each gas combined cycle generation remains a source of
11Environ. Res. Lett. 16 (2021) 074050 E C McDonald-Buller et al
Figure 8. Annual differences in 24 h average PM2.5 (left) and MDA8 (right) ozone concentrations aggregated by region between
2031 and 2016. Boxes show the median and interquartile range (25th and 75th percentiles). Left and right whiskers extend from
the hinge to the 5th and 95th percentiles, respectively.
NOx and CO emissions. Spatial shifts in NOx emis- mix that includes leveraging the enormous potential
sions can lead to localized differences in air quality for renewable energy generation. The total share of
benefits or near-source disbenefits (e.g. ‘hotspots’) clean energy generation has increased from 21.5% to
associated with NOx titration of ozone. In contrast, 27.5% between 2017 and 2020 [44] toward a target
the retirement of fuel oil-fired thermoelectric gener- of 30% by 2021. Hydroelectric power has been the
ation contributed to substantial reductions in 24 h largest source of renewable energy in Mexico and will
average PM2.5 concentrations by 2031. Reductions be integral to achieving Mexico’s clean energy targets.
in SO2 and PM2.5 emissions are maintained even National support could further promote the growth
with rising demand due to the shift in generation to of other renewable energy resources such as wind and
relatively lower-emitting natural gas combined cycle solar that to date have been developed almost entirely
generation. through private sector investment.
A future focus should be on harmonizing and
4. Conclusions reporting plant-level data for emission factors and
emission controls in Mexico. An on-going need is
Analysis of the PRODESEN 2017–2031 showed that the development of specific emission factors for Mex-
reductions in CO2 emissions and improvements in air ico and other countries as an alternative to the fre-
quality can be achieved while meeting rising electri- quent use of AP-42 factors that represent U.S. bench-
city demand in Mexico. However, the relative benefits marks. Over time emission factors should reflect
varied among criteria pollutants. In the PRODESEN changes in technology, fuel composition, and emis-
2017–2031 through 2020–2034, expansion of natural sions measurements and be developed with high spa-
gas combined cycle technology remains critical for tial and temporal granularity for atmospheric model-
meeting future demand. Although this is a key trans- ing to support air quality planning and management
ition from Mexico’s historical reliance on fuel oil and decisions.
coal, its expansion contributes to CO2 , NOx , and CO The methods of this study can be used to assess
emissions. Our analysis indicated that in contrast to how changes in infrastructure or policy initiatives
the declines in PM2.5 concentrations, MDA8 ozone affect emissions and air quality outcomes. In addi-
concentrations across Mexico experience little change tion to the attempt to alter the provisions of the 2014
between the 2016 and 2031scenarios. Buildout of nat- Electric Industry Law in March 2021, other indic-
ural gas combined cycle with lower emitting techno- ations of shifts in national priorities are a concern
logy and carbon capture could alter these outcomes. for Mexico’s electricity sector. Both the PRODESEN
Growth in the use of natural gas in Mexico has been 2019–2033 and 2020–2034 indicate no retirements
accompanied by increasing reliance on U.S. pipeline of conventional fossil fuel generation. In addition,
exports, which can be a source of methane emissions current national plans are to increase the output of
[64]. Mexico would benefit from a diverse energy existing state-owned Petróleos Mexicanos (Pemex)
12Environ. Res. Lett. 16 (2021) 074050 E C McDonald-Buller et al
refineries as well as to complete construction of a [2] Diario Oficial de la Federación 2014a Ley de la Comisión
new refinery in Tabasco [65]. Fuel oil for electri- Federal de Electricidad (available at:
www.diputados.gob.mx/LeyesBiblio/ref/lcfe/
city generation in Mexico has primarily been the sur-
LCFE_orig_11ago14.pdf) (Retrieved 1 February 2021)
plus from Pemex refineries. It currently has a higher [3] Diario Oficial de la Federación 2014b Ley de La Industria
sulfur content [66] than the 2020 limit of 0.5% for Eléctrica (available at: www.diputados.gob.mx/LeyesBiblio/
marine fuel by the International Maritime Organiz- pdf/LIElec_061120.pdf) (Retrieved 15 April 2021)
[4] Diario Oficial de la Federación 2015 Ley de Transición
ation [67]. Consequently, it cannot be supplied for
Energética (available at: www.gob.mx/cms/uploads/
shipping operations without sulfur mitigation. The attachment/file/112838/Ley_de_Transicion_
expectation would be continued or expanded use of Energetica.pdf) (Accessed 1 February 2021)
surplus fuel oil for electricity generation. This would [5] López-Velarde A 2019 New regulation for the power
generation and gas industries in Mexico: the possibilities for
reflect a path backwards for Mexico as it has sought
foreign investors Energy Law J. 40 87–110
to decrease the use of fuel oil over the past 15 years [6] Nance P 2018 Initial results from the Mexico electricity
and would have markedly different outcomes than the reform 2013–18 Mexico’s New Energy Reform ed D Wood
development pathway examined in this study. (Washington, DC: Wilson Center Mexico Institute)
pp 102–45
[7] KPMG Cardenas Dosal, S.C 2016 Opportunities in the
Data availability statement Mexican Electricity Sector (available at: https://assets.kpmg/
content/dam/kpmg/mx/pdf/2016/09/Opportunities-in-the-
The data that support the findings of this study are Mexican-Electricity-Sector.pdf) (Retrieved 13 January
available upon reasonable request from the authors. 2021)
[8] Diario Oficial de la Federación 2012 Ley General de Cambio
Climático (available at: www.diputados.gob.mx/LeyesBiblio/
Funding ref/lgcc/LGCC_orig_06jun12.pdf) (Retrieved 1 February
2021)
[9] International Renewable Energy Agency 2015 Renewable
Funding for this work was provided by the National energy prospects: Mexico (available at: www.irena.org//
Science Foundation (Grant #1638258). Funding was media/Files/IRENA/Agency/Publication/2015/
also provided by the Texas Air Quality Research Pro- IRENA_REmap_Mexico_report_2015.pdf) (Retrieved 22
January 2021)
gram (Project 19-023) at The University of Texas at [10] Ektria 2016 Clean energy certificates (CELs) (available at:
Austin through the Texas Emission Reduction Pro- https://ektria.com/wp-content/uploads/2016/06/
gram and the Texas Commission on Environmental EKT_CELs_VersionIngles_210616.pdf) (Retrieved 15
Quality. The findings, opinions and conclusions are January 2021)
[11] Del Razo C 2016 A snapshot of the Mexican clean energy
the work of the authors and do not necessarily repres- obligations system Mex. Law Rev. 9 81–90
ent findings, opinions, or conclusions of the AQRP or [12] Viscidi L 2018 Mexico’s renewable energy future Mexico’s
the TCEQ. New Energy Reform ed D Wood (Washington, DC: Wilson
Center Mexico Institute) pp 146–63
[13] Gross S 2019 AMLO Reverses Positive Trends in Mexico’s
Acknowledgments Energy Industry (www.brookings.edu/blog/order-from-
chaos/2019/12/20/amlo-reverses-positive-trends-in-
mexicos-energy-industry/) (Accessed 15 January 2020)
We thank Doug Boyer, Bright Dornblaser, Weining
[14] Diario Oficial de la Federación 2021 Decreto Por El Que Se
Zhao, and Khalid Al-Wali of the Texas Commission Reforman y Adicionan Diversas Disposiciones de la Ley de la
on Environmental Quality for their assistance with Industria Eléctrica (available at: http://dof.gob.mx/
the 2016 CAMx modeling platform. We also thank nota_detalle.php?codigo=5613245&fecha=09/03/2021-)
(Retrieved 31 March 2021)
Heather Simon and Madeleine Strum of the U.S. EPA
[15] Ramos A, De Brito De Gyarfas V, Martinez Rivas J M and
for assistance with the 2016v1 emissions platform. We Ramos C Mexico—court suspends amendment to the
express our appreciation to the anonymous reviewers Electricity Industry Law (available at:
for their insights and suggestions. www.mayerbrown.com/en/perspectives-events/publications/
2021/03/mexico-court-suspends-amendment-to-the-
electricity-industry-law) (Accessed 1 April 2021)
Conflict of interest [16] Ocampo O 2021 The Undoing of Mexico’s Competitive
Liberalization: The Electric Industry, Rule of Law and
The authors declare no conflict of interest. Investment (Washington, DC: Wilson Center Mexico
Institute)
[17] Berezowsky D, Gomez S N, Aranda A, D and Reyes
ORCID iD Retana R A Mexico: balancing remedies regarding the
reformed Electricity Industry Law The National Law Review,
Greg Yarwood https://orcid.org/0000-0002-4201- XI (12 March 2021) p 71
3649 [18] World Resources Institute 2021 Climate Watch Historical
GHG Emissions (www.climatewatchdata.org/ghg-emissions)
(Accessed 1 June 2021)
References [19] De Foy B, Krotkov N A, Bei N, Herndon S C, Huey L G,
Martínez A P, Ruiz- Suárez L G, Wood E C, Zavala M and
[1] International Energy Agency 2017 Energy policies beyond Molina L T 2009 Hit from both sides: tracking industrial and
IEA countries: Mexico 2017 (available at: www.iea.org/ volcanic plumes in Mexico City with surface measurements
reports/energy-policies-beyond-iea-countries-mexico-2017) and OMI SO2 retrievals during the MILAGRO field
(Retrieved 24 April 2018) campaign Atmos. Chem. Phys. 9 9599–617
13Environ. Res. Lett. 16 (2021) 074050 E C McDonald-Buller et al
[20] García-Escalante J S, García-Reynoso J A, Electricidad en México (available at: www.dof.gob.mx/
Jazcilevich-Diamant A and Ruiz-Suárez L G 2014 The nota_detalle.php?codigo=5282384%
influence of the Tula, Hidalgo complex on the air quality 26fecha=14/12/2012) (Retrieved 5 June 2021)
of the Mexico City Metropolitan Area Atmósfera [38] Comisión Federal de Electricidad 2015 COPAR 2015
27 215–25 Generación Edición 35 (available at: www.
[21] Rodolfo Sosa E et al 2020 Reduction of atmospheric cofemersimir.gob.mx/portales/resumen/45107) (Retrieved
emissions due to switching from fuel oil to natural gas at a 23 January 2019)
power plant in a critical area in Central Mexico J. Air Waste [39] Secretaría de Energía de México 2018 Programa de
Manage. Assoc. 70 1043–59 Desarrollo del Sistema Eléctrico Nacional 2017–2031
[22] Sosa G, Vega E, González-Avalos E, Mora V and (available at: https://base.energia.gob.mx/prodesen/
López-Veneroni D 2013 Air pollutant characterization in PRODESEN2017/PRODESEN-2017-2031.pdf) (Retrieved 29
Tula Industrial Corridor, Central Mexico, during the June 2018)
MILAGRO study Biomed. Res. Int. 2013 521728 [40] Secretaría de Energía de México 2016 Programa de
[23] López M T, Zuk M, Garibay V, Tzintzun G, Iniestra R and Desarrollo del Sistema Eléctrico Nacional 2015–2029
Fernández A 2005 Health impacts from power plant (available at: https://base.energia.gob.mx/prodesen/
emissions in Mexico Atmos. Environ. 39 1199–209 PRODESEN2015/PRODESEN_2015-2029.pdf) (Accessed 9
[24] Gohlke J M, Thomas R, Woodward A, June 2021)
Campbell-Lendrum D, Prüss-üstün A, Hales S and [41] Secretaría de Energía de México 2017 Programa de
Portier C J 2011 Environ. Health Perspect. 119 821–6 Desarrollo del Sistema Eléctrico Nacional 2016–2030
[25] Blackman A, Chandru S, Mendoza-Domínguez A and (available at: https://base.energia.gob.mx/prodesen/
Russell A G 2012 Health impacts of power-exporting plants PRODESEN2016/PRODESEN-2016-2030.pdf) (Retrieved 7
in Northern Mexico Resources for the Future, RFF DP September 2018)
11-18-REV (https://doi.org/10.1016/j.enpol.2011.12.055) [42] Secretaría de Energía de México 2019 Programa de
[26] Cory K n.d. Electricity strategies: long-term strategies Desarrollo del Sistema Eléctrico Nacional 2018–2032
(available at: www.wri.org/climate/expert-perspective/ (available at: https://base.energia.gob.mx/prodesen/
electricity-strategies-long-term-strategies) (Accessed 13 June PRODESEN2018/PRODESEN18.pdf) (Retrieved 9
2021) September 2019)
[27] Shearer C, Fofrich R and Davis S J 2017 Future CO2 [43] Secretaría de Energía de México 2020 Programa de
emissions and electricity generation from proposed Desarrollo del Sistema Eléctrico Nacional 2019–2033
coal-fired power plants in India Earth’s Future 5 408–16 (available at: www.gob.mx/sener/articulos/prodesen-2019-
[28] Alhajeri N S, Al-Fadhli F M and Aly A Z 2019 Unit-based 2033-221654) (Retrieved 7 September 2019)
emissions inventory for electric power systems in Kuwait: [44] Secretaría de Energía de México 2021 Programa de
current status and future predictions Sustainability 11 5758 Desarrollo del Sistema Eléctrico Nacional 2020–2034
[29] U.S. Environmental Protection Agency 2018 2016v1 (available at: https://www.gob.mx/sener/articulos/prodesen-
emissions modeling platform [Dataset] (available at: 2020-2034) (Retrieved 31 March 2021)
www.epa.gov/air-emissions-modeling/2016v1-platform) [45] International Energy Agency 2021 (Mexico) (available at:
(Retrieved 4 December 2018) www.iea.org/countries/mexico) (Accessed 16 June 2021)
[30] U.S. Environmental Protection Agency n.d. AP-42 [46] North American Cooperation on Energy Information 2018
compilation of emission factors [Dataset] (available at: North American infrastructure map, power plants 100MW
www.epa.gov/air-emissions-factors-and-quantification/ap- or more by energy source [Dataset] (available at: http://
42-compilation-air-emissions-factors) (Accessed 25 nacei.org/#!/maps) (Retrieved 9 January 2019)
February 2019) [47] Eastern Research Group 2014 Develop Mexico Future Year
[31] Commission for Environmental Cooperation of North Emissions Prepared for the U.S. Environmental Protection
America 2011 North American Power Plant Air Emissions Agency, EPA Contract No. EP-D-11-006, WA 4-09 (available
(www3.cec.org/islandora/en/item/10236-north-american- at: https://gaftp.epa.gov/Air/emismod/2016/beta/reports/
power-plant-air-emissions) (Retrieved 16 January 2020) Mexico_Emissions_WA%204-09_final_report_121814.pdf)
[32] Vijay S, Molina L T and Molina M J 2004 Estimating air (Retrieved 5 December 2018)
pollution emissions from fossil fuel use in the electricity [48] Texas Commission on Environmental Quality 2020 2021
sector in Mexico Prepared for the Secretariat of the regional haze state implementation plan revision Project No.
Commission for Environmental Cooperation (available at: 2019–112-SIP-NR (available at: www.tceq.texas.gov/assets/
www3.cec.org/islandora/fr/item/2166-estimating-air- public/implementation/air/sip/haze/2021RHSIPnota_
pollution-emissions-from-fossil-fuel-use-in-electricity- detallepro.pdf#page=92) (Retrieved 15 March 2021)
sector-in-en.pdf) (Retrieved 14 January 2020) [49] Ramboll 2020 User’s guide comprehensive air quality model
[33] Eastern Research Group, Inc. 2006 Mexico national with extensions version 7.00 (available at: www.camx.com)
emissions inventory, 1999 Prepared for the Secretariat of the (Retrieved 5 October 2020)
Environment and Natural Resources and the National [50] Peckham S E et al 2017 WRF-chem version 3.8.1 user’s guide
Institute of Ecology of Mexico (Sacramento, CA) (available NOAA Technical Memorandum OAR GSD-48 (available at:
at: http://sinea.semarnat.gob.mx/repositorio/1999_ http://doi.org/10.7289/V5/TM-OAR-GSD-48) (Retrieved 14
mexico_nei_final_report.pdf) (Retrieved 14 June 2021) March 2021)
[34] Tang L, Xiaoda X, Qu J, Mi Z, Bo X, Chang X, Wang S, Li S, [51] Electric Power Research Institute 2020 Regional haze
Cui W and Dong G 2020 Air pollution emissions from modeling to evaluate progress in improving visibility
Chinese power plants based on the continuous emission Product ID 3002016531 (available at: www.epri.com/
monitoring systems network Sci. Data 7 325 research/products/000000003002016531) (Retrieved 15
[35] Roy S, Fat Lam Y, Tho Hung N, Chan J C L and Fu J S 2021 March 2021)
Development of 2015 Vietnam emission inventory for power [52] Yarwood G, Jung J, Whitten G Z, Heo G, Mellberg J and
generation units Atmos. Environ. 247 118042 Estes M Updates to the carbon bond mechanism for version
[36] Kawashima A B, Martins L D, Abou Rafee S A, Rudke A P, De 6 (CB6) 9th Annual CMAS Conf. (Chapel Hill, NC, 11–13
Morais M V and Martin J A 2020 Development of a October 2010)
spatialized atmospheric emission inventory for the main [53] Yarwood G, Heo G, Carter W P L and Whitten G Z 2012
industrial sources in Brazil Environ. Sci. Pollut. Res. Environmental chamber experiments to evaluate NOx sinks
27 35941–51 and recycling in atmospheric chemical mechanisms Prepared
[37] Diario Oficial de la Federación 2012 Metodología Para for the Texas Air Quality Research Program, AQRP Project
Valorar Externalidades Asociadas Con La Generación de No. 10–042 (available at: http://aqrp.ceer.utexas.edu/
14Environ. Res. Lett. 16 (2021) 074050 E C McDonald-Buller et al
projectinfo/10-042/10-042%20Final%20Report.pdf) multicomponent inorganic aerosols Aquat. Geochem.
(Retrieved 14 March 2021) 4 123–52
[54] Yarwood G, Sakulyanontvittaya T, Nopmongcol U and [60] Nenes A, Pilinis C and Pandis S N 1999 Continued
Koo B 2014 Ozone depletion by bromine and iodine over the development and testing of a new thermodynamic aerosol
Gulf of Mexico Prepared for the Texas Commission on module for urban and regional air quality models Atmos.
Environmental Quality (available at: www.tceq.texas.gov/ Environ. 33 1553–60
assets/public/implementation/air/am/contracts/reports/pm/ [61] Ramboll Environ 2015 EPS3 user’s guide emissions
5821110365FY1412-20141109-environ-bromine.pdf) processor version 3.22 (available at: ftp://
(Retrieved 15 March 2021) amdaftp.tceq.texas.gov/EI/EPS3/
[55] Hildebrandt Ruiz L H and Yarwood G 2013 Interactions EPS3_UserGuide_201507.pdf) (Retrieved 14 March 2021)
between organic aerosol and NOy: influence on oxidant [62] Comisíon Federal de Electricidad 2016 Guía Para Elaborar El
production Prepared for the Texas Air Quality Research Inventario De Emisiones De Gases Por La Operación De
Program, AQRP Project No. 12–012 (available at: http:// Centrales De Generación Que Consumen Combustibles Fósiles
aqrp.ceer.utexas.edu/projectinfoFY12_13/12-012/12- CFE SPA00-55 (available at: https://lapem.cfe.gob.mx/
012%20Final%20Report.pdf) (Retrieved 15 March 2021) normas/pdfs/v/SPA00-55.pdf) (Retrieved 31 May 2021)
[56] Emery C, Jung J, Koo B and Yarwood G 2015 Improvements [63] Comisíon Federal de Electricidad n.d. Ciclo Combinado
to CAMx snow cover treatments and carbon bond chemical (available at: www.cfe.gob.mx/QuienesSomos/estadisticas/
mechanism for winter ozone Prepared for the Utah listadocentralesgeneradoras/Paginas/Ciclocombinado.aspx)
Department of Environmental Quality, Division of Air (Retrieved 17 June 2021)
Quality, UDAQ PO 480 52000000001 (available at: [64] Weller Z D, Hamburg S P and Von Fischer J C 2020 A
www.camx.com/files/udaq_snowchem_final_6aug15.pdf) national estimate of methane leakage from pipeline mains in
(Retrieved 15 March 2021) natural gas local distribution systems Environ. Sci. Technol.
[57] Emery C, Liu Z, Koo B and Yarwood G 2016 Improved 54 8958–67
halogen chemistry for CAMx modeling Prepared for the [65] Petróleos Mexicanos 2018 The National Refining Plan
Texas Commission on Environmental Quality, Work Order (available at: www.pemex.com/en/press_room/
No. 582-16-61842-13, Contract No. 582-15-50417, Tracking press_releases/Paginas/2018-093-national.aspx) (Accessed 1
No. 2016–17 (available at: www.tceq.texas.gov/assets/public/ April 2021)
implementation/air/am/contracts/reports/pm/5821661842- [66] Lipow A 2019 Fuels in Mexico (IHS Markit)2 4–9 (http://
FY1613-20160526-environ-CAMx_Halogens.pdf) info.opisnet.com/hubfs/Product%20Campaigns/Mexico/
(Retrieved 15 March 2021) Fuels%20in%20Mexico/2019/
[58] Strader R, Lurmann F and Pandis S N 1999 Evaluation of CombustiblesenMexico_Vol2_Iss2.pdf)
secondary organic aerosol formation in winter Atmos. [67] International Maritime Organization n.d. IMO
Environ. 33 4849–63 2020—cutting sulphur oxide emissions (available at:
[59] Nenes A, Pilinis C and Pandis S N 1998 ISORROPIA: www.imo.org/en/MediaCentre/HotTopics/Pages/Sulphur-
a new thermodynamic model for multiphase 2020.aspx) (Retrieved 1 April 2021)
15You can also read