Coal Outlook 2019 Domestic Market Decline Continues - ieefa
←
→
Page content transcription
If your browser does not render page correctly, please read the page content below
Dennis Wamsted, IEEFA Research Analyst 1
Seth Feaster, IEEFA Data Analyst
David Schlissel, IEEFA Director of Resource Planning Analysis
March 2019
Coal Outlook 2019
Domestic Market Decline Continues
Executive Summary
The long-term structural decline of the U.S. coal industry continued in 2018, with a
record total of coal generation capacity retired and a further drop in utility coal
consumption to levels not seen since the early 1980s.1
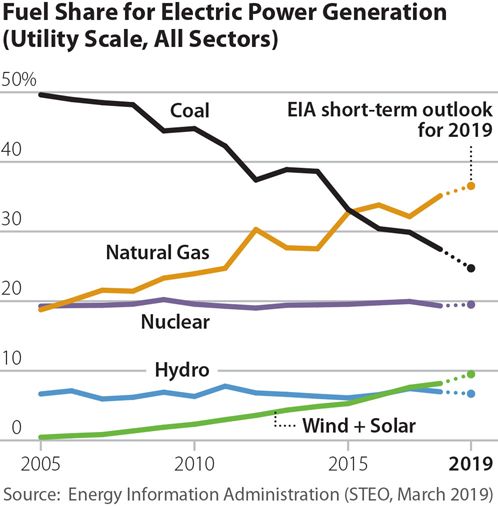
This year, the outlook is worse,
with the latest forecast from the
Energy Information
Administration (EIA) projecting
that coal’s share of the electric
generation sector will drop below
25%, the lowest level since 1949.2
We believe the EIA could even be
understating the decline. We
expect the erosion of the utility
market for coal to accelerate
through 2019 and into the coming
decade due to a combination of
factors that have fundamentally
changed the domestic electricity
generation sector, the prime
market for the U.S. coal industry.
These factors include:
The fracking revolution, which has turned natural gas from a premium fuel
into a readily available, low-cost baseload generation resource;
Persistent cost declines in the renewable energy industry, particularly in
wind and solar, a trend that has resulted in clean, reliable alternatives to
coal;
The aging of the coal fleet, which has significant negative impacts on
operating performance and costs;
1EIA. Monthly Energy Review data browser. Accessed March 18, 2019.
2S&P Global Market Intelligence. EIA expects coal-fired share of power generation to fall below
25% in 2019. March 13, 2019.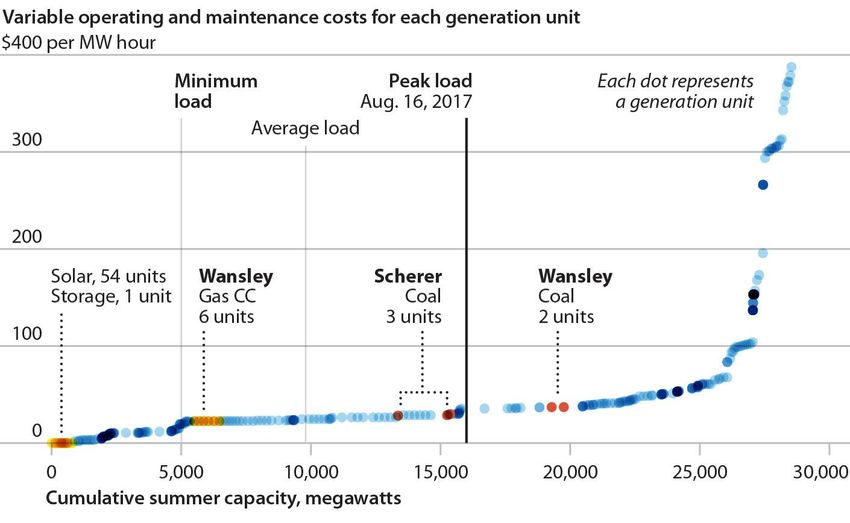
Coal Outlook 2019:
Domestic Market Decline Continues 2
Significant changes in grid operations, driven by the three factors above,
which continue to reduce the importance of coal generation;
Growing utility sector interest in, and planning for, coal generation phase-
outs;
Rising corporate interest in greener energy resources and sustainable
development practices; and
Growing concern about climate risk and carbon dioxide emissions.
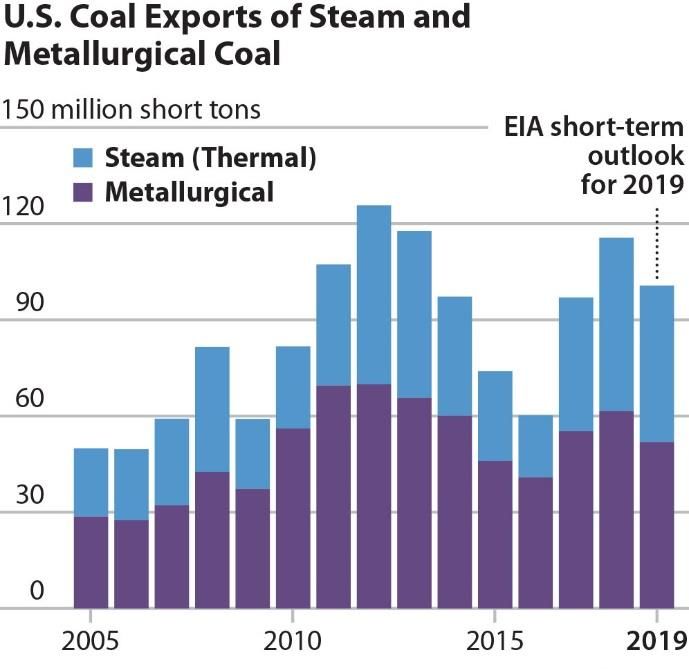
The only piece of good news for the coal industry in 2018 was the significant growth
in coal exports, a development that we missed in our outlook last year. For 2018,
exports totalled 115.6 million tons, a sharp increase from 2017, but still below past
record levels. We also believe it likely represents a high-water mark for U.S.
exporters, who have traditionally been swing suppliers in the global market.
Last year, we concluded that coal would
continue to lose market share in electricity
generation. This year, we expect that erosion to Market forces are
speed up, pushed by the record amount of coal driving the transition
capacity retired last year, projections of
continued retirements this year and beyond,
from coal towards
and significant changes in grid operations that cleaner fuels.
favor renewable energy and natural gas over
coal.
Coal industry executives and the sector’s backers have grasped for bits of good news
for years, echoing the refrain that “eventually things are going to turn around.”3
We disagree, and find that a careful look at the data, the number of plant closures,
the sharp decline in domestic consumption and stagnation in electricity demand, as
well as the mediocre stock performance of the coal industry can lead only to one
conclusion: there will be no turnaround for coal. We believe that market forces are
driving a transition away from coal toward cleaner fuels, and that this transition is
gaining momentum.
3 New York Times. Coal Production Plummets to Lowest Level in 35 Years. June 10, 2016.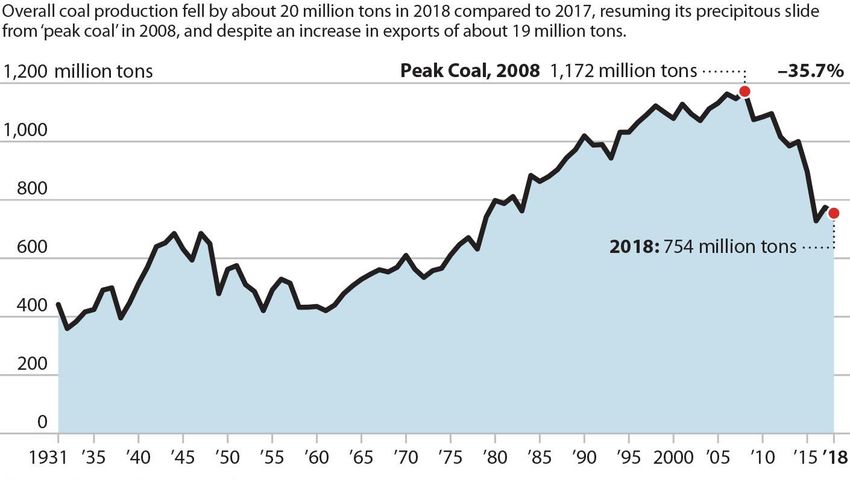
Coal Outlook 2019:
Domestic Market Decline Continues                                                                                                                              3

 Table of Contents
 Executive Summary .............................................................................................................................. 1
 Consumption and Production Overview ...................................................................................... 5
 2019 Trends and Beyond ................................................................................................................... 8
       Coal Plant Retirements ................................................................................................................ 8
       The Tell-Tale Story Told by Plant Capacity Factors ......................................................... 9
 The Plant Wansley Example ........................................................................................................... 10
       What This Means for Coal Consumption ........................................................................... 11
       The Impact of Price..................................................................................................................... 12
       Renewable Energy’s Impact on the Generation Supply Curve ................................. 18
       More Wind and Solar Are On the Way in 2019 ............................................................... 20
       The Absence of Demand Growth .......................................................................................... 20
       The Game-Changing Impact of Storage .............................................................................. 21
       The Push for Clean Energy: From Utilities, Businesses and Consumers .............. 23
 Coal Company Finances ................................................................................................................... 25
       Coal Exports................................................................................................................................... 27
 Conclusion ............................................................................................................................................. 29
 About the Authors .............................................................................................................................. 30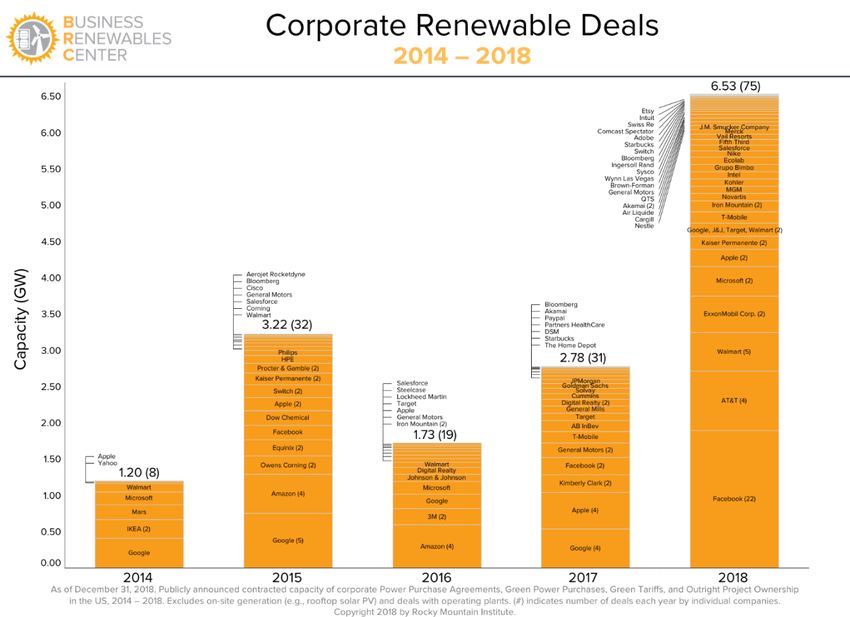
Coal Outlook 2019:
Domestic Market Decline Continues                                                                                                 4

 Table of Figures
 Figure 1: Coal Consumption for Electricity Generation, 2005-2019 ................................ 5
 Figure 2: Total U.S. Coal Production, 1931-2018 ..................................................................... 7
 Figure 3: Regional U.S. Coal Production, 1985-2018 .............................................................. 7
 Figure 4: Coal-Fired Electric Generation Retirements and Conversions........................ 8
 Figure 5: Capacity Factors at the Wansley Coal and Combined Cycle Plants............. 11
 Figure 6: Natural Gas Trading Hub Price Estimates, 2019-2025.................................... 13
 Figure 7: Rising Output from Wind and Solar Generation................................................. 14
 Figure 8: Wind and Solar Share of U.S. Generation, All Sectors ....................................... 14
 Figure 9: Installed Wind Capacity in the Competitive ISOs............................................... 15
 Figure 10: Wind Generation Market Share in the Competitive ISOs ............................. 16
 Figure 11: Coal Generation in the Competitive ISOs ............................................................ 17
 Figure 12: Coal Generation Market Share in the Competitive ISOs ............................... 18
 Figure 13: Georgia Power's Generation Supply Curve ........................................................ 19
 Figure 14: U.S. Electricity Sales Have Flat-Lined ................................................................... 21
 Figure 15: Rising Number of Companies Signing Green Energy Deals......................... 25
 Figure 16: Variability of U.S. Coal Exports................................................................................ 28
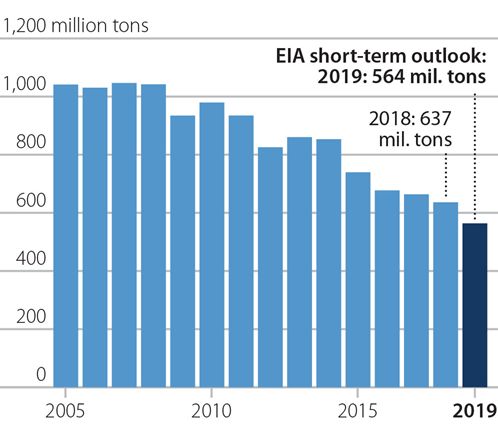
Coal Outlook 2019:
Domestic Market Decline Continues                                                              5

Consumption and Production Overview
We expect the structural decline in the coal industry that began a decade ago to
continue in 2019 and beyond.

Total coal consumption in the U.S. fell to 688 million tons (MT) in 2018, dropping
below the 700-million-ton level for the first time in 40 years4. The 2018 decline,
which saw consumption drop 4% from 716.9 MT in 2017, continues the trend that
began in 2007, when total consumption peaked at 1,128 MT.5 It can be traced to
declining demand in the U.S. utility sector, the predominant market for U.S. coal.
According to EIA statistics, the electric power sector accounted for 93% of total
demand for coal from 2007-2018.6

Figure 1: Coal Consumption for Electricity Generation, 2005-2019

Source: Energy Information Administration (STEO, March 2019).

As the above graph indicates, 2019 is shaping up to be another year of declining
demand for coal, with the EIA projecting that U.S. generators will use less than 600
MT of coal for electricity generation—a consumption level last seen in 1982.7
Specifically, EIA’s Short-Term Energy Outlook data browser estimates that utility

4 EIA. Monthly Energy Review data browser, last accessed March 18, 2019.
5 Ibid.
6 EIA. Today in Energy, U.S. coal consumption in 2018 expected to be the lowest in 39 years.

December 28, 2018.
7 EIA. Total Energy.
Coal Outlook 2019:
Domestic Market Decline Continues 6
sector coal consumption will fall to 563.9 million tons this year, a decline of 72.6 MT,
or 13%, from 2018.8
While this decline is significant, we believe it is well within the bounds of probability
and could even fall more given the amount of coal-fired capacity retired last year,
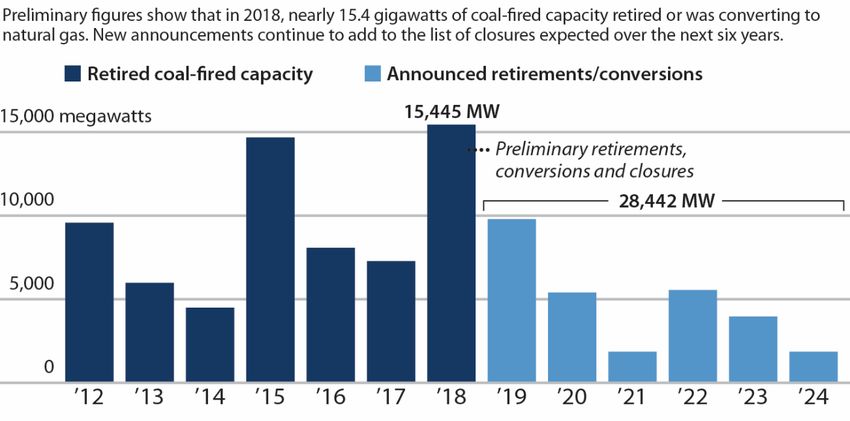
coupled with expectations of more closures going forward. According to IEEFA data,
the industry shuttered (or converted to natural gas) a record-setting 15.4 gigawatts
(GW) of generating capacity in 2018, and 2019 is already shaping up to be another
important year for coal plant retirements, with almost 10GW of planned closures
announced through the end of February.9
In addition to the capacity being retired, the
decline in coal consumption can be traced to
structural changes that are occurring in the
utility industry, changes that will continue to
push down demand for coal. For starters, the The decline in coal
continued buildout of highly efficient natural consumption is rooted in
gas combined cycle (NGCC) generation has
fundamentally changed market operations in structural changes in the
the utility sector to coal’s lasting detriment, as utility industry.
will be discussed below. In 2018, for the first
time, natural gas combined cycle (NGCC)
operating capacity exceeded that of coal, 263
gigawatts to 243 GW,10 with the two sectors
trending in opposite directions.
Similarly, continuing improvements in the performance and cost of renewable
energy alternatives, particularly wind and solar, have introduced price competition
that coal cannot match, which we also will address in greater detail below.
This decade-long transition can be traced to a number of interlocking developments
that have worked together to undermine coal’s economic competitiveness:
The fracking revolution that has brought ample supplies of relatively low-
cost natural gas to the domestic market, with the expectation that supplies
will remain readily available and prices stable;
The commercialization of renewable energy resources at steadily falling
prices; and
The growing willingness (and in many cases, eagerness) of utilities to
consider alternatives to traditional coal generation options.
8 Coal information in the EIA Short-Term Energy Outlook data browser goes back to 1997;
numbers in the Monthly Energy Review data browser go back to 1949. When using either site, the
coal information is in chapter or section 6; users can view/download standardized tables or
create their own. The STEO link. The Monthly Energy Review link.
9 IEEFA tallies coal plant retirement data using information reported to EIA, company press
releases and financial filings, and utility correspondence with transmission operators.
10 EIA. Electric Power Monthly. Table 6.1. February 2018 and February 2019 editions.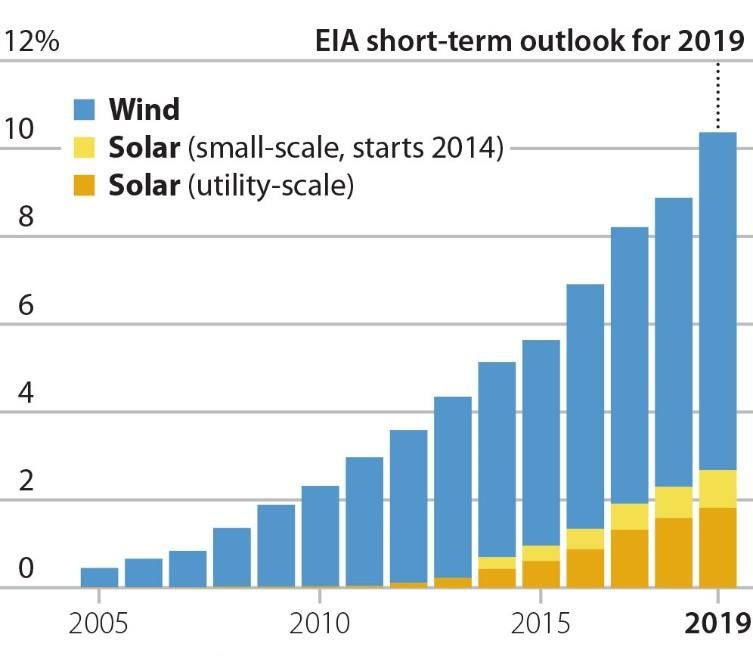
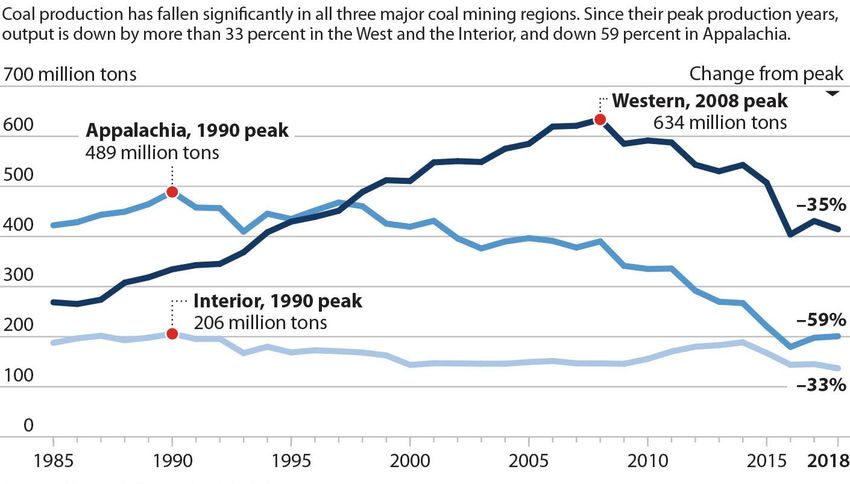
Coal Outlook 2019:
Domestic Market Decline Continues                                             7

Figure 2: Total U.S. Coal Production, 1931-2018

Source: Energy Information Administration (EIA).

The following graph breaks down the total by region, demonstrating that the
industry’s erosion is nationwide in scope.

Figure 3: Regional U.S. Coal Production, 1985-2018

Source: EIA.
Coal Outlook 2019:
Domestic Market Decline Continues                                                         8

2019 Trends and Beyond
Coal Plant Retirements
Since 2011, when installed coal capacity in the U.S. peaked at 318GW11, 75GW of
capacity have been retired, 23.5% of the total. According to our analysis, more than
15.4GW were retired in 2018, slightly above the earlier record of just under 15GW
in 2015, the year the U.S. Environmental Protection Agency’s (EPA’s) mercury
emissions regulation took effect.

We do not expect retirement levels in 2019 to be quite that high, but they will still
be considerable. IEEFA estimates that roughly 10GW of capacity will be taken offline
this year and that at least an additional 18GW will retire in the five years from 2020-
2024 (see figure below).

Figure 4: Coal-Fired Electric Generation Retirements and Conversions

As of March 12, 2019. Sources: EIA; PJM; S&P Global; IEEFA research (2017-2024).

While the graph above tells a compelling story regarding the total capacity of recent
coal plant retirements, it almost certainly understates the amount of capacity that
will be retired in the next six years. For example, in our 2018 report released last
February,12 we estimated that roughly 4 GW of coal-fired capacity would be retired
in 2019. That figure has shot upward over the past year and now is nearing 10 GW,
which would put it on pace to be the third-highest total for coal plant retirements
ever. And more announcements could be on the way, as the sector’s worsening
economics continue to force utility decision-makers to move ahead with closures.

Already this year, Georgia Power has formally asked state regulators to approve the
immediate closure of 982.5 MW of coal-fired capacity at its Hammond and McIntosh

11   EIA electricity data.
12   IEEFA. U.S. Coal: More Market Erosion is on the Way. February 2018.
Coal Outlook 2019:
Domestic Market Decline Continues                                                                  9

plants,13 and Alabama Power has announced plans to close its three-unit, 1,062MW
Gorgas plant in April.14

Going forward, we expect similar announcements of near-term closures to raise the
retirement totals from 2020-2024. So far this year, the Tennessee Valley Authority
(TVA) and the Montana-Dakota Utilities have both announced plans to close coal-
fired capacity in the next few years that had not previously been scheduled.

The Tell-Tale Story Told by Plant Capacity Factors
Since the fracking boom began in 2008, expanding natural gas supplies and sharply
cutting prices, highly efficient NGCC generation units have been pulling market
share away from coal.15 In 2008, EIA data showed that the average annual capacity
factor for U.S. combined-cycle natural gas generators was 40.1%, compared to
73.4% for coal-fired generators. The annual average capacity factor for gas
generation has been rising steadily from 39.8% in 2009 to more than 50% since
2015, averaging 57.6% in 2018.16

Meanwhile, U.S. coal plant capacity factors have been dropping. The average
capacity factor for all coal-fired generators fell below the 70% level in 2009 and
dropped below 60% in 2012. It has trended slowly downward ever since and has
hovered around 54% for the past four years.17 It is important to point out here that
this decline has occurred even as 75GW of coal-fired capacity were closed from
2011-2018, much of it older and operated only occasionally. All else being equal,
those retirements should have improved the average coal-fleet capacity factor, but
that proved not to be the case.

In truth, those retirements may mask a much larger transition under way in the
generation sector, where natural gas combined cycle units have become the new
baseload go-to capacity resource, while coal is being relegated to daily and seasonal
load following operations, significantly reducing overall capacity factors and coal
demand. IEEFA has examined the capacity factor over time of the nation’s largest
coal-fired power plants; the units that previously had provided much of U.S.
baseload electricity generation. The results were eye opening.

Focusing on the 50 largest U.S. coal plants, which together have an installed capacity
of just under 104GW, we found that all but two posted a lower capacity factor in
2017 when compared to the plants’ average from 2007-2017.18 Twenty-two of the
50 recorded a capacity factor in 2017 that was 20% or more lower than the
previous 10-year average, while the capacity factor at an additional eight plants fell
by more than 15%. In other words, the capacity factor at 60% of the nation’s largest

13 Rome News Tribune. Georgia Power submits plan to close Plant Hammond. January 31, 2019.
14 Daily Mountain Eagle. Gorgas plant closing April 15 after 102 years. February 21, 2019.
15 EIA. Electric Power Annual. Tables 4.7.A and 4.7.C.
16 EIA. Electric Power Monthly. Table 6.7.B.
17 Ibid.
18 Information on plant size and capacity factor was gathered from EIA and S&P data; analysis by

IEEFA.
Coal Outlook 2019:
Domestic Market Decline Continues                                                                 10

coal-fired units fell by at least 15% in 2017 compared to those units’ 10-year
average.

Another way of looking at this data is to pull out the highest performers. In 2007,
only 8 of the 48 operating units (two of the current top 50, Oak Grove and Prairie
State, had not yet entered commercial service in 2007) posted a capacity factor of
less than 70%. In contrast, in 2017, only 10 of the 50 posted a capacity factor of
more than 70%. Equally telling, in 2007, only one of these plants had a capacity
factor of less than 60%; by 2017, 12 of them operated at less than 40%.19

The Plant Wansley Example
The Plant Wansley complex 60 miles southwest of Atlanta illustrates this trend.
Wansley includes two supercritical coal-fired units owned by Southern Co.
subsidiary Georgia Power that entered commercial service in 1976 and 1978. The
two units have identical net summer capacity ratings of 872 megawatts (MW). The
complex also includes two combined cycle natural gas units owned by Southern that
came online in 2002 and have a combined summer capacity of 1,150 MW.20

The chart below shows capacity factors for the coal and combined cycle units at
Wansley since the gas units came into service. From 2004 to 2008, Wansley’s coal
units operated at a capacity factor of near or above 80%, while the gas units
operated at less than 30% of capacity. Gas price declines and revised perceptions
about long-term stable supplies that have taken hold since 2008 have turned the
equation upside down. Since 2014, the gas-fired units have posted an average
capacity factor of slightly less than 65%, and for the past two years have been well
above 80%. The coal-fired units at Wansley have operated at or below 30% of
capacity since 2013 and fell below 20% in 2018. While the graphic is specific to
Wansley, similar changes have occurred across the utility industry.

19 The capacity factor information is drawn from the S&P Global Market Intelligence website
using EIA data.
20 See also IEEFA analysis: IEEFA Georgia: The Diminishing Importance of Coal-Fired Generation.

December 14, 2018.
Coal Outlook 2019:
Domestic Market Decline Continues                                                                11

Figure 5: Capacity Factors at the Wansley Coal and Combined Cycle
Plants

Source: IEEFA analysis, S&P data.

What This Means for Coal Consumption
These declining capacity factors
have had a major impact on coal
consumption. Looking at the top 50             These declining capacity factors
units discussed above, IEEFA found
that their coal consumption fell by             have had a major impact on
almost 92 million tons from 2007-                    coal consumption.
2017, dropping from 353.3 million
tons to 261.4 million tons, a decline
of 26%.21

At Georgia Power’s Wansley plant, the nation’s 30th largest coal plant by capacity,
the decline has been even more dramatic. Coal consumption at Wansley totalled
4.88 million tons in 2007 and tumbled to 1.61 million tons in 2018, a 67% decline.

Another example of this new normal is Duke Energy’s massive Roxboro coal plant in
North Carolina.22 At 2,462 MW of capacity, the four-unit plant is the 12th largest
operating coal facility in the country. Generation at Roxboro has been dropping
steadily since 2014 and totalled only about 6 million megawatt-hours (MWh)

21Based on EIA and S&P data; analysis by IEEFA.
22See IEEFA analysis: IEEFA U.S.: Two Duke Plants in North Carolina Indicate Baseload Slippage
for Coal. October 29, 2018.
Coal Outlook 2019:
Domestic Market Decline Continues                                                           12

annually in 2017 and 2018, well under half the plant’s average generation from
2007-2014 of more than 13.8 million MWh annually. Coal consumption at the plant
has dropped as well, falling from an average of 5.8 million tons annually from 2007-
2014 to 2.4 million tons in 2017 and 2018, a 59% decline.23

The reason for the decline at Roxboro is similar to Georgia Power’s Wansley plant:
Natural gas combined cycle units that now operate primarily in baseload mode are
taking generation away from existing coal plants. Duke has brought two large NGCC
units into operation in North Carolina since 2012 and a third is due in service this
year. In addition, a growing amount of solar PV capacity, which comes to the market
with no variable costs and is dispatched first when available (more on this issue
below), is being brought online in the Southeast.

Until 2011, for example, North Carolina essentially had no installed solar generating
capacity; It now exceeds 5.2GW and is climbing.24 The Solar Energy Industries
Association projects the solar capacity total in North Carolina will increase by an
additional 3,939 MW, over the next five years.

While IEEFA has focused on the top 50 plants for detailed review, it is clear that
market erosion caused by natural gas and renewable energy is affecting coal-fired
plants of all sizes. For example, Duke’s Mayo plant, a single 746MW generator that is
newer than all four of the Roxboro units, has suffered a similar decline in production
in past two years, with output dropping from 2.9 million MWh in 2015 to less than
1.5 million MWh in 2017 and 2018 and coal burn dropping from 1.2 million tons to
an average of 680,000 tons.

We believe this is the new operating paradigm for many U.S. coal generation units,
even the largest plants. IEEFA does not expect these units to recover this lost market
share given expectations of continued long-term availability of relatively low-cost
natural gas supplies and the steady decline in costs of wind, solar and energy
storage. It is increasingly clear that the market for coal has shrunk permanently, and
we believe it will continue to decline in the years ahead as additional renewable
generation enters the market.

The Impact of Price
Another problem facing the coal industry is the lack of response to the relatively
high natural gas prices of 2018, both compared to coal and to prior years. For the
year, the price paid by U.S. utilities for natural gas averaged $3.42 per million British
thermal units (mmBtu).25 This was up from 2017 and significantly higher than 2016,
a development that, according to conventional wisdom, should have prompted fuel
switching away from gas to coal. But that did not happen. For the year, total
electricity generation rose 3.6% and coal-fired production fell 4.9%.26 Perhaps more
worrisome for the coal industry, EIA’s March 2019 Short-Term Energy Outlook
projects a decline in natural gas prices for utility generation over the next two years.

23 IEEFA calculations using EIA and S&P data.
24 Solar Energy Industries Association (SEIA). Top Ten Solar States. 2018 Q4.
25 EIA. Short-Term Energy Outlook data browser. Accessed March 15, 2018.
26 EIA. Electric Power Monthly. February 2019.
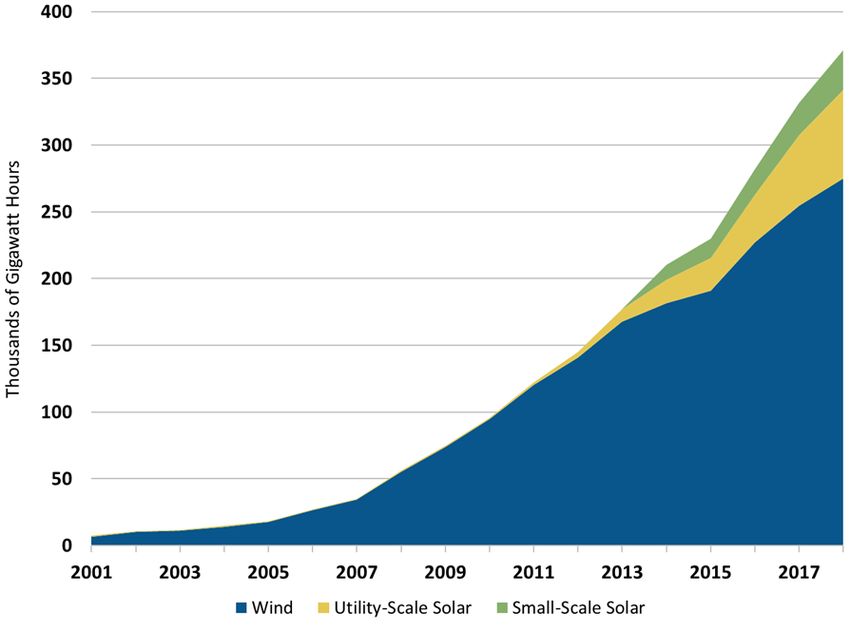
Coal Outlook 2019:
Domestic Market Decline Continues                                                                13

Looking further ahead, the figure below shows current market expectations at the
major trading hubs project natural gas prices through 2025 as remaining below last
year’s level.

Figure 6: Natural Gas Trading Hub Price Estimates, 2019-2025

Source: OTC Global Holdings, forward prices as of January 24, 2019, downloaded from S&P Global
Market Intelligence.

It is not only low natural gas prices that are hammering the coal industry. The sharp
increase in the amount of installed renewable energy capacity, particularly wind
and solar which have no fuel costs, is changing the structure of electricity generation
across the country, with clear and ongoing negative impacts on coal consumption.

As of the end of 2018, the U.S. had 96.48 GW of wind capacity and 62.4 GW of solar
capacity installed. All told, utility-scale wind and solar generated 341.55 terawatt-
hours of electricity, up 11% from the year before and accounting for just under 9%
of the national power supply. The two figures below chart this steep rise, first by
gigawatt-hours of generation and second by percentage of the total U.S. electricity
market; they also incorporate data from small-scale generation, particularly
residential and commercial rooftop installations.
Coal Outlook 2019:
Domestic Market Decline Continues                                14

Figure 7: Rising Output from Wind and Solar Generation

Source: EIA data.

Figure 8: Wind and Solar Share of U.S. Generation, All Sectors

Source: EIA (STEO, March 2019).
Coal Outlook 2019:
Domestic Market Decline Continues                                                      15

Another way of viewing this data—one that leads to a clearer understanding of the
impact on the coal industry—is to focus on several of the competitive wholesale
markets in the U.S. that have significant amounts of installed coal capacity and
increasing amounts of wind generation. Those regions are the Southwest Power
Pool (SPP), the Mid-Continent Independent System Operator (MISO), the Electric
Reliability Council of Texas (ERCOT), and PJM (the grid operator for all or parts of
13 states in the Midwest and Mid-Atlantic plus the District of Columbia). (The focus
is on wind in the charts below because much of the installed solar capacity is
situated in California, which has no coal generation to speak of, or in southwestern
and western states that lack competitive wholesale markets.)

As the two charts illustrate, installed wind capacity and generation have risen
sharply in three of the four wholesale markets. Renewable generation in the PJM
market has risen, but much more slowly, largely because PJM is one of the focal
points of the natural gas fracking revolution and its wind resources are not as
attractive as those in the other three independent system operators (ISOs). Neither
development—rising wind or natural gas generation—has been good for coal.

Figure 9: Installed Wind Capacity in the Competitive ISOs

Source: Data from SPP, ERCOT, MISO, and PJM websites; IEEFA analysis.
Coal Outlook 2019:
Domestic Market Decline Continues                                                         16

Figure 10: Wind Generation Market Share in the Competitive ISOs

Source: Data from SPP, ERCOT, MISO, and PJM websites; IEEFA analysis.

The problem for coal, on this front, is that renewable generation comes with zero
variable costs, meaning when those resources are available, they are almost certain
to be the first choice of a utility or the operator running the local area transmission
grid. Meanwhile, booming gas production in the Marcellus and Utica shale
formations has turned natural gas generation units into market makers, also at
coal’s expense, as the figure below illustrates.
Coal Outlook 2019:
Domestic Market Decline Continues                                       17

Figure 11: Coal Generation in the Competitive ISOs

Source: Data from SPP, ERCOT, MISO, and PJM websites; IEEFA analysis.
Coal Outlook 2019:
Domestic Market Decline Continues                                                         18

Figure 12: Coal Generation Market Share in the Competitive ISOs

Source: Data from SPP, ERCOT, MISO, and PJM websites; IEEFA analysis.

Renewable Energy’s Impact on the Generation Supply Curve
The impact that no-variable-cost renewables and low-cost natural gas plants have
on existing coal plants can be easily shown by returning to Georgia Power’s Plant
Wansley discussed above. The graph that follows charts Georgia Power’s generation
supply curve. The circles represent a generating unit on the utility’s system, starting
at the far left with the roughly 790MW of existing zero variable cost solar installed
in the state. Moving to the right, the Wansley NGCC units come in at a variable cost
of roughly $22.50 per MWh, while further to the right is Georgia Power’s Scherer
coal plant, the lowest-cost coal unit on its system at about $28.30/MWh. Finally, the
two-unit Wansley coal plant comes into view, with a variable operating cost of about
$37/MWh. The three vertical lines are also key, showing, from left to right, the
utility’s minimum (about 5,000MW), average (about 10,000MW) and peak (about
16,000MW) loads in 2017.

Put natural gas and renewables together and the problem facing coal in Georgia—
and elsewhere—is stark. The Wansley CC gas plant will run essentially all the time,
while the Scherer plant generally will only be needed on days with above-average
demand or when other units are unavailable. This is borne out by the plant’s
Coal Outlook 2019:
Domestic Market Decline Continues                                                          19

generation over the past few years. The four-unit facility is the nation’s largest
operating coal-fired power plant and from 2000-2011 its average capacity factor
was more than 75%. Since then, its capacity factor has declined steadily, hitting
47.7% in 2017 and 51.9% in 2018. (Georgia Power operates all four Scherer units,
but has no ownership stake in Unit 4, which is why only three units are included in
the figure below.)

As for the Wansley coal plant, it will only be needed on the hottest and coldest of
days, as demonstrated by its 18% capacity factor in 2018. And the problem for coal
grows only more pronounced as more renewable capacity is added to Georgia
Power’s grid, which is happening continually, with Silicon Ranch recently
announcing plans for a $150 million investment in three projects in the state
including a 102.5MW unit that will supply a Facebook data center. Ever-rising totals
of zero variable cost generation will drive coal plants further and further down the
energy dispatch curve.

Figure 13: Georgia Power's Generation Supply Curve

Source: IEEFA analysis, S&P Global Market Intelligence data.27

27   The supply curve is illustrative, not representative of an actual day’s generation.
Coal Outlook 2019:
Domestic Market Decline Continues                                                             20

More Wind and Solar Are On the Way in 2019
Looking ahead, IEEFA sees the coal sector’s problems worsening. Construction of
new wind and solar capacity is surging across the country, and each and every unit
that comes online has an immediate impact on the generation supply curve, pushing
existing fossil fuel resources to the right on the supply curve and making the
economics of competing in the market that much more difficult.

This year, EIA projects that 24 GW of new generating capacity will be added in the
U.S., 46% of which will be wind and 18% solar. Much of this new capacity will be
located in the competitive wholesale markets discussed earlier:

     1. More than 80% of the 10,440 MW of new capacity expected to be added in
        ERCOT will be wind or solar.

     2. Wind is expected to account for 75% of the 8,600 MW of new capacity
        planned for MISO.

     3. Just under 80% of the 4,900 MW of the new capacity expected to be added in
        SPP will be wind.

In addition, the American Wind Energy Association notes that just under 6,000 MW
of capacity in 17 states came online during the fourth quarter of 2018, meaning that
this generation’s impact on dispatch decisions is only beginning to be felt. All told,
the group says more than 35 GW of capacity is currently under construction or in
advanced development.28

On the solar side, there currently is 34.3 GW of operating utility-scale capacity, with
another 23.8 GW either under construction or having a signed PPA in hand, bringing
the total to just over 58 GW. Going forward, SEIA estimates that roughly 68GW of
new capacity (about 60% of which will be utility-scale PV) will be brought online
through 2023, all pushing down the need for coal generation, especially given the
largely flat demand curve for electricity nationwide.

The Absence of Demand Growth
The EIA’s latest data shows net electricity generation climbing 3.6% in 2018 to
4,178 million MWh, topping the previous peak of 4,157 million MWh set in 2007.
The increase was largely weather related, with more heating degree days in the
winter and more cooling degree days in the summer, which pushed residential retail
sales up by 6% during the year.

28According to the American Wind Energy Association (AWEA), a wind unit in “advanced
development” means that it has a signed PPA, has announced a turbine order or is owned by a
utility, and has a high likelihood of getting built and entering commercial operation.
Coal Outlook 2019: Domestic Market Decline Continues 21 Figure 14: U.S. Electricity Sales Have Flat-Lined Source: EIA. These sales totals do not include distributed solar generation, particularly residential rooftop solar, which now totals about 12 GW of total capacity nationwide. The EIA calculates that these customer-sited installations generate about 30 million MWh of electricity, compared to 1 million MWh a decade earlier. In other words, without these units, total electricity sales last year would have been well over 4,200 million MWh. Strong growth in energy efficiency also has helped to keep electricity demand in check, in spite of steady economic growth overall. For coal, flat growth is a problem, particularly in connection with the continued construction of new renewable and natural gas-fired generation. These cheaper resources are taking an ever-larger share of what has been the same-sized pie for the past decade. The Game-Changing Impact of Storage We expect the continued rollout of energy storage, both stand-alone utility-scale batteries and linked solar and storage, to begin having a substantial impact on the electricity generation market this year and to grow significantly in importance in the years to come. Price declines in lithium-ion batteries, the most commonly used option today, have brought the cost in line with more conventional options, which has prompted some utilities to begin adopting the technology; more will follow.
Coal Outlook 2019:
Domestic Market Decline Continues                                                           22

For example, in Nevada, NV Energy is moving ahead with plans to install 1,001 MW
of new solar capacity along with 100 MW/400 MWh of storage capacity. A key
rationale for the new capacity, and the storage assets in particular, is to enable the
company to retire Unit 1 at the North Valmy coal plant by 2021. Three of the solar
facilities, totalling 401 MW in capacity, and all of the storage are located in the
northern portion of the state, as is North Valmy. The new renewable capacity and
storage is scheduled for completion by 2021, which will enable the coal plant’s
closure without compromising reliability, the company has said.29 Before these solar
and storage proposals came to fruition, NV Energy had asked state regulators to
delay the plant’s closure until 2025, because otherwise it would not be able to
guarantee the system’s reliability.

North Valmy 1, with a net summer capacity of 254 MW, has largely operated only
from June-September for the past three years, providing electricity during the high-
demand Nevada summer. During those three years, the unit’s average capacity
factor has ranged from 38%-46%. The unit’s highest monthly output was 138,000
MWh, in July 2018.30

While not designed to be a one-to-one replacement, but rather to serve systemwide
needs, the new solar and storage should have no trouble matching the coal plant’s
output. The area gets roughly 15 hours of daylight daily during July, and full output
for 8 hours per day would generate 3,208 MWh daily or 99,448 MWh for the month.
Using 50% production for an additional six hours daily produces 1,203 MWh daily,
or 37,293 MWh during the month. In addition, solar storage provides 400 MWh that
can be used when needed and recharged when not in use, helping to provide the
reliability that addresses the variability critique leveled by coal and nuclear
proponents against both wind and solar.

And it is not just in the sunny Southwest
that solar plus storage is disrupting the
utility sector and undercutting coal plant
economics. Northern Indiana Public                   It is not only in the sunny
Service Company’s blockbuster decision               Southwest that solar plus
last year to pursue the phase-out of its                storage is disrupting
coal-fired generation over the next 10
years demonstrates how the economics of                   the utility sector.
solar-plus-storage have changed, and the
threat this poses for coal generation.

NIPSCO serves some 466,000 customers in the northern third of Indiana and, like
other utilities in the state, relies heavily on coal for its electricity needs, currently
getting more than 60% of its generation from two coal plants. When the utility
solicited bids for future power supply needs as part of its most recent integrated
resource planning process, it received some competitive proposals that convinced
NIPSCO’s executive team that change was both possible and economic. In its
preferred resource plan released late in 2018, the utility proposed adding 1,145

29 Power Magazine. NV Energy Accelerates Retirement of One of Nevada’s Last Coal Units.
December 27, 2018.
30 Data from S&P Global Market Intelligence.
Coal Outlook 2019:
Domestic Market Decline Continues                                                          23

megawatts (MW) of solar and solar-plus-storage by 2023, which would push its
renewable generation well above 50% and its coal-fired power capacity down to
17%.31

What is most striking is that these developments are occurring even though the
market is still in early development. In its most recent outlook for the Energy
Storage Association, Wood Mackenzie reported that 310.5 MW of new storage
capacity was installed in the U.S. in 2018, and behind-the-meter applications
(largely smaller storage units installed with residential rooftop solar systems)
accounted for more than half of that total.32

Wood Mackenzie expects annual growth to speed up quickly, doubling in 2019 to
almost 650 MW and then almost tripling in 2020, with a growing share of the total
coming from front-of-the meter or utility applications.33

Numbers aside, perhaps the best take on the rapidly developing renewable energy
and storage market was offered by Jim Robo, chairman and CEO of NextEra Energy,
which brands itself as the world’s largest producer of solar and wind energy. During
the company’s 2018 earnings call in January, Robo said:

“In 2018, more than 40% of the solar projects that were added to our backlog
included a battery storage component, highlighting the beginning of the next phase
of renewables development that pairs low cost wind and solar energy with a low-
cost battery storage solution. With continued technology improvements and cost
declines, we expect that without incentives wind is going to be a 2 to 2.5 cent per
kilowatt-hour product and solar is going to be a 2.5 to 3 cent per kilowatt-hour
product early in the next decade.

“Combining these extremely low costs with a one-half to three-quarter cent adder
for a 4-hour storage system will create a nearly firm renewable generation resource
that is cheaper than the operating cost of coal, nuclear and less fuel-efficient oil and
gas-fired generation units. We continue to believe that this will be massively
disruptive to the nation’s generation fleet and create significant opportunities for
renewables growth well into the next decade.”

While we believe that Robo is right, we think that solar-plus-storage (and wind to a
lesser degree) will push the industry to recognize the fact that early retirements of
coal-fired generation units are both feasible from a reliability perspective and cost-
effective in terms of dollars and cents.

The Push for Clean Energy: From Utilities, Businesses and
Consumers
The close working relationship that previously existed between the utility and coal
industries has changed notably in the past several years. Today, a growing number
of utilities have committed to coal phase-out plans over varying stretches of time.

31 NIPSCO Integrated Resource Plan 2018. p. 186.
32 Q4 Energy Storage Monitor, Wood Mackenzie.
33 Ibid.
Coal Outlook 2019:
Domestic Market Decline Continues                                                                      24

And even when a complete phase-out plan has not been adopted, long-term utility
resource plans increasingly conclude that closing coal plants and replacing that
capacity, if needed, is the preferred economic alternative.

Last month, for example, just prior to releasing its proposed long-term resource
plan, the Tennessee Valley Authority (TVA) voted to close the 971MW Paradise and
the 870MW Bull Run coal plants. In discussing the closures, TVA CEO Bill Johnson
said: “Analysis over the past several months shows that closing two additional fossil
fuel plants is the right action to take at this time, financially and operationally. It is
not about coal. This decision is about economics.”34

This decision is just the latest in a string of closures in the past 10 years that have
cut the TVA’s reliance on coal from 58% in 2008 to 24% today. And further
reductions are obviously on the way.

Other utilities are moving in the same direction, pushed by the economics that have
turned coal into a higher cost resource than either natural gas or renewables. This
new approach is best epitomized by Ben Fowke, chairman, CEO and president of
Xcel Energy. Early last year, Fowke had this to say: “Coal is on the way out. I will tell
you, it's not a matter of if we're going to retire our coal fleet in this nation, it's just a
matter of when.”35 Then, in December, Fowke and Xcel went even further,
committing the company to being carbon-free by 2050. While a step outside the
bounds of this report, Fowke’s justification for pursuing the carbon-free goal is
relevant. First, he noted that improvements in technology had made more rapid
reductions in carbon emissions possible. Second, he pointed out that customers
were asking for it.

This customer interest or, in reality, demand is a key driver of the market erosion
affecting the coal industry. Utilities are being pushed hard to get out of coal by many
of their largest corporate clients, who in turn are catering to customer preferences.
Led by household-name companies like Apple, Facebook, and Google, U.S.
corporations have signed deals for more than 15 GW of renewable energy power
supplies in the five years through 2018 (see figure below), and as we saw earlier,
these deals continue to get signed.

Beyond these direct purchases, companies have been pushing utilities to offer green
tariffs so that they can buy clean electricity without being forced to negotiate their
own separate power supply deals. Large companies are also beginning to factor the
availability of renewable energy resources into their expansion and/or relocation
plans, a trend that is further pushing utilities toward cleaner alternatives.

34 Knoxville News. TVA to close coal-fired power plants in Kentucky, Tennessee. February 14,
2019.
35 Greentech Media. Xcel CEO Says Retiring the U.S. Coal Fleet ‘Just a Matter of When.’ Julia Pyper.

June 8, 2018.
Coal Outlook 2019:
Domestic Market Decline Continues                                                      25

Figure 15: Rising Number of Companies Signing Green Energy Deals

Source: Rocky Mountain Institute.

Coal Company Finances
Some of the leading U.S. coal companies posted positive results in 2018. But those
reports hinged on strong demand for both thermal and metallurgical coal exports
and high prevailing prices worldwide. In contrast, the industry’s principal market,
the domestic electric generation sector, continued to shrink. And the industry as a
whole fared poorly in the stock market in 2018, with the Dow Jones coal index
dropping from $67.09 at the beginning of the year to $52.78 by the end, a 21.3%
drop.36

In its 2018 earnings release, Peabody touted three positive developments. First, its
acquisition of the Shoal Creek Mine in Alabama, which sold 2.4 million tons of
metallurgical coal for export in 2017. Second, the strong pricing for both thermal
and metallurgical seaborne coal. And third, its continued, aggressive stock buyback
program, geared to helping investors and creditors in the company following its
April 2016 bankruptcy, which had allowed it to shed more than $5 billion in debt.

References to the company’s principal market, U.S. thermal coal sales, were more
muted, focusing on a hoped-for increase in demand due to low utility stockpiles.

36   S&P Dow Jones indices. Accessed March 18, 2019.
Coal Outlook 2019:
Domestic Market Decline Continues                                                         26

Looking ahead, however, glimmers of concern were evident in the company’s
outlook. Acknowledging that its Powder River Basin thermal coal assets are under
stress, the company said it would cut production at its flagship North Antelope-
Rochelle mine by 10 million tons in 2019 because of falling U.S. demand. The mine,
the largest in the U.S., produced 98.3 million tons of coal in 2018 and accounted for
about 13.1% of all U.S. coal production in 2017, according to federal data and IEEFA
research.

Elsewhere, Peabody said it would be “easing production across several complexes”
in the Midwest. And it said that it expected to shut down the Kayenta Mine in
Arizona in the third quarter of 2019 due to the planned closure of the Navajo
Generating Station (NGS) at the end of the year. Kayenta, a dedicated mine with NGS
as its sole customer, has sold an average of more than 7 million tons of coal to the
Navajo facility annually since 2012.

Regardless of how executives have spun the results, the stock market has not been
impressed, with Peabody’s share price dropping from $38.50 a year ago to less than
$30 recently.

Much like Peabody, Arch Coal in its 2018 earnings call, highlighted plans to open a
new metallurgical mine in West Virginia capable of producing 3 million tons of high-
quality coking coal annually, much of which the company plans to export. Given
prevailing coking coal prices, Arch said it could recover the $360-$390 million
capital investment in the new mine in as little as 18 months.

But the outlook is not nearly so bright for Arch’s domestic thermal coal market.
Production from the company’s two Powder River Basin coal mines totalled 79.5
million tons in 2018, with 8 million tons produced at the Coal Creek mine and the
remainder coming from the company’s Black Thunder mine. For 2019, Arch says it
expects to produce between 70 and 80 million tons of coal at the Black Thunder
facility. Operations at the Coal Creek site, which produces lower-quality coal, will be
“much reduced” this year, the company said.

By comparison, as recently as 2015, production at the Black Thunder mine was just
less than 100 million tons, while in 2011 it was more than 116 million tons.

Arch’s creditors and early post-bankruptcy investors have done well since the
company re-emerged with nearly $5 billion in debt wiped off its books in October
2016. Recent results have not been as positive, with the stock now trading at around
$91 per share recently compared to $93 a year ago.

Cloud Peak Energy, another major U.S. thermal coal producer, is currently on the
edge of bankruptcy and delisting from the New York Stock Exchange. It has said that
production from its export-oriented Spring Creek PRB mine rose by 1 million tons in
2018, but that increase was not nearly enough to offset a more than 9 million ton
decline at its two domestic-focused thermal coal mines, Cordero Rojo and Antelope.
Coal Outlook 2019:
Domestic Market Decline Continues 27
The company this month announced that it lost $718 million in 2018 and
acknowledged in an SEC filing that there were serious questions about its viability.37
Shares in Cloud Peak stock have tumbled in the past year, dropping from around
$3.50 to about 20 cents as of March 18, 2019.
The other publicly traded coal companies include:
CONSOL Energy, a major Eastern producer, sold a record 27.7 million tons of
coal in 2018 from its Pennsylvania Mining Complex (PAMC). Its stock price
has gone up from $30.18 to just under $37.57 in the past year, but it is worth
noting that the sales increases at PAMC in the past two years are due almost
exclusively to a rise in thermal coal exports.
Foresight Energy, an Illinois Basin coal producer, mined a record 23.4
million tons of coal in 2018. Despite the record production, the company lost
$61.6 million for the year and its stock price has dropped from $3.90 in
March 2018 to $2.70 on March 18, 2019.
Warrior Met, a leading producer of metallurgical coal, mined 7.7 million tons
in 2018. Despite the record output and strong pricing for its export-destined
product, the company’s adjusted net income fell slightly in 2018 from the
prior year and its stock price has dropped from $31.50 last March to $28.60
currently.
And there also is the case of Westmoreland Coal, one of the oldest publicly traded
coal miners in the U.S. The company filed for bankruptcy in October, 2018, reporting
$1.4 billion in debt and just $770 million in assets.38 Founded in 1854, the company
owned several mines serving power plants with uncertain futures, included the
Colstrip power plant in Montana and the San Juan plant in New Mexico. The
company emerged from bankruptcy on March 15, 2019 as a privately held company
owned and operated by a group of its former creditors.39
Coal Exports
Exports have never been a major segment of the U.S. coal market, generally
accounting for less than 10% of U.S. production. In 2017 and 2018 that changed.
Exports in 2017 totalled 97 million tons, 12.5% of the year’s overall 774.6 million
tons produced. Unexpectedly, at least in our view, the increase continued in 2018,
with exports rising to 115.6 MT and accounting for 15.4% of the year’s 753.7 MT in
production.
The U.S. has been a traditional and relatively consistent exporter of metallurgical
coal used in steelmaking. Since 2010, U.S. coal companies have exported an average
37 S&P Global Market Intelligence. Cloud Peak stalls on debt payment, starts clock on potential
bankruptcy filing. March 15, 2019.
38 The Denver Post. Englewood-based Westmoreland Coal files for bankruptcy. October 9, 2018.
39 S&P Global Market Intelligence. Westmoreland Coal emerges from bankruptcy as
Westmoreland Mining. March 15, 2019.Coal Outlook 2019: Domestic Market Decline Continues 28 of 58.3 MT, with the largest share of that going to European steelmakers. Other major importers of U.S. metallurgical coal include Canada, Brazil, Japan and India. While a consistent source for exports, metallurgical coal demand is a limited market. Coal companies with the right reserves in the right locations can profit from this market. Witness Arch Coal’s plans for its new met coal export mine. Figure 16: Variability of U.S. Coal Exports Source: EIA (STEO, March 2019). Turning to the thermal coal side of the export market, the U.S. has traditionally been regarded as a swing supplier, selling into the market when other suppliers could not meet demand, largely because the distance from the U.S. to major importers such as India and other Asian countries rendered the economics borderline except during the strongest markets. The past two years have been just that, strong markets that pushed U.S. thermal coal exports up sharply. In 2017, those markets more than doubled, to more than 41 MT from 19.7 MT in 2016. The upswing continued in 2018, with total thermal exports hitting 54.2 MT. Thermal coal exports to India accounted for much of the growth, climbing 92% to just under 9 million tons from 2017 through the end of September in 2018. As quickly as these exports go up, they can fall, as the graph above illustrates. We believe the mini-export boom of the past couple years has hit its peak. European countries are moving quickly to reduce their thermal coal consumption, and more than 20% of current U.S. shipments are bound for Europe. In addition, India has aggressive plans to reduce its reliance on coal-fired generation, and in the Indian market, U.S. exporters face intense competition from Australia and other closer-to- market suppliers.
Coal Outlook 2019:
Domestic Market Decline Continues                                                                   29

As Stephen Doyle, the founder of Doyle Trading Consultants who now runs
BtuBaron LLC, warned last month: "If this export market of ours cycles down, we're
in big trouble because that coal is not going to have a home in the United States."40

We think the problem of diminishing export demand is going to begin showing up
this year, with markets for U.S. thermal coal declining around the world due to
slowing economic growth, government policies to curb coal consumption, continued
development of renewable energy technologies and competition from other
exporters.

Conclusion
The outlook for the U.S. coal industry is one of continuing decline. Cheaper, cleaner
generation options are readily available, and utilities increasingly are turning to
those alternatives for their capacity needs, as the steady decline in coal’s market
share demonstrates.

We expect this transition to continue and perhaps even quicken this year and into
the 2020s, driven by the ready availability of low-cost natural gas and the steadily
rising amount of renewable energy generating capacity. Utility-scale storage will
serve to further undercut coal’s competitiveness, dispelling already declining
concerns over variable energy generation.

Coal companies likely will continue talking up their export plans, but we do not
believe this is a long-term growth strategy for the industry. Metallurgical coal
exports are limited by the productive capacity of the steel industry and can never
serve as a replacement for the industry’s declining domestic coal sales. At the same
time, efforts to replace lost domestic thermal coal sales by boosting exports will be
constrained by changing overseas markets, particularly efforts in Europe and India
to reduce their coal use, and the inherent problems associated with the U.S.’s
geographic distance from most major importers.

It is not a good time to be a coal producer. We do not expect that to change this year.

40S&P. Global hesitation to invest in coal is boon to US exporters, consultant says. February 26,
2019.
Coal Outlook 2019:
Domestic Market Decline Continues                                                      30

       About IEEFA
       The Institute for Energy Economics and Financial Analysis conducts
       research and analyses on financial and economic issues related to energy
       and the environment. The Institute’s mission is to accelerate the transition
       to a diverse, sustainable and profitable energy economy. www.ieefa.org

       About the Authors
       Dennis Wamsted
       Associate Editor Dennis Wamsted has covered energy and environmental
       policy and technology issues for 30 years. He is the former editor of The
       Energy Daily, a Washington, D.C.-based newsletter.

       Seth Feaster
       Data Analyst Seth Feaster has 25 years of experience creating visual
       presentations of complex data at The New York Times and more recently at
       the Federal Reserve Bank of New York. He specializes in working with
       financial and energy data.

       David Schlissel
       Director of Resource Planning Analysis David Schlissel has been a regulatory
       attorney and a consultant on electric utility rate and resource planning
       issues since 1974. He has testified before regulatory commissions in more
       than 35 states and before the U.S. Federal Energy Regulatory Commission
       and Nuclear Regulatory Commission. He also has testified as an expert
       witness in state and federal court proceedings concerning electric utilities.
       Schlissel has consulted for publicly owned utilities, state governments and
       attorneys general, state consumer advocates, city governments, and national
       and local environmental organizations.
You can also read